SPSS Statistical Product and Service Solutions Abdul Aziz
 Abdul Aziz Setiawan STF Muhammadiyah Tangerang 2020")
SPSS (Statistical Product and Service Solutions) Abdul Aziz Setiawan STF Muhammadiyah Tangerang 2020
 Adalah suatu program komputer statistik yang mampu mengolah/memproses")
SPSS (Statistical Product and Service Solutions) Adalah suatu program komputer statistik yang mampu mengolah/memproses data statistik secara cepat dan tepat, untuk mendapatkan berbagai hasil/keluaran yang dikehendaki para pengambil keputusan

Komponen SPSS 1. Data Collection, mengumpulkan data untuk pengolahan data 2. Data Preparation, persiapan data untuk pengolahan data lebih lanjut 3. Data analysis & Data mining, menyediakan berbagai perhitungan statistik untuk pengolahan data 4. Data deployment, mendistribusikan hasil pengolahan data (informasi)
 Pada Komputer Data Input Proses Komputer Data")
Cara Kerja SPSS (analogi dengan proses komputer) Pada Komputer Data Input Proses Komputer Data Output Proses Statistik Data Output Pada Statistik Data Input

Window Pada SPSS 1. 2. 3. 4. 5. 6. 7. Data Editor q File, Edit, View, Data, Transform, Analize, Graphs, Utilities, q Window, Help Menu Output Navigator Insert, Format Menu Pivot Table Editor Menu Chart Editor Gallery, Chart, Series Menu Text Output Editor Menu Syntax Editor Menu Script Editor


Getting Help n Various ways to get help through the SPSS Help system. n Select Help|Topics. Very useful giving information about how to carry out particular tasks. n Select Help|Case Studies. Provides hands-on examples of how to create various types of statistical analyses and how to interpret the results. n Select Help|Statistics Coach. Designed to assist in data analysis by leading you through a series of questions about your data and what you want to do with your data.

Data View n n n Two different views within the data editor in SPSS Data View – Used for entering, editing and modifying data. Very much like an excel spreadsheet.

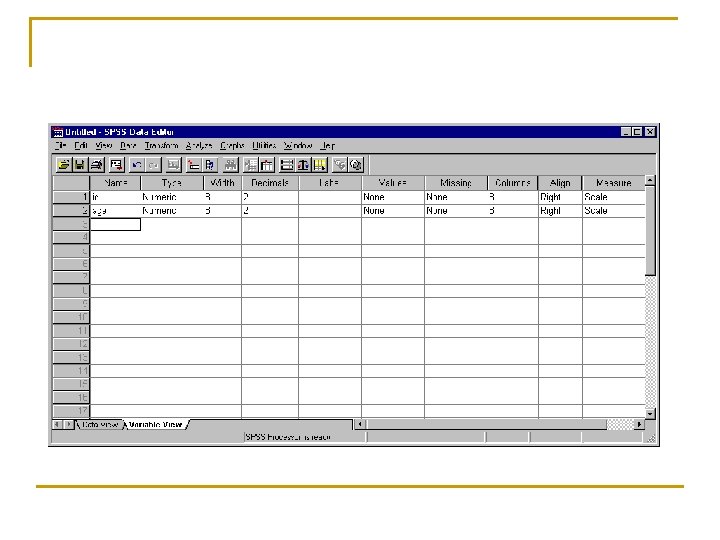
Variable View n Used to define the type of information that is entered in to each column in data view.

Variable View n Variable View with a data set already loaded in SPSS:

The data entry process n n Define your variables in Variable View Enter the data, the values of the variables, in Data View

Definition of variables 10 characteristics are used to define a variable: Name Type Width Decimals Values Missing Column Align Label Measure

Name n n Each variable must have a unique name of not more than 8 characters and starting with a letter Try to give meaningful variable names: q q n Describing the characteristic: for example, age Linking to the questionnaire: for example, A 1 Q 3 Keep the names consistent across files
 Date n Output formats:")
Type n Internal formats: q q q Numeric String (alphanumeric) Date n Output formats: q q q Comma Dot Scientific notation Dollar Custom currency

Numeric n n Numeric variables: q Numeric q Codes measurements Definition of the size of the variable
 n n String variables contain words or characters; strings can include numbers")
String (alphanumeric) n n String variables contain words or characters; strings can include numbers but, taken here as characters, mathematical operations cannot be applied to them The maximum size of a string variable is 255 characters

Date n n The input format for date variables must be defined, such as DD/MM/YYYY, MM/DD/YYYY or MM/DD/YY Computers store dates as numbers from a base date; in SPSS, dates are stored as the number of seconds from 14 October 1582

Example n Create two variables: q q ID: the unique identifier, which will be alphanumeric with a maximum of 8 characters Age: the age of the respondent measured in years, a discrete variable ranging between 10 and 100

Click here

Click on the String radio button and change the characters to the size of the variable, 8 in this case. Click OK.

Click on the Type column in the second row and define a numeric variable with a maximum size of 3 with no decimal points. Click on OK to continue.

Note that a number of default values have been entered into the remaining columns.

Labels n n n Descriptors for the variables Maximum 255 characters Used in the output

Variable labels added

Values n n Value labels are descriptors of the categories of a variable Coding

Missing n n n Defines missing values The values are excluded from some analysis Options: q q Up to 3 discrete missing values A range of missing values plus one discrete missing value

Click in the Missing Values column to obtain the dialogue box below. Enter the value 999 for Age.

Missing values added

Columns and Align n Columns sets the amount of space reserved to display the contents of the variable in Data View; generally the default value is adequate Align sets whether the contents of the variable appear on the left, centre or right of the cell in Data View Numeric variables are right-hand justified by default and string variables left-hand justified by default; the defaults are generally adequate

Measure n Levels of measurement: q q n n n Nominal Ordinal Interval Ratio In SPSS, interval and ratio are designated together as Scale The default for string variables is Nominal The default for numeric variables is Scale

Returning to Data View, the first two column headings will reflect the two variables created: ID and Age. Here the first six observations have been entered.

Exercise: define the necessary variables and enter the following data

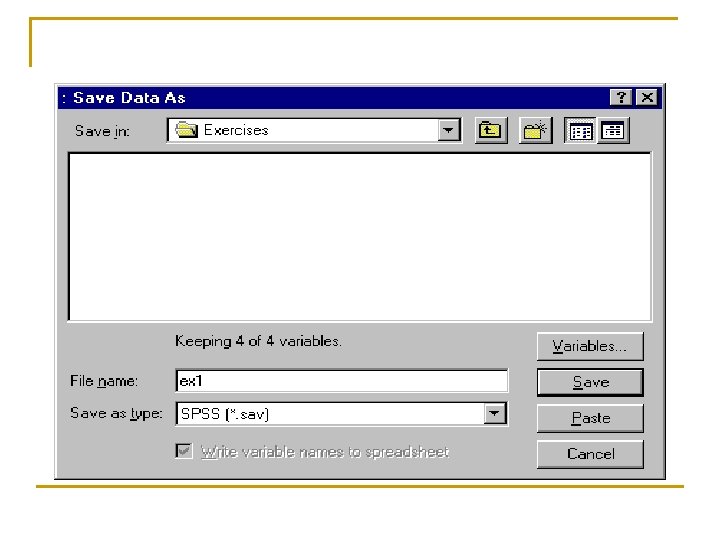
Saving the file n The file must always be saved in order to save the work that has been done to date: q q File/Save Move to the target directory Enter a file name Save

Reading in Data from Excel to SPSS Option 1: Copy and paste data from another spreadsheet directly into the Data Editor. Option 2: 1 Start SPSS. 2 Select File → Open → Data 3 Change the Files of type field to Excel (*. xls) 4 Select your Excel file and click Open 5 Check that the box labelled “Read variable names from the first row of data” is ticked and click OK (that is if the first row in excel contains your variable names, otherwise leave unticked) 6 Your data should now appear in the SPSS data editor.

Output Viewer n Where results of statistical analysis performed via analyze are displayed (will open automatically when analysis is performed).

Saving the Data Worksheet n Although you can click directly on the Save button the Data Editor window a better approach is to select File|Save As n Using an incremental numbering system for file names allows you to keep the most recent files and older copies. C: USERSHEALTH 1. SAV C: USERSHEALTH 2. SAV C: USERSHEALTH 3. SAV in

Saving Results n In the output viewer window the output can also be saved by choosing File|Save As

Finishing with SPSS n Bring the Data Editor window to the top and choose File|Exit. n Remember to save your worksheet &/or results first if required.
- Slides: 40