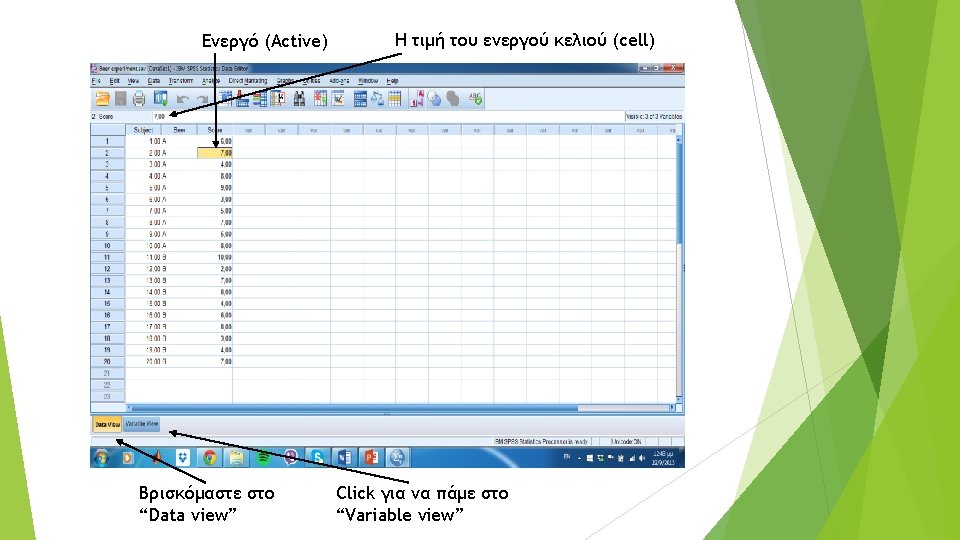
SPSS Data editor Viewer Syntax editor Data editor


 to the")


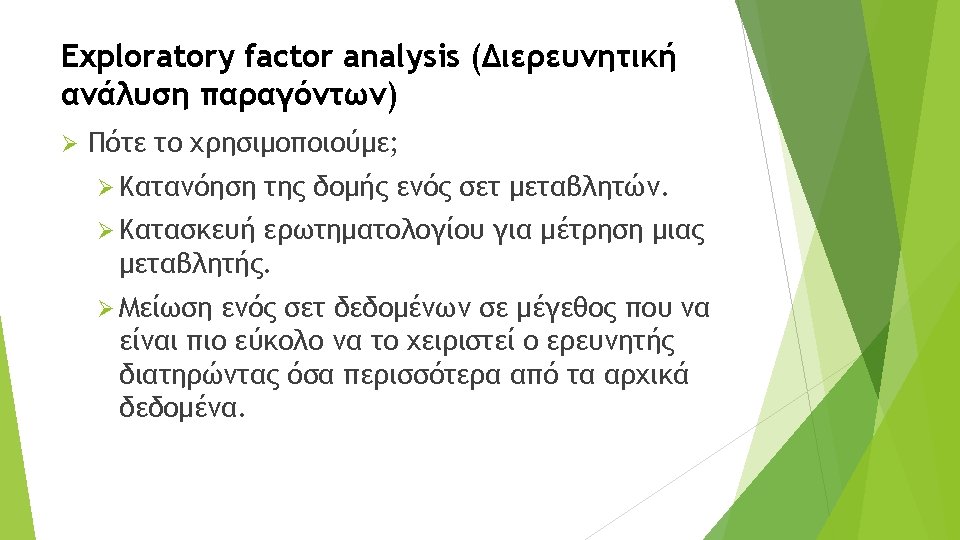
 test Ø Έχουν τα δεδομένα μας φυσική κατανομή; Ø Υπάρχουν outliers;")


")


")
")


 Ø Independent(s) -> Predictor")

 value of the F-ratio")


- Slides: 100
SPSS Ø Data editor Ø Viewer Ø Syntax editor
Data editor Ø File: Save data, graphs, or output, open files, print graphs or output Ø Edit: Cut/Copy and Paste Ø View: System specifications (e. g. , display value labels) Ø Data: Make changes in the data editor Ø Ø Transform: Manipulate one of the variables Ø Ø Insert variable, Insert cases, Split file, Select cases Recode, Compute Analyze: The fun begins here Ø Statistical procedures Ø Graphs Ø Window: Switch from window to window Ø Utilities: Data File Comments Ø Help: Online help on the system itself and the statistical tests
Variable view Ø Δημιουργία μεταβλητών Ø Ø Πριν την καταχώρηση δεδομένων Χαρακτηριστικά των μεταβλητών Ø Name Ø Type: Numeric, String, Currency, Data Ø Width (default: 8) Ø Decimals (default: 2) Ø Label: Longer variable description Ø Values: Numbers that represent groups of people Ø Missing: Missing data Ø Columns: How many characters are displayed in the column Ø Align: Left, Right, Center Ø Measure: Nominal, Ordinal, Scale
Creating a string variable Ø Move the on-screen arrow (using the mouse) to the first white cell in the column labelled Name. Ø Type the word Name. Ø Move off this cell using the arrow keys on the keyboard or click on a different cell. Ø Ø Αλλάζω τον τύπο (type) της μεταβλητής: Numeric Measure Nominal String
Creating a date variable Ø Move to the cell in row 2 and type the word “Birth_Date” Ø Move to the column Type Ø Αλλάζω τον τύπο (type) της μεταβλητής: Numeric Date
Creating a coding variable Ø Coding variable or grouping variable Ø Χρησιμοποιώ αριθμούς οι οποίοι αντιστοιχούν σε ομάδες δεδομένων (π. χ. , άντρες – γυναίκες, πειραματική ομάδα – ομάδα ελέγχου) Ø Είναι numeric variable αλλά οι αριθμοί αντιστοιχούν σε ονόματα (δηλ. Είναι nominal variable) Ø Αντιστοιχούν σε ανεξάρτητες μεταβλητές (between-subjects) Ø Move in the third row and type the word “Group” Ø Move in the third row to the column called ‘Label’ and give the variable a full description, e. g. , “Is the person a lecturer or a student? ” Ø To define the group codes move along the row to the column labeled ‘Values’ Ø Ø 1 for Lecturer, 2 for student Measure Nominal or Ordinal (if the groups have a meaningful order)
Creating a numeric variable Ø Number of friends Ø Variable view Ø Αλλάζω τον τύπο (type) της μεταβλητής Ø Decimals ‘ 0’ Ø Measure Scale ‘Friends’ Numeric
Missing values Ø We choose a numeric value to represent the missing data point Ø This value tells the SPSS that there is no recoded value for a participant for a certain variable. Ø The computer then ignores that cell of the data editor. Ø Be careful: the chosen code not to correspond to any naturally occurring data. Ø Click in the column labeled ‘Missing’ Ø Select discrete values Assign a different meaning to each discrete value (e. g. , 8 ‘not applicable’, 9 ‘don’t know’, 99 ‘no response’) Ø Select a range of values Ø To have a range of values and one discrete value
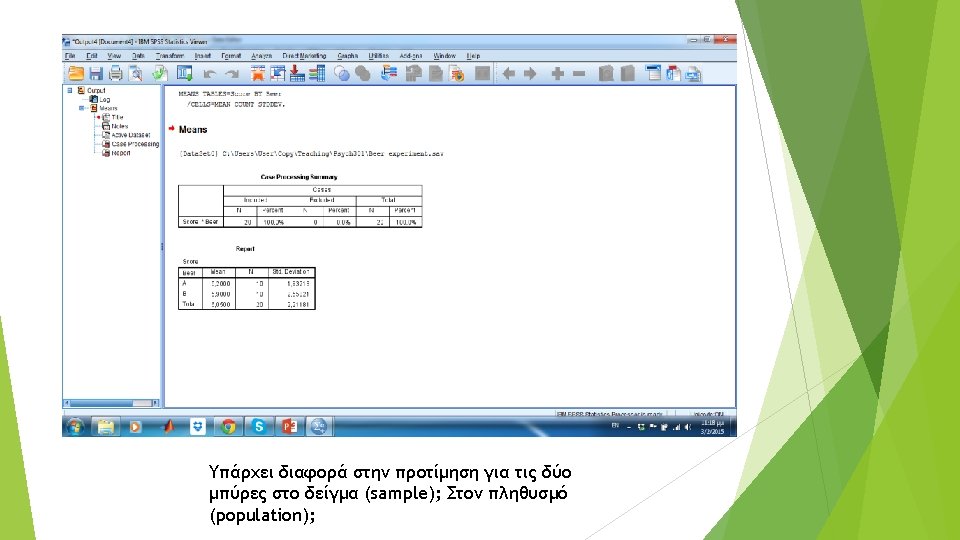
The SPSS Viewer Tree Diagram of the Current Output Results of Statistical Analysis
The Syntax Editor Ø Usually for doing advanced things Ø If you often carry out very similar analyses on data sets Ø Ø Quicker to do the analysis and save the syntax Ø Paste button File New Run Ø Selection Ø Current Ø To End Syntax
The Syntax Editor
Saving files Ø Data analysis Ø Output Ø Syntax file . sav . spv. sps
Retrieving a file Ø File Open Ø Data Ø Output Ø Syntax
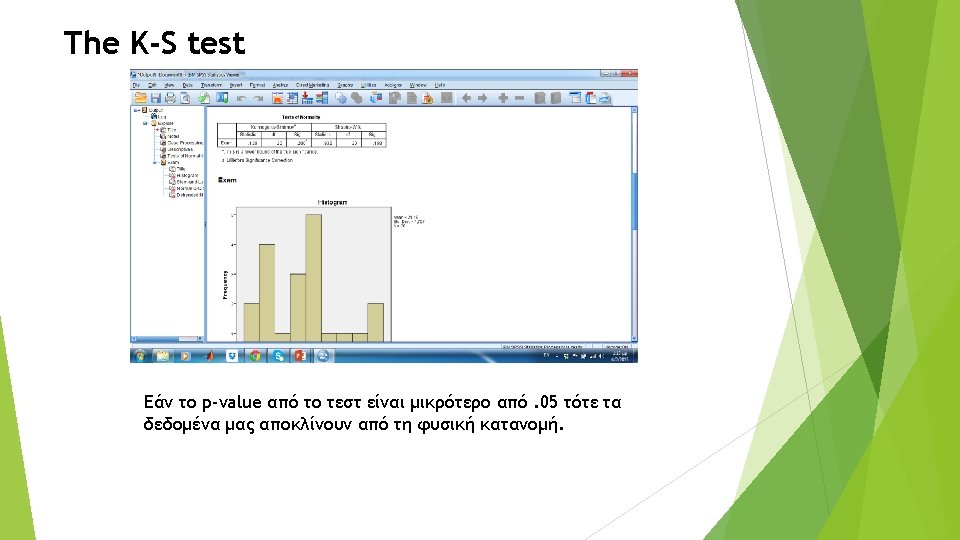
The Kolmogorov-Smirnov (K-S) test Ø Έχουν τα δεδομένα μας φυσική κατανομή; Ø Υπάρχουν outliers; Ø Analyze ⇒Descriptive Statistics ⇒ Explore
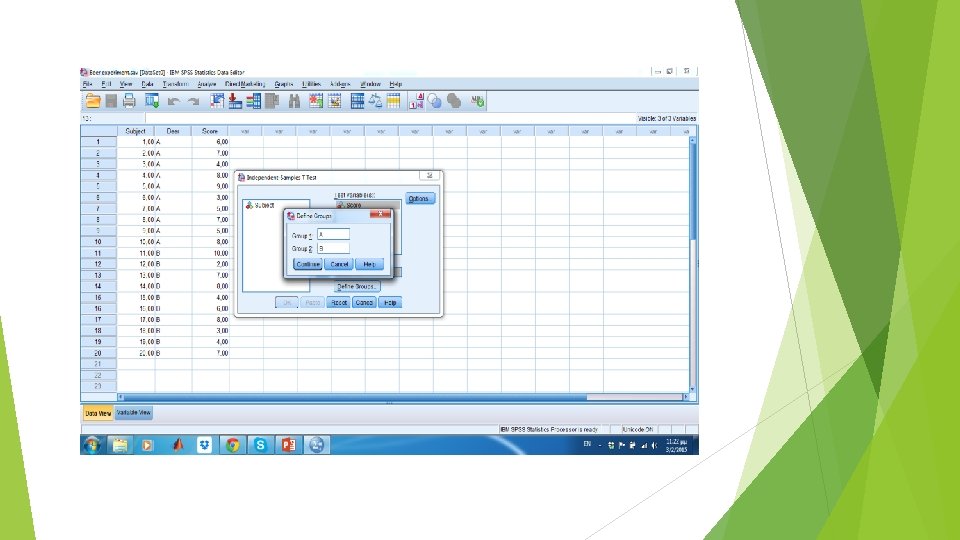
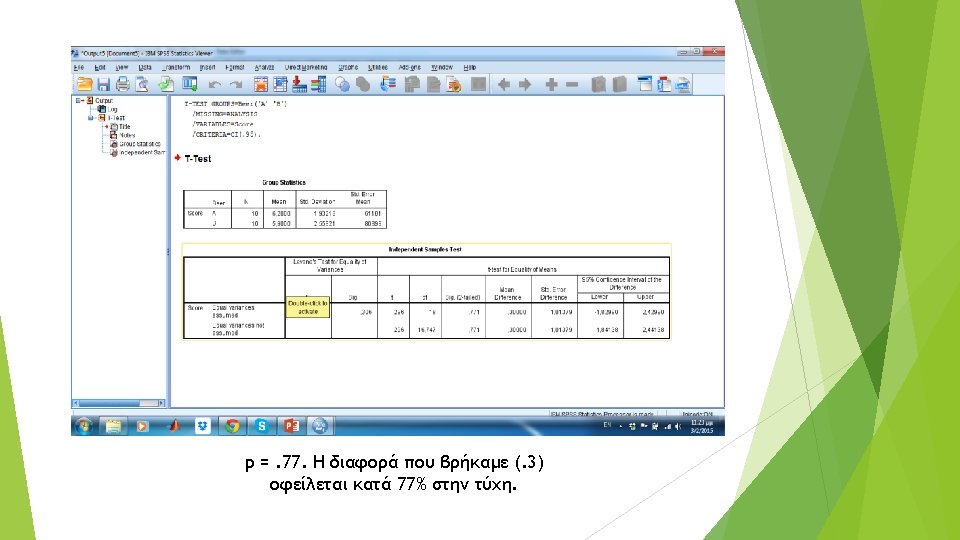
T-test Διομαδικού σχεδίου στο SPSS Ø Analyze -> Compare Means -> Independent Samples T-test
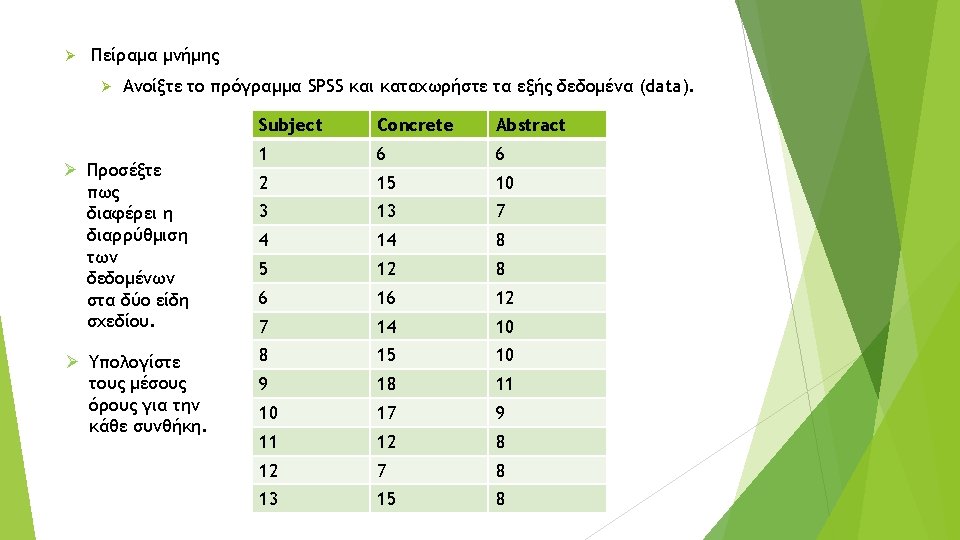
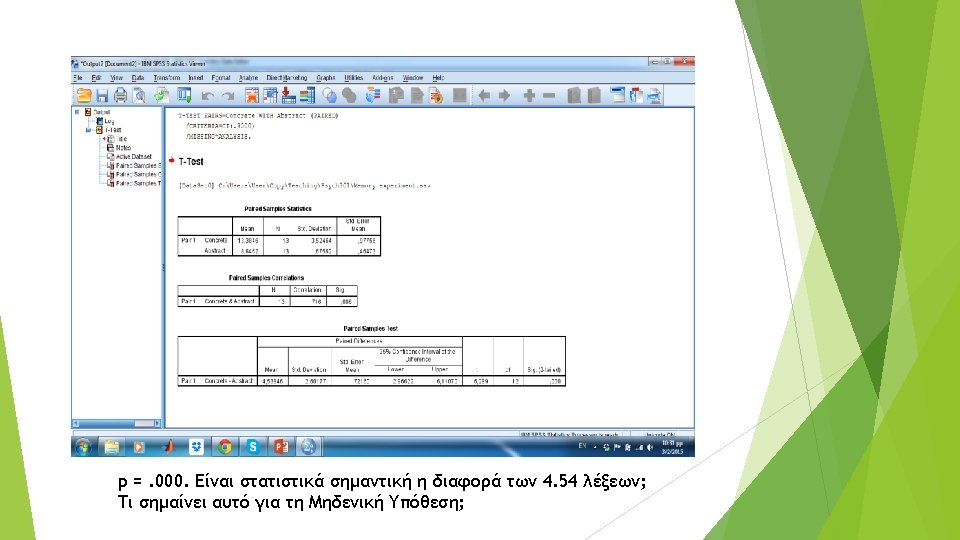
T-test ενδο-ομαδικού σχεδίου στο SPSS Ø Analyze -> Compare means -> Paired Samples T-test
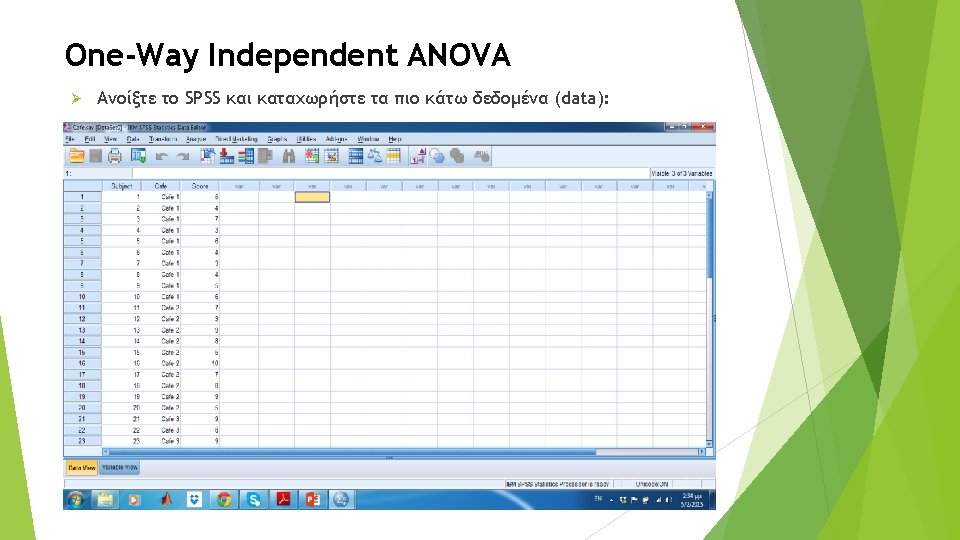
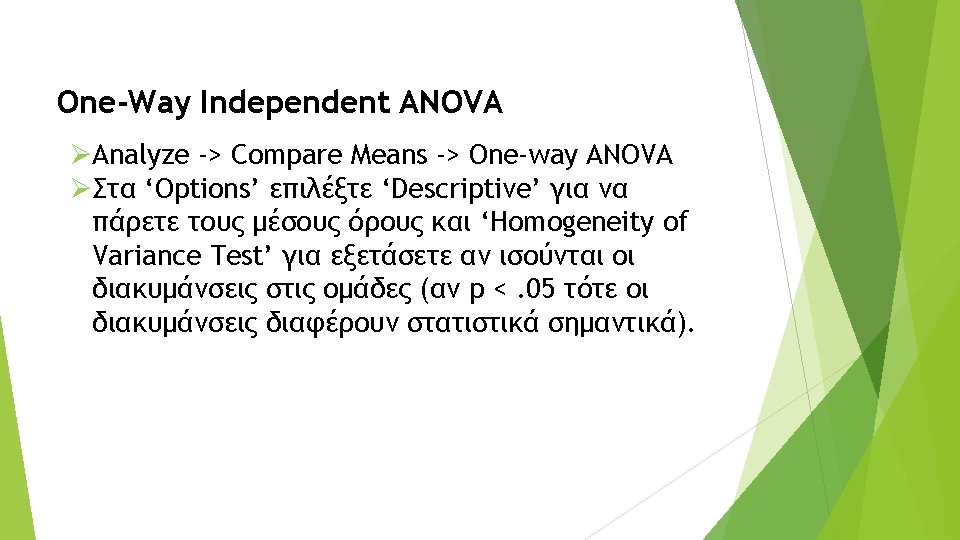
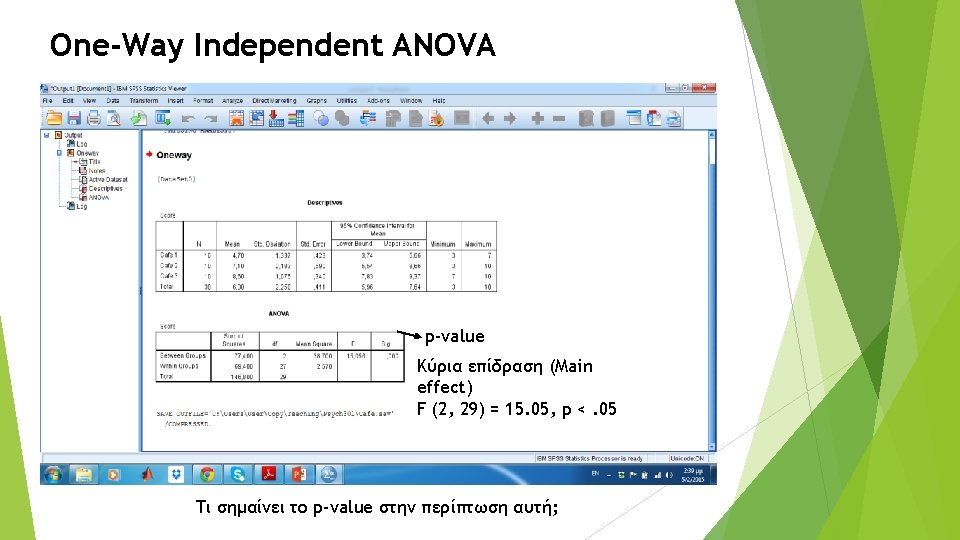
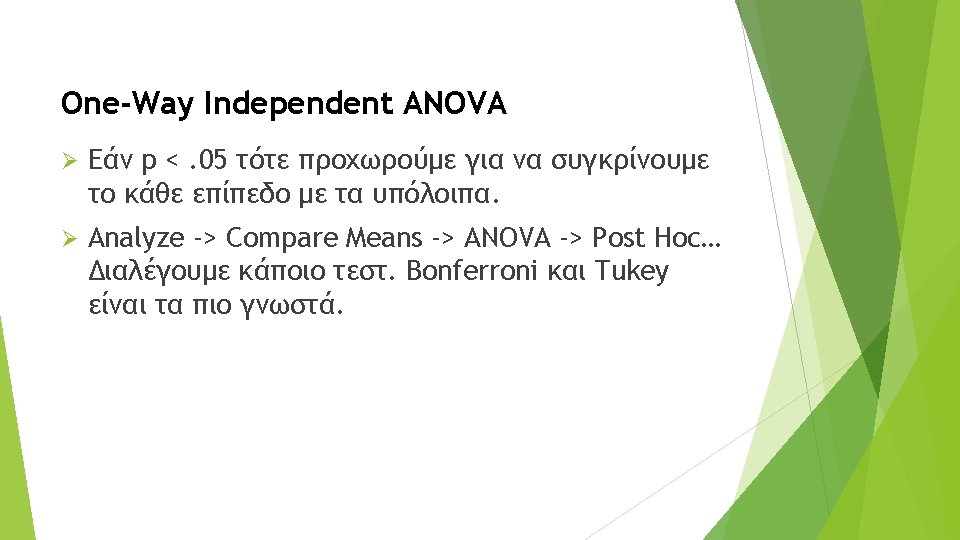
One-Way Independent ANOVA
One-Way Independent ANOVA
One-Way Repeated-Measures ANOVA Ø ANOVA για ενδο-ομαδικό σχέδιο (within-subjects design)
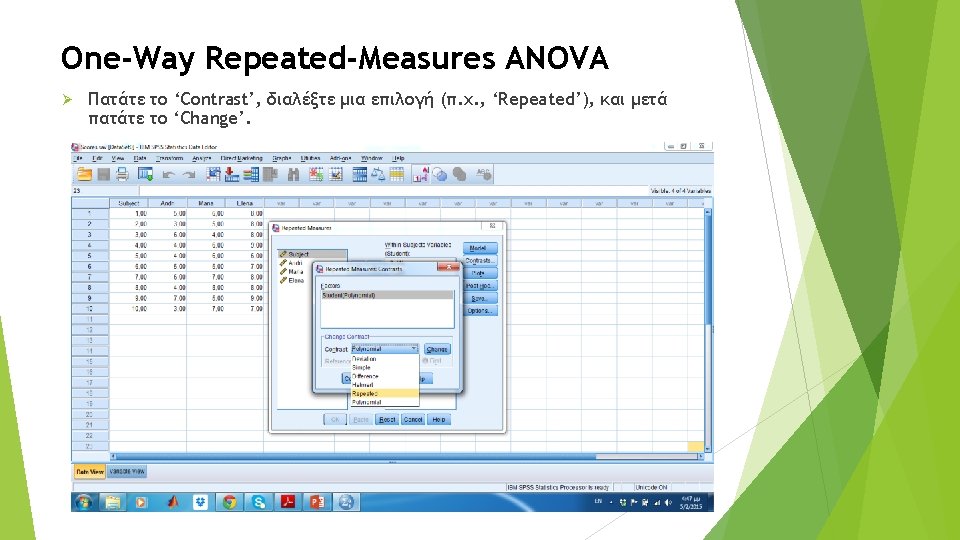
One-Way Repeated-Measures ANOVA Ø Analyze -> General Linear Model -> Repeated Measures…
One-Way Repeated-Measures ANOVA
One-Way Repeated-Measures ANOVA
One-Way Repeated-Measures ANOVA
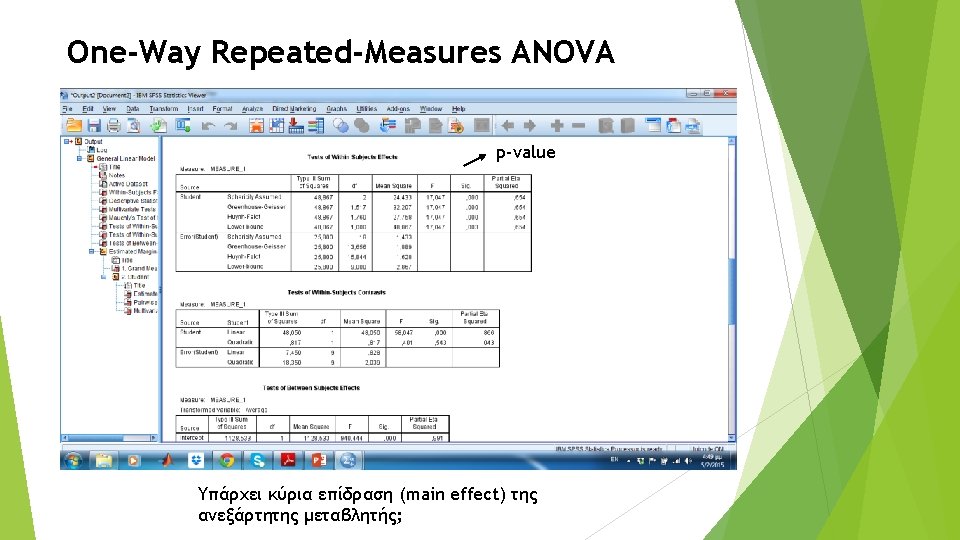
One-Way Repeated-Measures ANOVA p-value
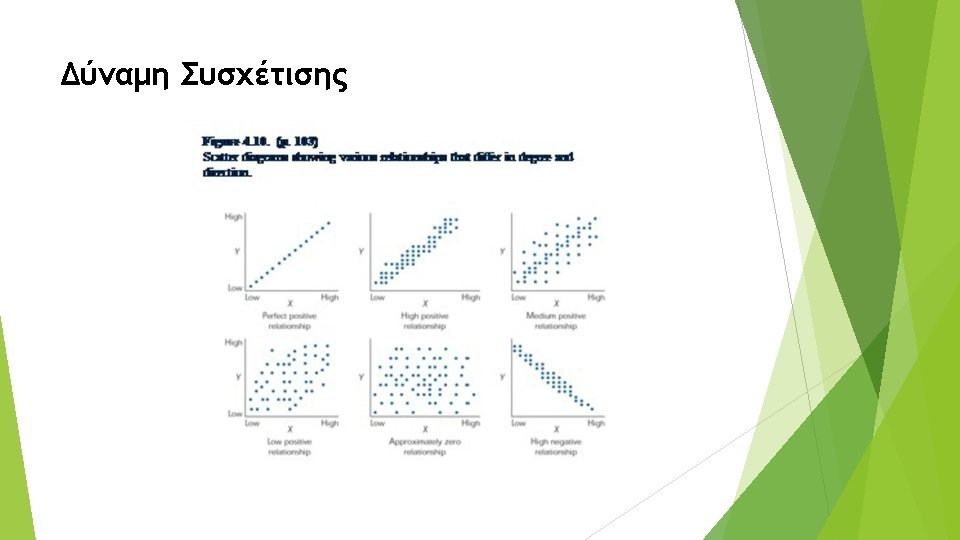
Θετική Συσχέτιση (Positive Correlation)
Negative Correlation (Αρνητική Συσχέτιση)
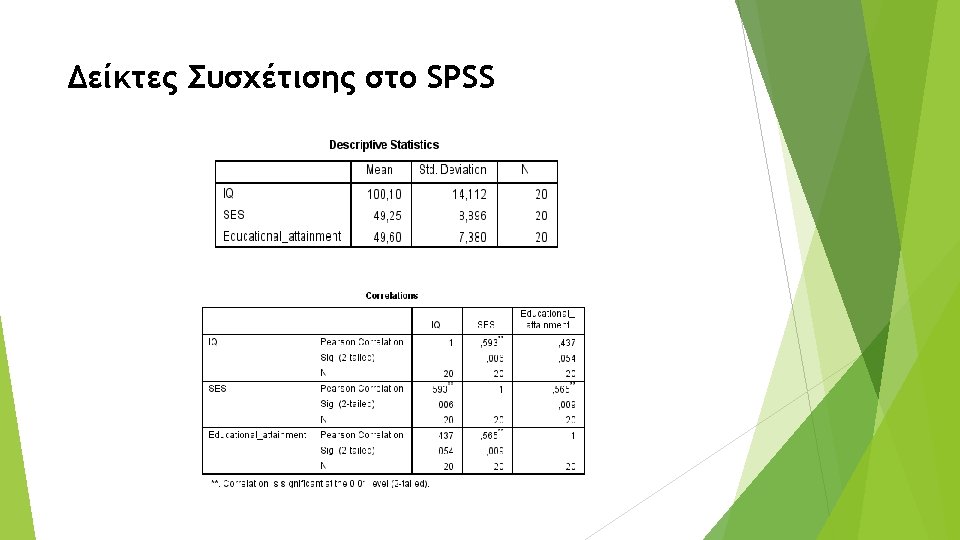
Δείκτες Συσχέτισης Ø Parametric Ø Pearson's correlation coefficient: r Ø Προϋποθέσεις του Pearson r Ø Interval data
Δείκτες Συσχέτισης στο SPSS Ø Analyze -> Correlate -> Bivariate
Δείκτες Συσχέτισης στο SPSS Ø Options -> Means and standard deviations
Scatter plot in SPSS Ø Graphs -> Legacy Dialogs -> Scatter/Dot…
Doing simple regression on SPSS Ø Analyze -> Regression -> Linear
Doing simple regression on SPSS Ø Dependent -> Outcome (sales) Ø Independent(s) -> Predictor (adverts)
Interpreting a simple regression Ø Overall fit of the model Ø R =. 578: Συσχέτιση predictor και outcome Ø R² =. 335: To Advertising Budget εξηγεί το 33, 5% της διακύμανσης των πωλήσεων (record sales) -> Το 66% της διακύμανσης;
Interpreting a simple regression Ø F-ratio Ø Significance (Sig. ) value of the F-ratio
Interpreting a simple regression Ø Model parameters Ø B 0 = 134, 140, p <. 001 Ø B 1 =. 096, p <. 001
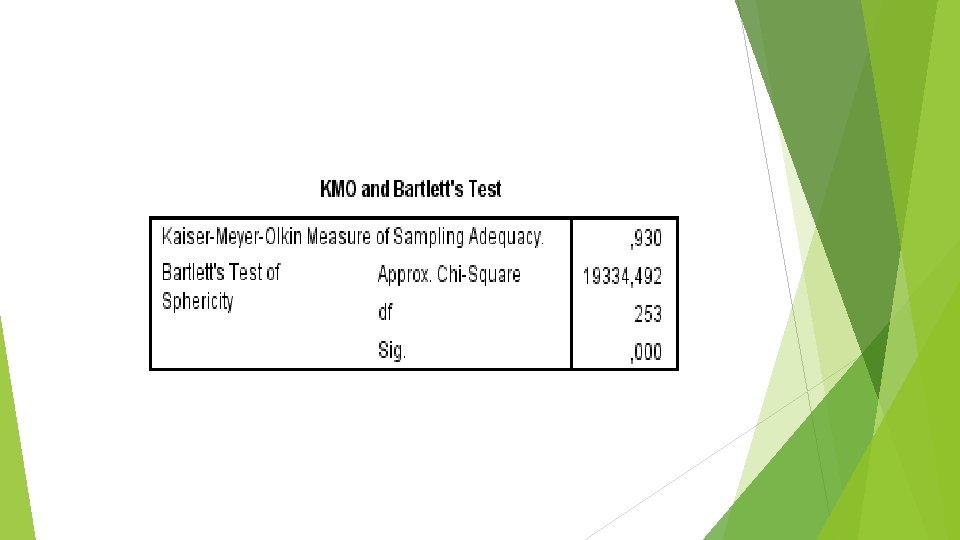
Factor analysis in SPSS Ø Analyze -> Dimension Reduction -> Factor
Factor analysis in SPSS
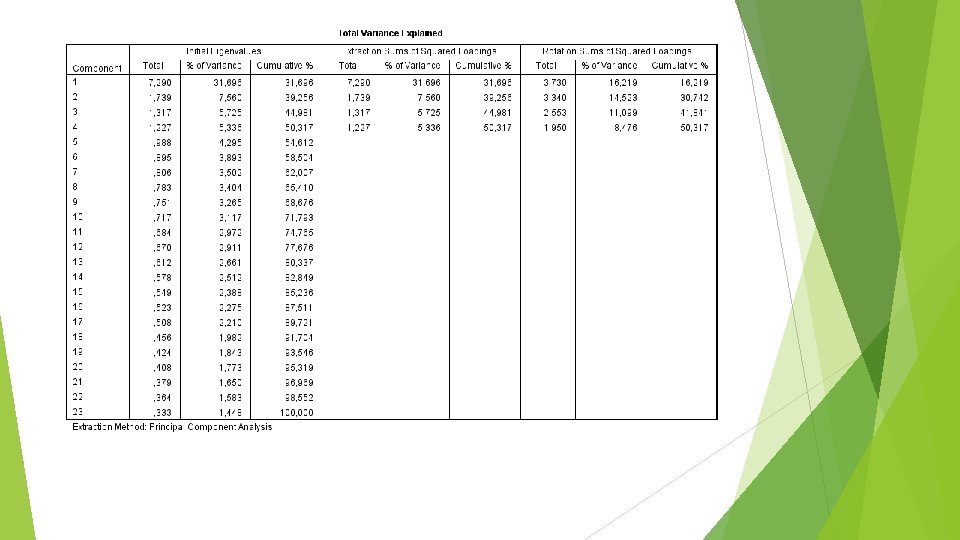
Factor analysis in SPSS
Factor analysis in SPSS
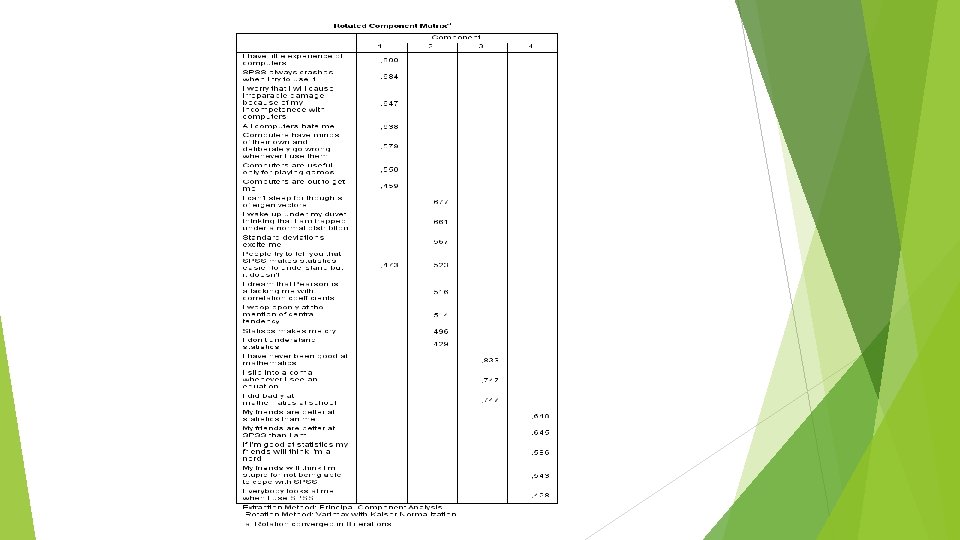
Factor analysis in SPSS
Factor analysis in SPSS
Factor analysis in SPSS