
Sponsor Based Leveraged Acquisition Market Overview Joseph V
Sponsor Based Leveraged Acquisition Market Overview Joseph V. Rizzi Amsterdam Institute of Finance December, 2013
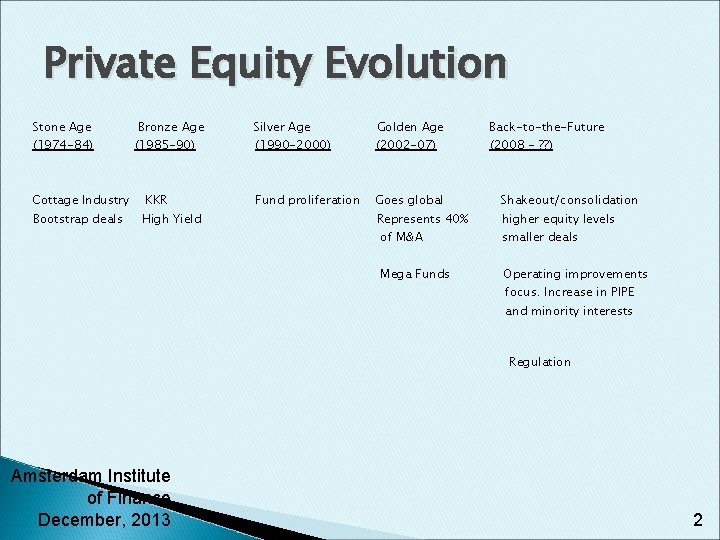
Private Equity Evolution Stone Age (1974 -84) Cottage Industry Bootstrap deals Bronze Age (1985 -90) KKR High Yield Silver Age Golden Age (1990 -2000) (2002 -07) Fund proliferation Goes global Represents 40% Back-to-the-Future (2008 - ? ? ) Shakeout/consolidation higher equity levels of M&A smaller deals Mega Funds Operating improvements focus. Increase in PIPE and minority interests Regulation Amsterdam Institute of Finance December, 2013 2
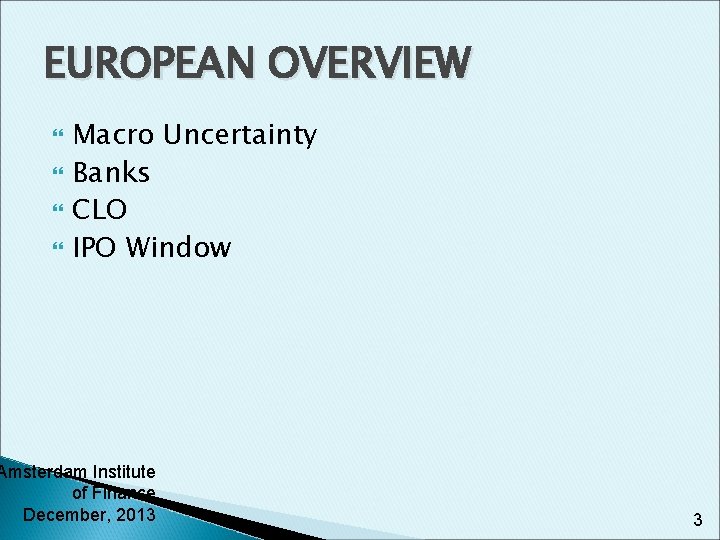
EUROPEAN OVERVIEW Macro Uncertainty Banks CLO IPO Window Amsterdam Institute of Finance December, 2013 3
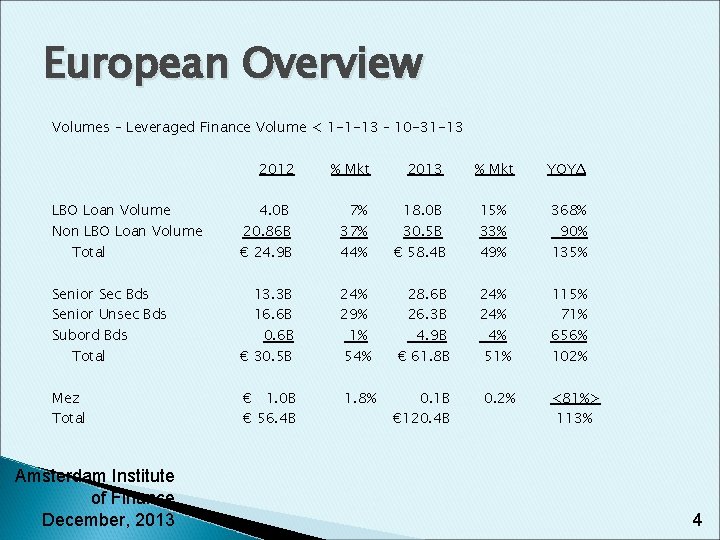
European Overview Volumes – Leveraged Finance Volume < 1 -1 -13 – 10 -31 -13 LBO Loan Volume Non LBO Loan Volume Total Senior Sec Bds Senior Unsec Bds Subord Bds Total Mez Total Amsterdam Institute of Finance December, 2013 2012 % Mkt 2013 4. 0 B 20. 86 B € 24. 9 B 7% 37% 44% 18. 0 B 30. 5 B € 58. 4 B 13. 3 B 16. 6 B 0. 6 B € 30. 5 B 24% 29% 1% 54% € 1. 0 B € 56. 4 B 1. 8% 28. 6 B 26. 3 B 4. 9 B € 61. 8 B 0. 1 B € 120. 4 B % Mkt YOYΔ 15% 33% 49% 368% 90% 135% 24% 4% 51% 115% 71% 656% 102% 0. 2% <81%> 113% 4
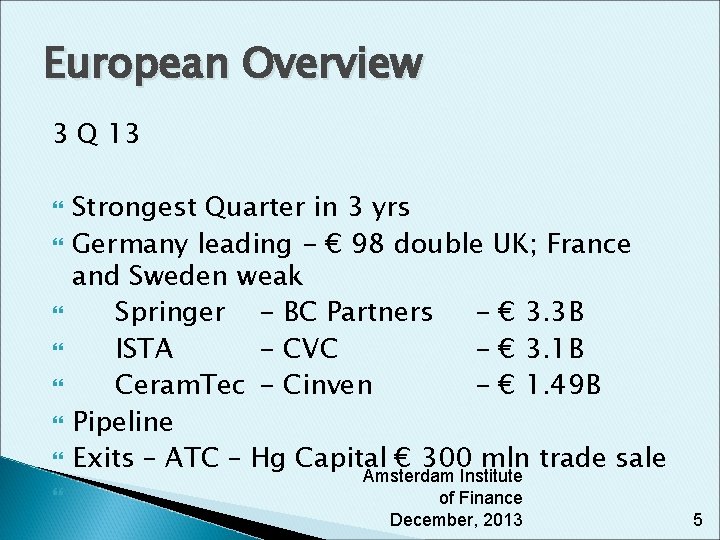
European Overview 3 Q 13 Strongest Quarter in 3 yrs Germany leading - € 98 double UK; France and Sweden weak Springer - BC Partners - € 3. 3 B ISTA - CVC - € 3. 1 B Ceram. Tec - Cinven - € 1. 49 B Pipeline Exits – ATC – Hg Capital € 300 mln trade sale Amsterdam Institute of Finance December, 2013 5
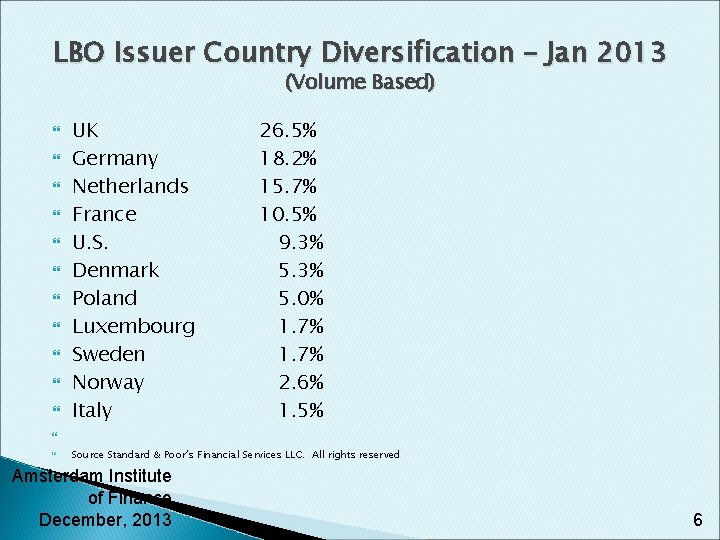
LBO Issuer Country Diversification – Jan 2013 (Volume Based) UK Germany Netherlands France U. S. Denmark Poland Luxembourg Sweden Norway Italy 26. 5% 18. 2% 15. 7% 10. 5% 9. 3% 5. 0% 1. 7% 2. 6% 1. 5% Source Standard & Poor’s Financial Services LLC. All rights reserved Amsterdam Institute of Finance December, 2013 6
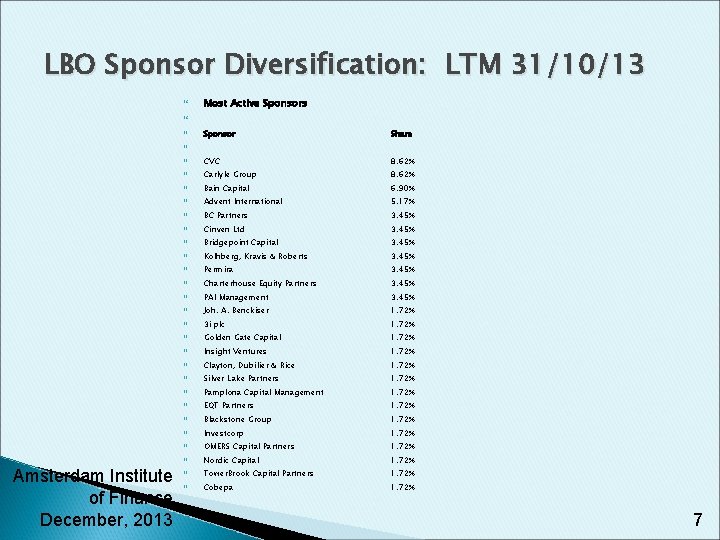
LBO Sponsor Diversification: LTM 31/10/13 Most Active Sponsors Amsterdam Institute of Finance December, 2013 Sponsor Share CVC 8. 62% Carlyle Group 8. 62% Bain Capital 6. 90% Advent International 5. 17% BC Partners 3. 45% Cinven Ltd 3. 45% Bridgepoint Capital 3. 45% Kolhberg, Kravis & Roberts 3. 45% Permira 3. 45% Charterhouse Equity Partners 3. 45% PAI Management 3. 45% Joh. A. Benckiser 1. 72% 3 i plc 1. 72% Golden Gate Capital 1. 72% Insight Ventures 1. 72% Clayton, Dubilier & Rice 1. 72% Silver Lake Partners 1. 72% Pamplona Capital Management 1. 72% EQT Partners 1. 72% Blackstone Group 1. 72% Investcorp 1. 72% OMERS Capital Partners 1. 72% Nordic Capital 1. 72% Tower. Brook Capital Partners 1. 72% Cobepa 1. 72% 7
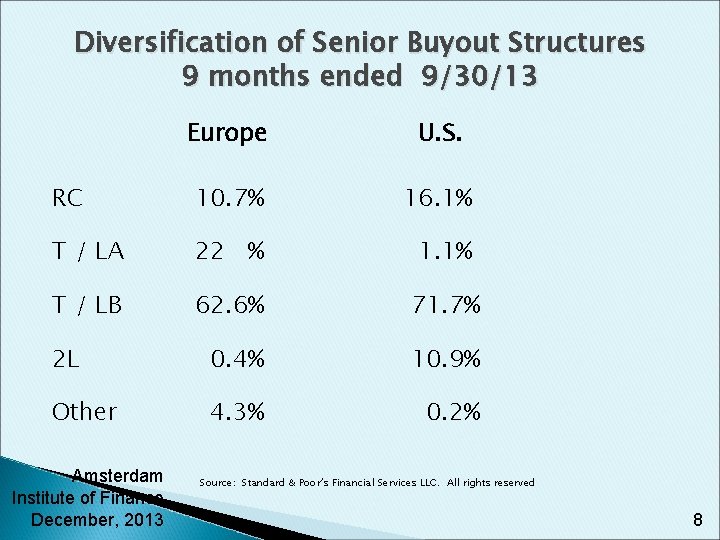
Diversification of Senior Buyout Structures 9 months ended 9/30/13 Europe U. S. RC 10. 7% 16. 1% T / LA 22 % 1. 1% T / LB 62. 6% 71. 7% 2 L 0. 4% 10. 9% Other 4. 3% 0. 2% Amsterdam Institute of Finance December, 2013 Source: Standard & Poor’s Financial Services LLC. All rights reserved 8
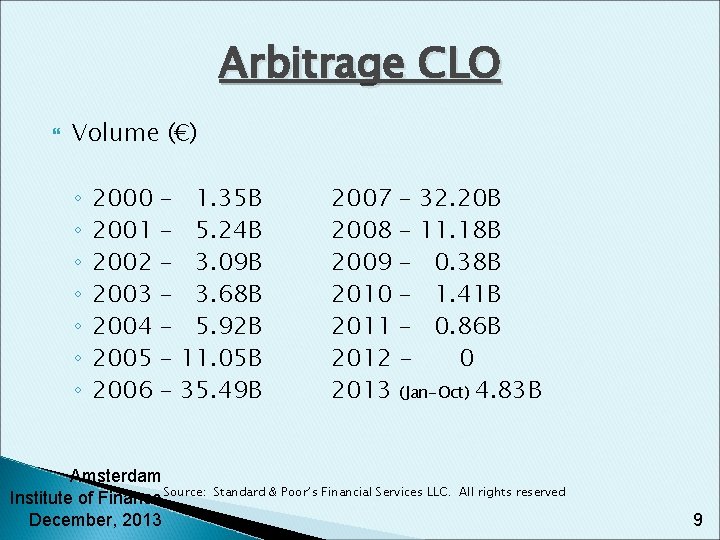
Arbitrage CLO Volume (€) ◦ ◦ ◦ ◦ 2000 2001 2002 2003 2004 2005 2006 – – – – 1. 35 B 5. 24 B 3. 09 B 3. 68 B 5. 92 B 11. 05 B 35. 49 B 2007 2008 2009 2010 2011 2012 2013 – 32. 20 B – 11. 18 B – 0. 38 B – 1. 41 B – 0. 86 B 0 (Jan-Oct) 4. 83 B Amsterdam Institute of Finance Source: December, 2013 Standard & Poor’s Financial Services LLC. All rights reserved 9
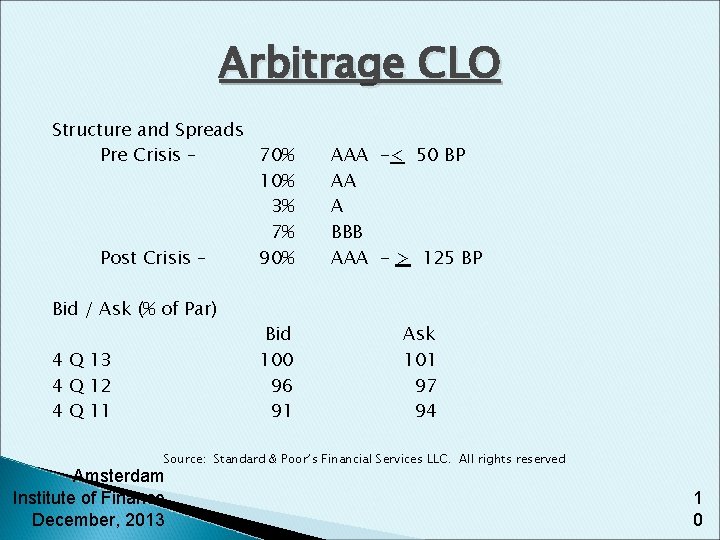
Arbitrage CLO Structure and Spreads Pre Crisis – 70% 10% 3% 7% Post Crisis – 90% Bid / Ask (% of Par) 4 Q 13 4 Q 12 4 Q 11 Bid 100 96 91 AAA -< 50 BP AA A BBB AAA - > 125 BP Ask 101 97 94 Source: Standard & Poor’s Financial Services LLC. All rights reserved Amsterdam Institute of Finance December, 2013 1 0
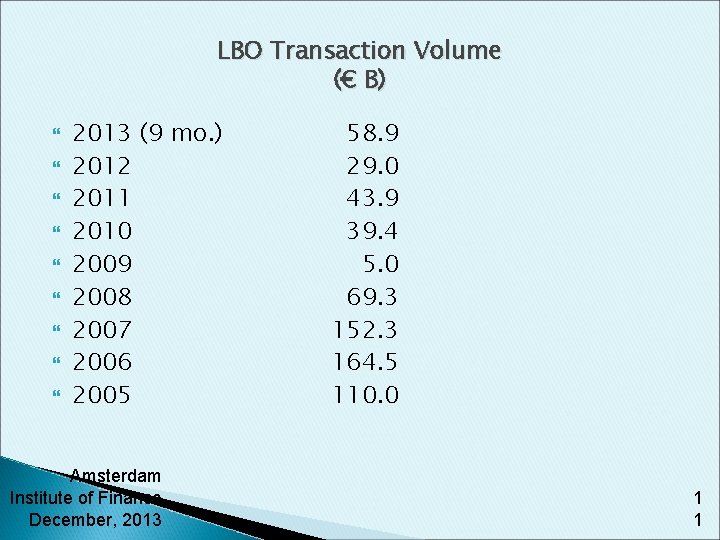
LBO Transaction Volume (€ B) 2013 (9 mo. ) 2012 2011 2010 2009 2008 2007 2006 2005 Amsterdam Institute of Finance December, 2013 58. 9 29. 0 43. 9 39. 4 5. 0 69. 3 152. 3 164. 5 110. 0 1 1
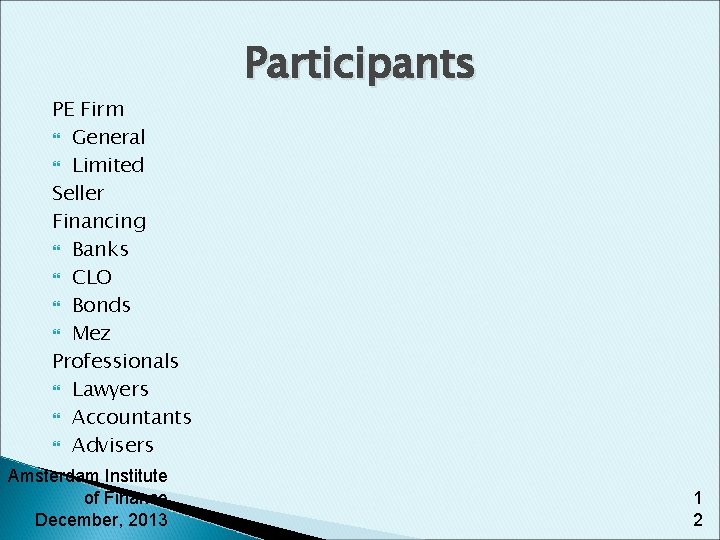
PE Firm General Limited Seller Financing Banks CLO Bonds Mez Professionals Lawyers Accountants Advisers Amsterdam Institute of Finance December, 2013 Participants 1 2
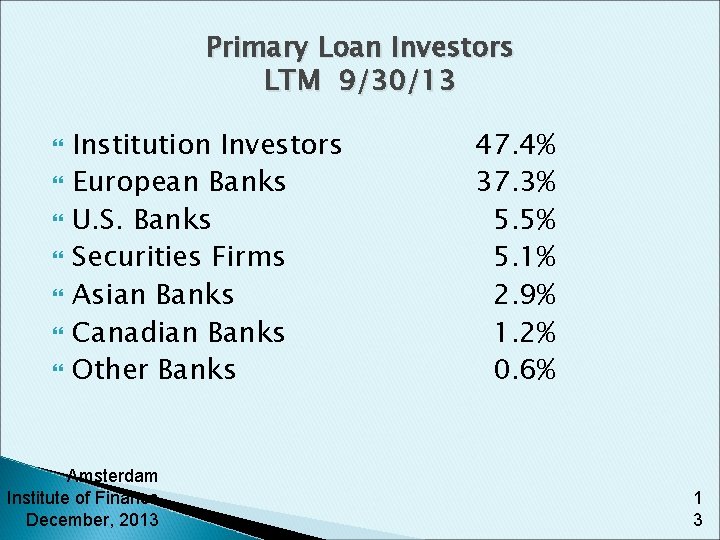
Primary Loan Investors LTM 9/30/13 Institution Investors European Banks U. S. Banks Securities Firms Asian Banks Canadian Banks Other Banks Amsterdam Institute of Finance December, 2013 47. 4% 37. 3% 5. 5% 5. 1% 2. 9% 1. 2% 0. 6% 1 3
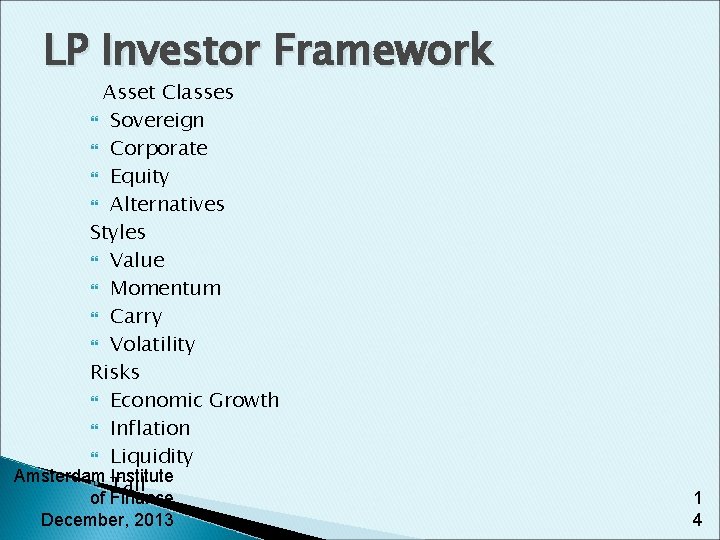
LP Investor Framework Asset Classes Sovereign Corporate Equity Alternatives Styles Value Momentum Carry Volatility Risks Economic Growth Inflation Liquidity Amsterdam Institute Tail of Finance December, 2013 1 4
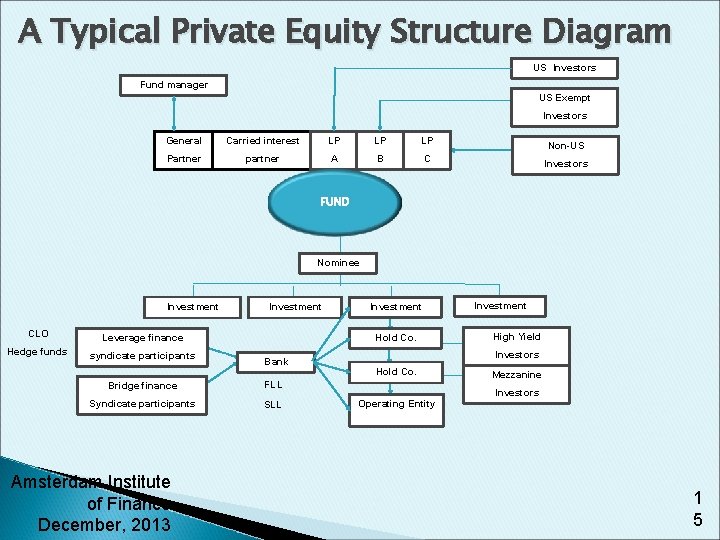
A Typical Private Equity Structure Diagram US Investors Fund manager US Exempt Investors General Carried interest LP LP LP Non-US Partner partner A B C Investors FUND Nominee Investment CLO Leverage finance Hedge funds syndicate participants Investment Hold Co. Bank Bridge finance FLL Syndicate participants SLL Amsterdam Institute of Finance December, 2013 Investment High Yield Investors Hold Co. Operating Entity Mezzanine Investors 1 5
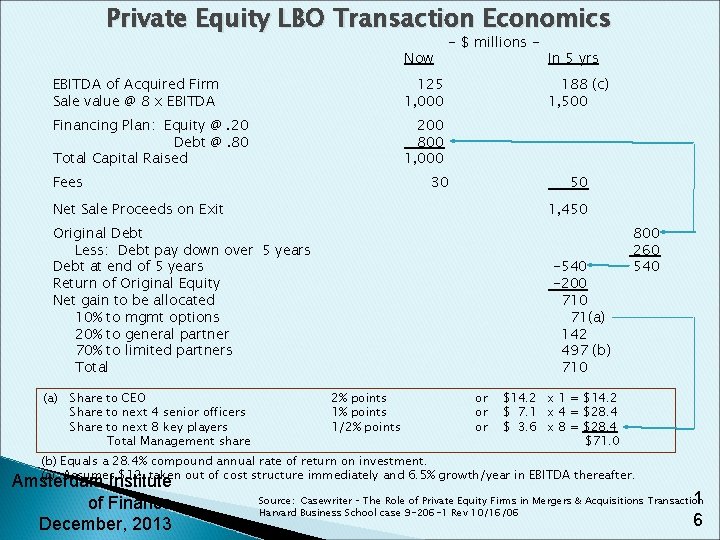
Private Equity LBO Transaction Economics Now EBITDA of Acquired Firm Sale value @ 8 x EBITDA 125 1, 000 Financing Plan: Equity @. 20 Debt @. 80 Total Capital Raised 200 800 1, 000 Fees - $ millions - 188 (c) 1, 500 30 50 Net Sale Proceeds on Exit 1, 450 Original Debt Less: Debt pay down over 5 years Debt at end of 5 years Return of Original Equity Net gain to be allocated 10% to mgmt options 20% to general partner 70% to limited partners Total (a) Share to CEO Share to next 4 senior officers Share to next 8 key players Total Management share In 5 yrs -540 -200 71(a) 142 497 (b) 710 2% points 1/2% points or or or 800 260 540 $14. 2 x 1 = $14. 2 $ 7. 1 x 4 = $28. 4 $ 3. 6 x 8 = $28. 4 $71. 0 (b) Equals a 28. 4% compound annual rate of return on investment. (c) Assumes $12 taken out of cost structure immediately and 6. 5% growth/year in EBITDA thereafter. Amsterdam Institute of Finance December, 2013 1 6 Source: Casewriter – The Role of Private Equity Firms in Mergers & Acquisitions Transaction Harvard Business School case 9 -206 -1 Rev 10/16/06
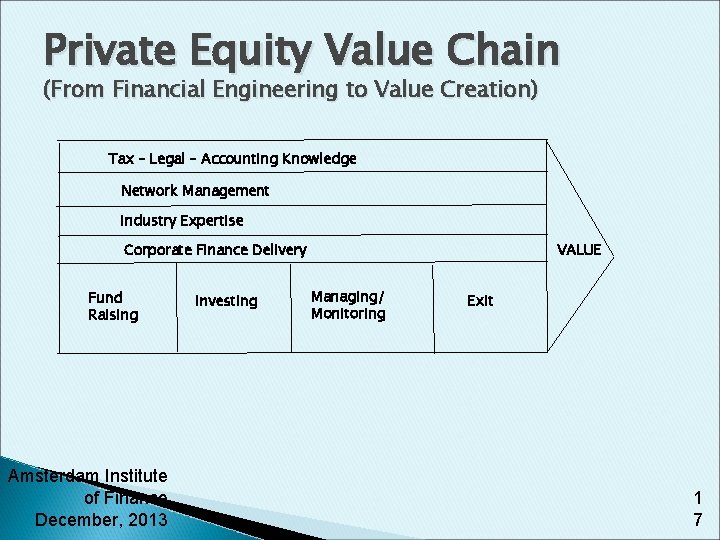
Private Equity Value Chain (From Financial Engineering to Value Creation) Tax – Legal – Accounting Knowledge Network Management Industry Expertise Corporate Finance Delivery Fund Raising Amsterdam Institute of Finance December, 2013 Investing VALUE Managing/ Monitoring Exit 1 7
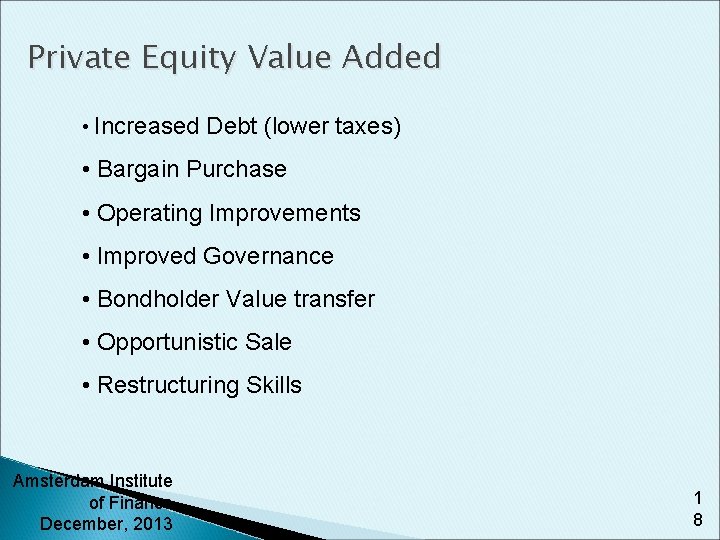
Private Equity Value Added • Increased Debt (lower taxes) • Bargain Purchase • Operating Improvements • Improved Governance • Bondholder Value transfer • Opportunistic Sale • Restructuring Skills Amsterdam Institute of Finance December, 2013 1 8
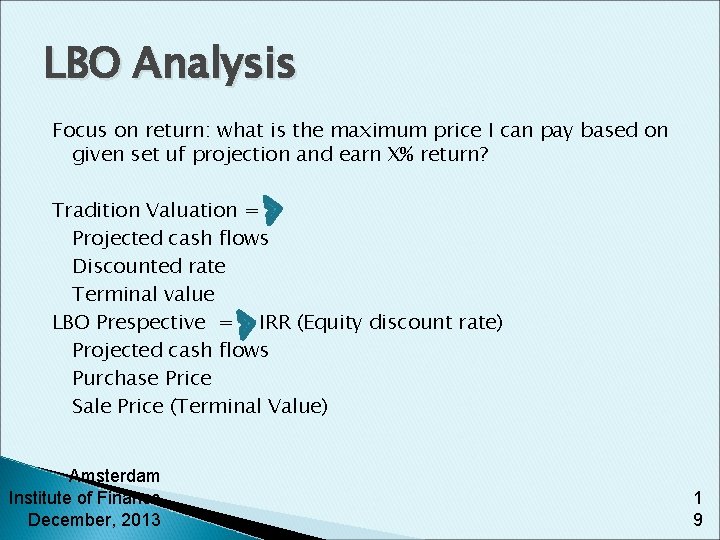
LBO Analysis Focus on return: what is the maximum price I can pay based on given set uf projection and earn X% return? Tradition Valuation = Projected cash flows Discounted rate Terminal value LBO Prespective = IRR (Equity discount rate) Projected cash flows Purchase Price Sale Price (Terminal Value) Amsterdam Institute of Finance December, 2013 1 9
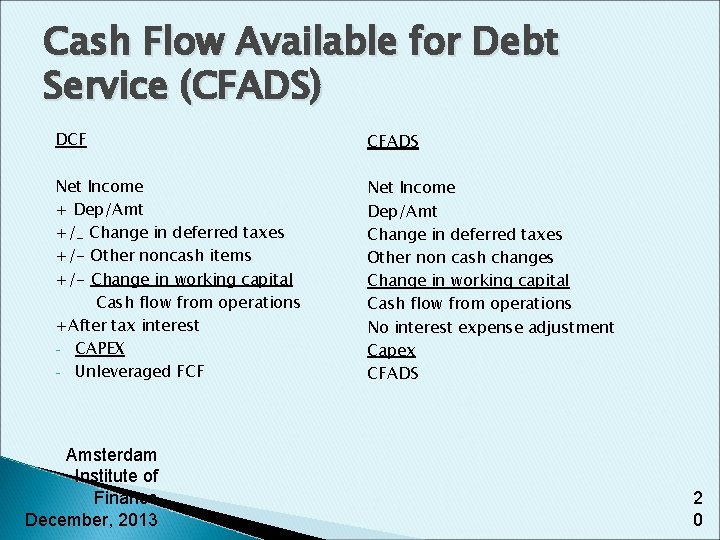
Cash Flow Available for Debt Service (CFADS) DCF CFADS Net Income + Dep/Amt +/_ Change in deferred taxes +/- Other noncash items +/- Change in working capital Cash flow from operations +After tax interest - CAPEX - Unleveraged FCF Net Income Dep/Amt Change in deferred taxes Other non cash changes Change in working capital Cash flow from operations No interest expense adjustment Capex CFADS Amsterdam Institute of Finance December, 2013 2 0
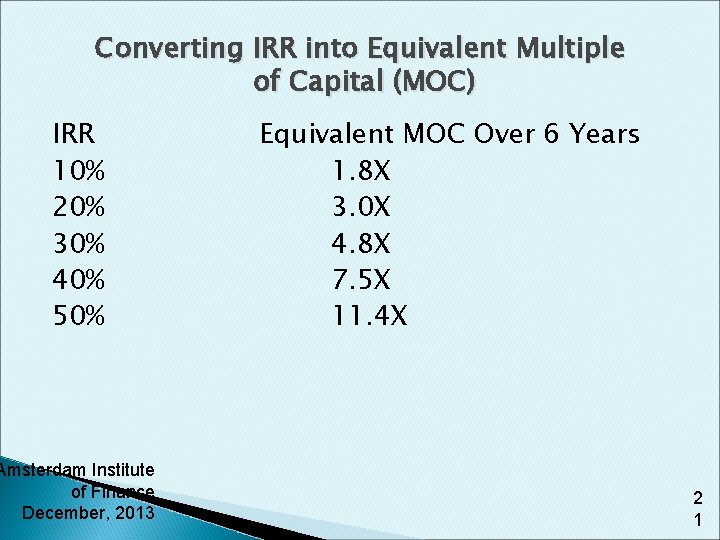
Converting IRR into Equivalent Multiple of Capital (MOC) IRR 10% 20% 30% 40% 50% Amsterdam Institute of Finance December, 2013 Equivalent MOC Over 6 Years 1. 8 X 3. 0 X 4. 8 X 7. 5 X 11. 4 X 2 1
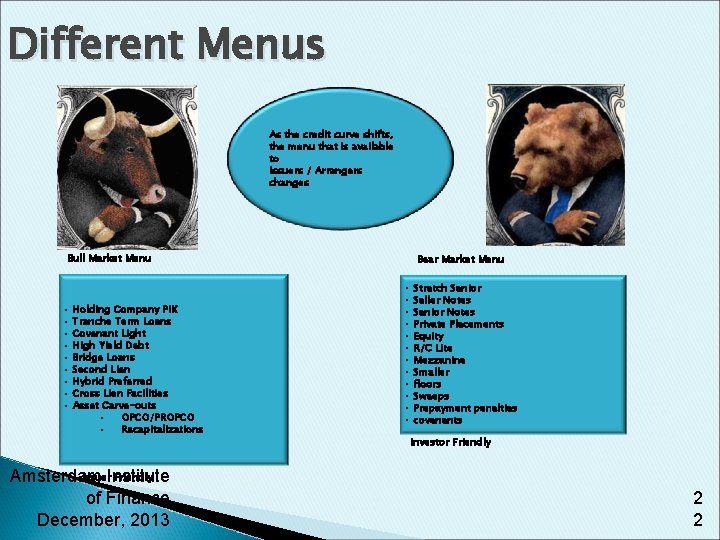
Different Menus As the credit curve shifts, the menu that is available to Issuers / Arrangers changes Bull Market Menu • Holding Company PIK • Tranche Term Loans • Covenant Light • High Yield Debt • Bridge Loans • Second Lien • Hybrid Preferred • Cross Lien Facilities • Asset Carve-outs • OPCO/PROPCO • Recapitalizations Issuer. Institute Friendly Amsterdam of Finance December, 2013 Bear Market Menu • Stretch Senior • Seller Notes • Senior Notes • Private Placements • Equity • R/C Lite • Mezzanine • Smaller • floors • Sweeps • Prepayment penalties • covenants Investor Friendly 2 2
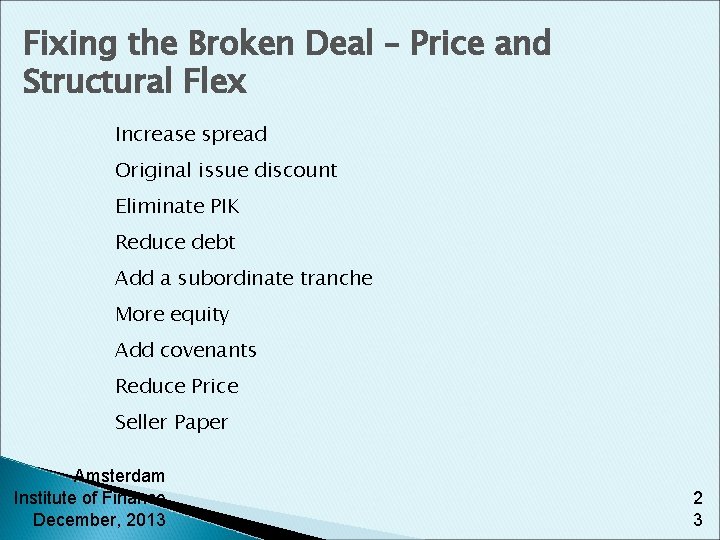
Fixing the Broken Deal – Price and Structural Flex Increase spread Original issue discount Eliminate PIK Reduce debt Add a subordinate tranche More equity Add covenants Reduce Price Seller Paper Amsterdam Institute of Finance December, 2013 2 3
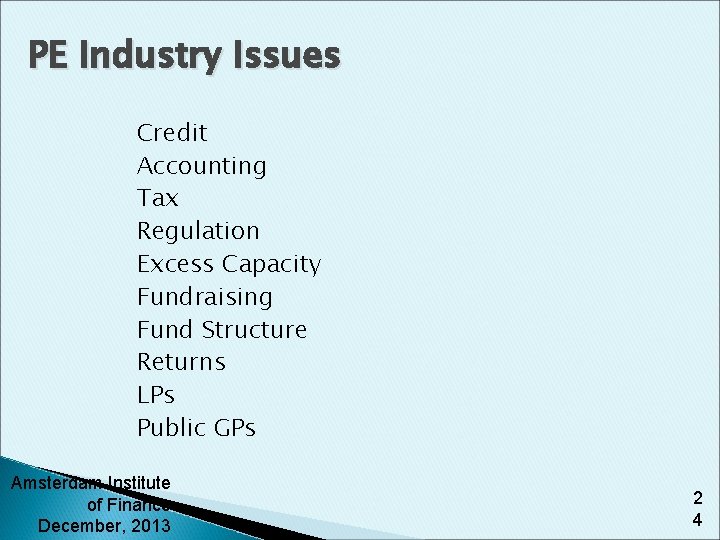
PE Industry Issues Credit Accounting Tax Regulation Excess Capacity Fundraising Fund Structure Returns LPs Public GPs Amsterdam Institute of Finance December, 2013 2 4
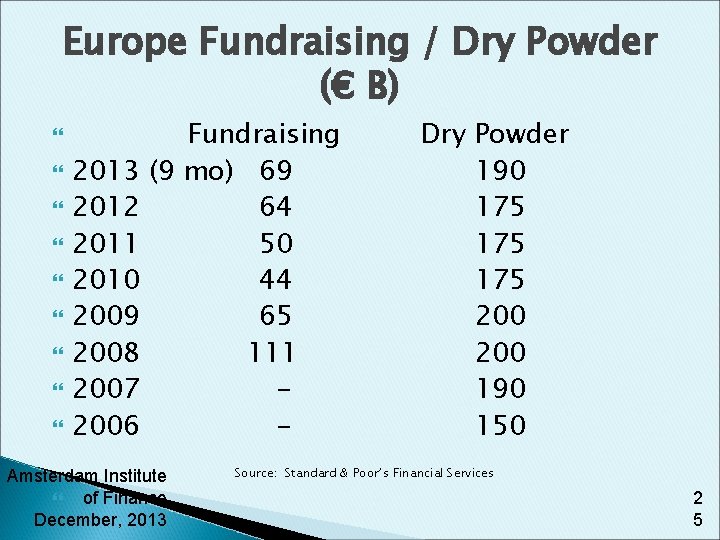
Europe Fundraising / Dry Powder (€ B) Fundraising 2013 (9 mo) 69 2012 64 2011 50 2010 44 2009 65 2008 111 2007 2006 - Amsterdam Institute of Finance December, 2013 Dry Powder 190 175 175 200 190 150 Source: Standard & Poor’s Financial Services 2 5
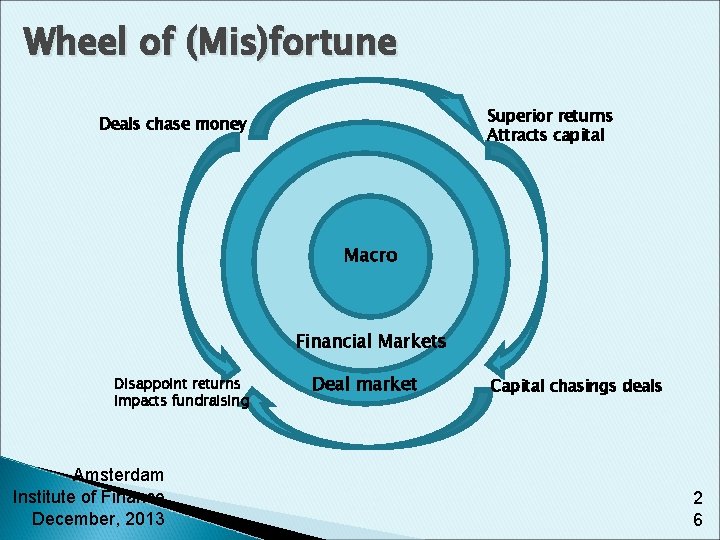
Wheel of (Mis)fortune Superior returns Attracts capital Deals chase money Macro Financial Markets Disappoint returns Impacts fundraising Amsterdam Institute of Finance December, 2013 Deal market Capital chasings deals 2 6
- Slides: 26