
Speed Values AEC Performance Evaluation and Quality Control




- Slides: 56
Speed Values, AEC Performance Evaluation and Quality Control with Digital Receptors
Absolute Standards: Film/Screen • For any given film/screen/processing system: – an absolute optimum exposure level exists – It is the exposure yielding optimum density levels – Optimum is also “correct” exposure if components are compatible and in good working order • Acceptance limits develop around ideal level – Overexposed films judged too dark-repeated – Underexposed films judged too light-repeated • Optimum level and acceptance limits may vary according to preferences
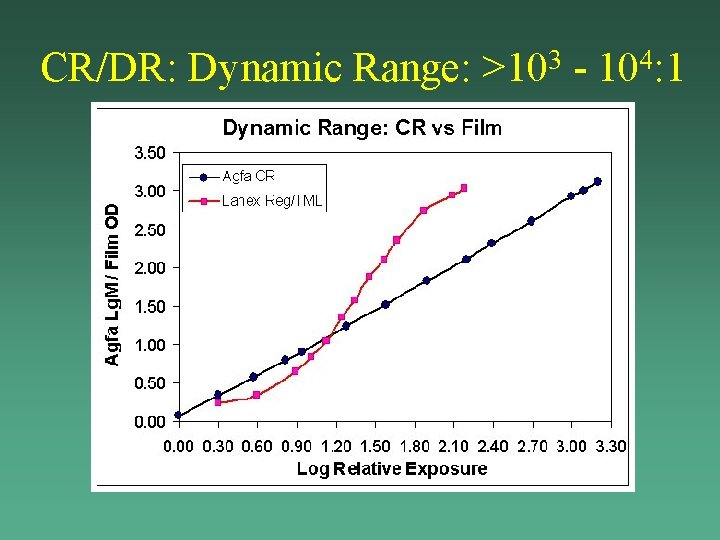
CR/DR: Dynamic Range: >103 - 104: 1
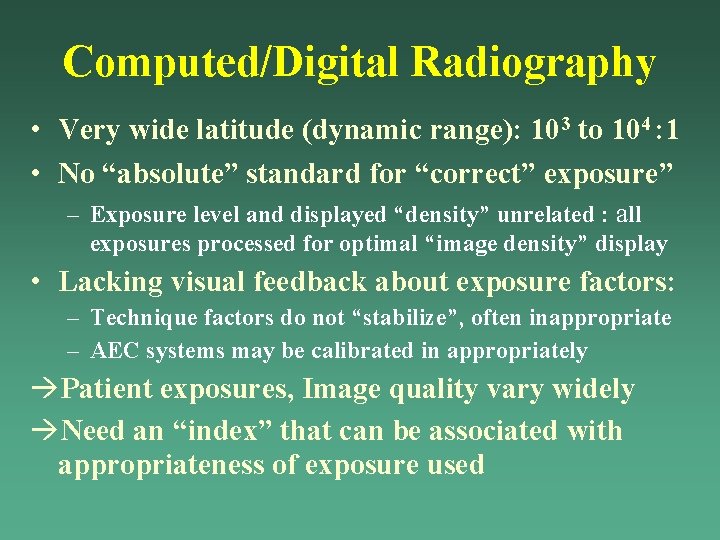
Computed/Digital Radiography • Very wide latitude (dynamic range): 103 to 104 : 1 • No “absolute” standard for “correct” exposure” – Exposure level and displayed “density” unrelated : all exposures processed for optimal “image density” display • Lacking visual feedback about exposure factors: – Technique factors do not “stabilize”, often inappropriate – AEC systems may be calibrated in appropriately Patient exposures, Image quality vary widely Need an “index” that can be associated with appropriateness of exposure used
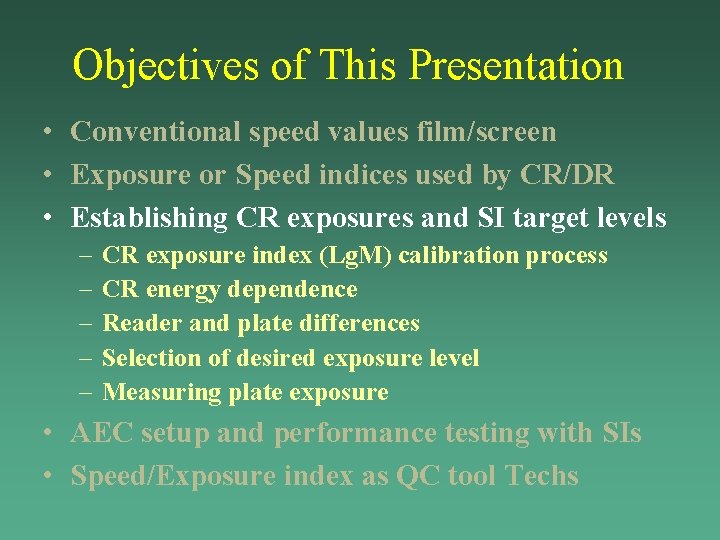
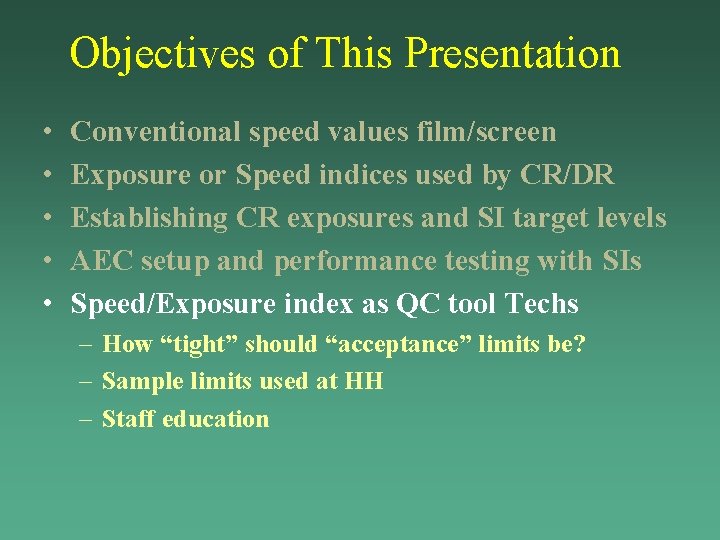
Objectives of This Presentation • • • Conventional speed values film/screen Exposure or Speed indices used by CR/DR Establishing CR exposures and SI target levels AEC setup and performance testing with SIs Speed/Exposure index as QC tool Techs
Objectives of This Presentation • Conventional speed values film/screen – Definition of Speed: Direct Expose film – Relative speed convention for film/screen systems – Film/screen speed classes • • Exposure or Speed indices used by CR/DR Establishing CR exposures and SI target levels AEC setup and performance testing with SIs Speed/Exposure index as QC tool Techs
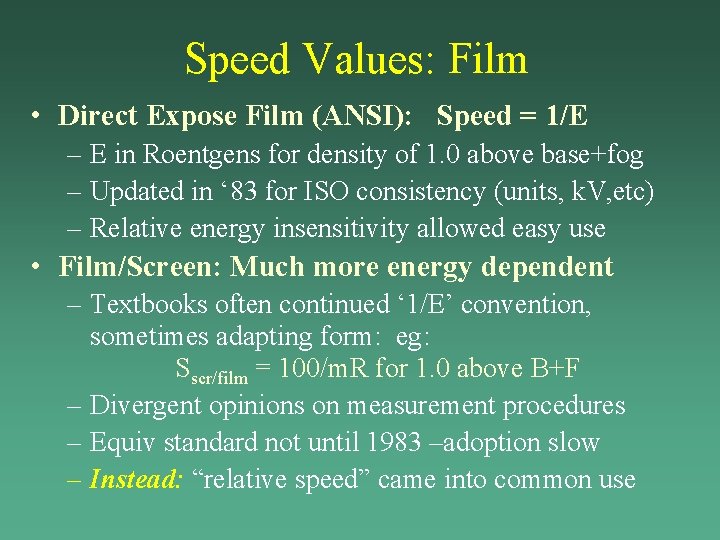
Speed Values: Film • Direct Expose Film (ANSI): Speed = 1/E – E in Roentgens for density of 1. 0 above base+fog – Updated in ‘ 83 for ISO consistency (units, k. V, etc) – Relative energy insensitivity allowed easy use • Film/Screen: Much more energy dependent – Textbooks often continued ‘ 1/E’ convention, sometimes adapting form: eg: Sscr/film = 100/m. R for 1. 0 above B+F – Divergent opinions on measurement procedures – Equiv standard not until 1983 –adoption slow – Instead: “relative speed” came into common use
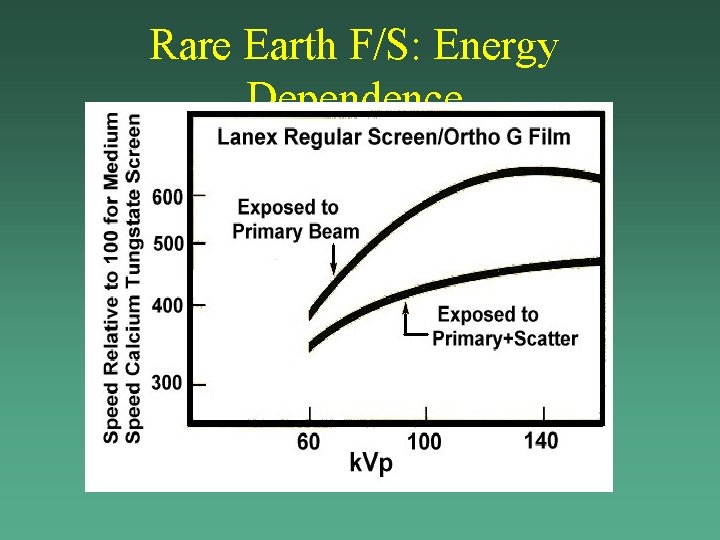
Rare Earth F/S: Energy Dependence
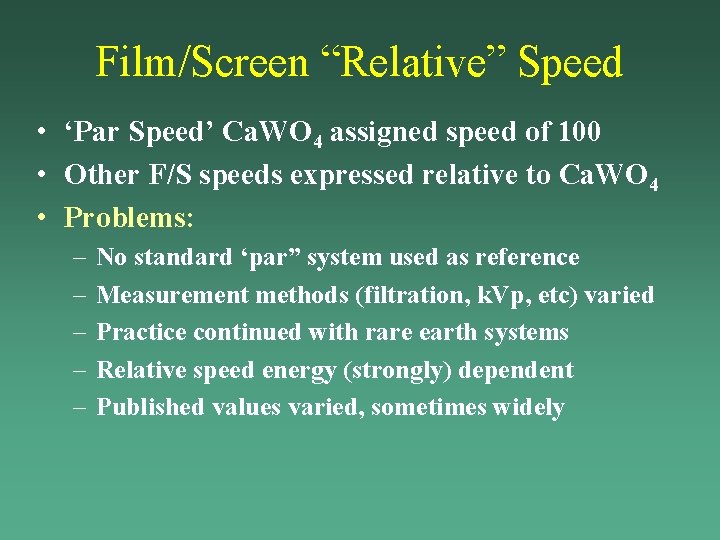
Film/Screen “Relative” Speed • ‘Par Speed’ Ca. WO 4 assigned speed of 100 • Other F/S speeds expressed relative to Ca. WO 4 • Problems: – – – No standard ‘par” system used as reference Measurement methods (filtration, k. Vp, etc) varied Practice continued with rare earth systems Relative speed energy (strongly) dependent Published values varied, sometimes widely
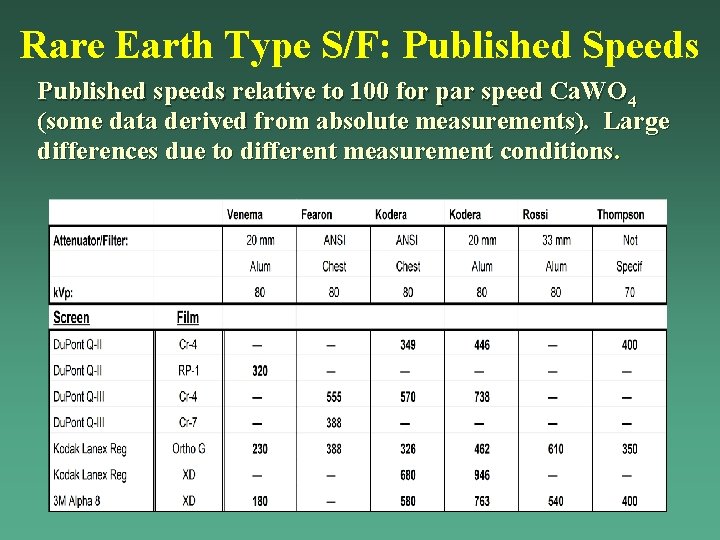
Rare Earth Type S/F: Published Speeds Published speeds relative to 100 for par speed Ca. WO 4 (some data derived from absolute measurements). Large differences due to different measurement conditions.
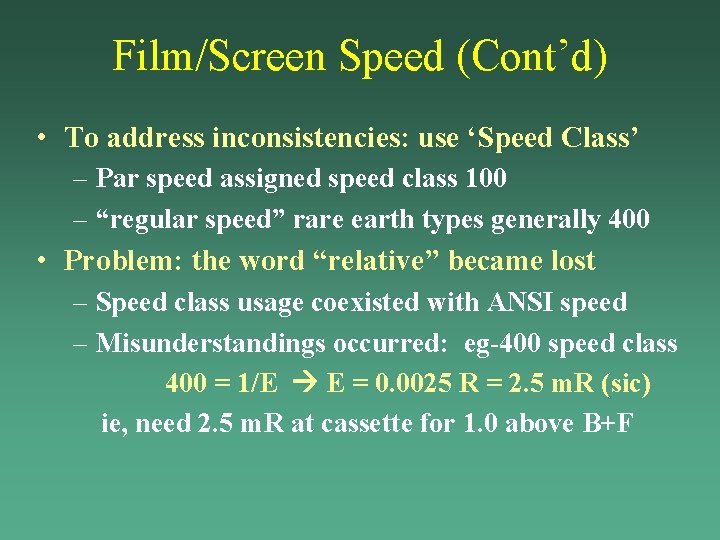
Film/Screen Speed (Cont’d) • To address inconsistencies: use ‘Speed Class’ – Par speed assigned speed class 100 – “regular speed” rare earth types generally 400 • Problem: the word “relative” became lost – Speed class usage coexisted with ANSI speed – Misunderstandings occurred: eg-400 speed class 400 = 1/E E = 0. 0025 R = 2. 5 m. R (sic) ie, need 2. 5 m. R at cassette for 1. 0 above B+F
Objectives of This Presentation • • • Conventional speed values film/screen Exposure or Speed indices used by CR/DR Establishing CR exposures and SI target levels AEC setup and performance testing with SIs Speed/Exposure index as QC tool Techs
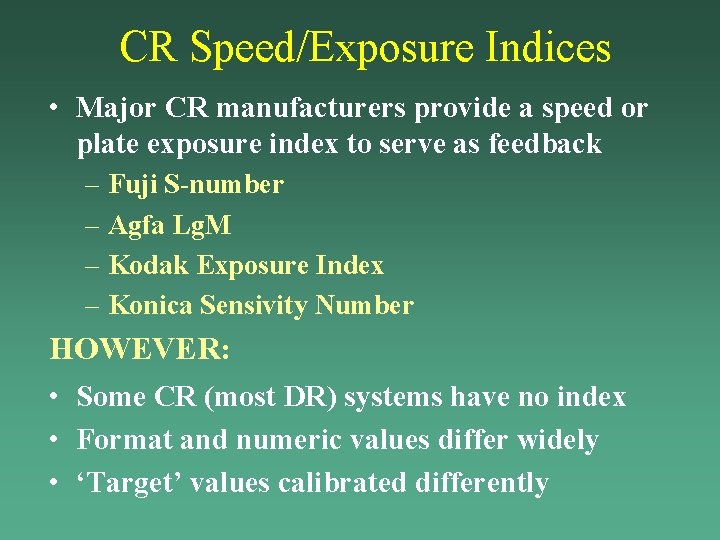
CR Speed/Exposure Indices • Major CR manufacturers provide a speed or plate exposure index to serve as feedback – Fuji S-number – Agfa Lg. M – Kodak Exposure Index – Konica Sensivity Number HOWEVER: • Some CR (most DR) systems have no index • Format and numeric values differ widely • ‘Target’ values calibrated differently
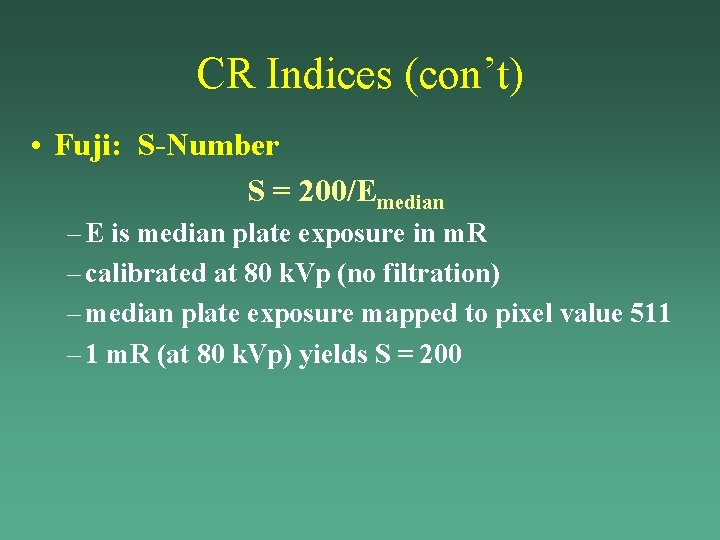
CR Indices (con’t) • Fuji: S-Number S = 200/Emedian – E is median plate exposure in m. R – calibrated at 80 k. Vp (no filtration) – median plate exposure mapped to pixel value 511 – 1 m. R (at 80 k. Vp) yields S = 200
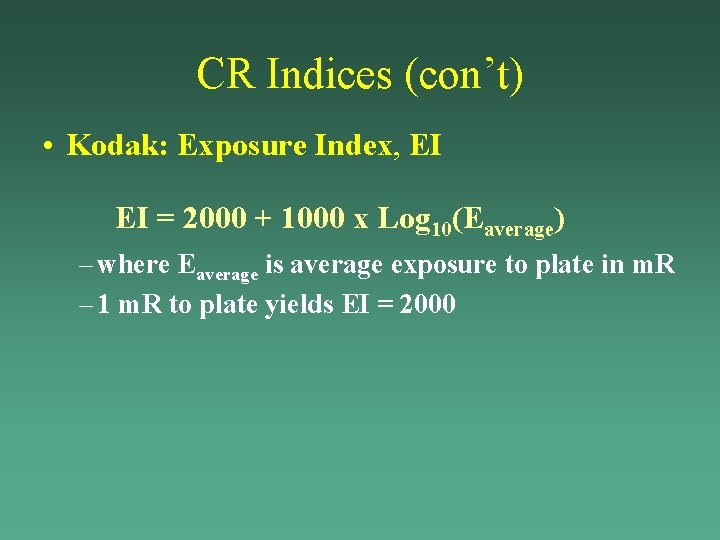
CR Indices (con’t) • Kodak: Exposure Index, EI EI = 2000 + 1000 x Log 10(Eaverage) – where Eaverage is average exposure to plate in m. R – 1 m. R to plate yields EI = 2000
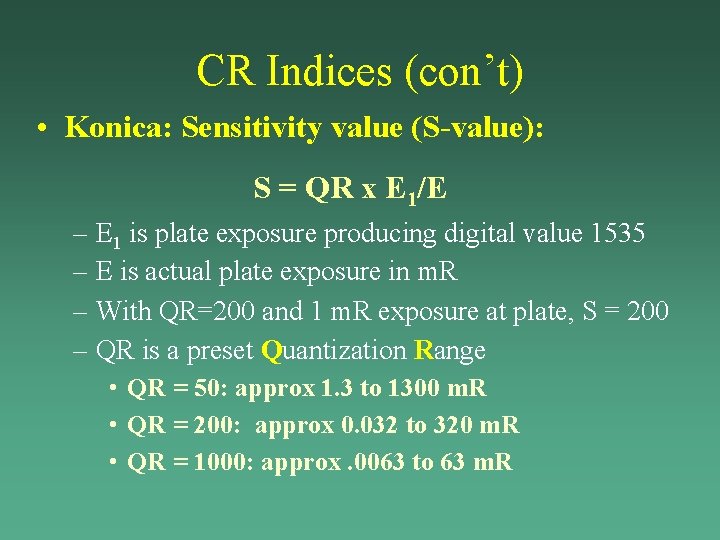
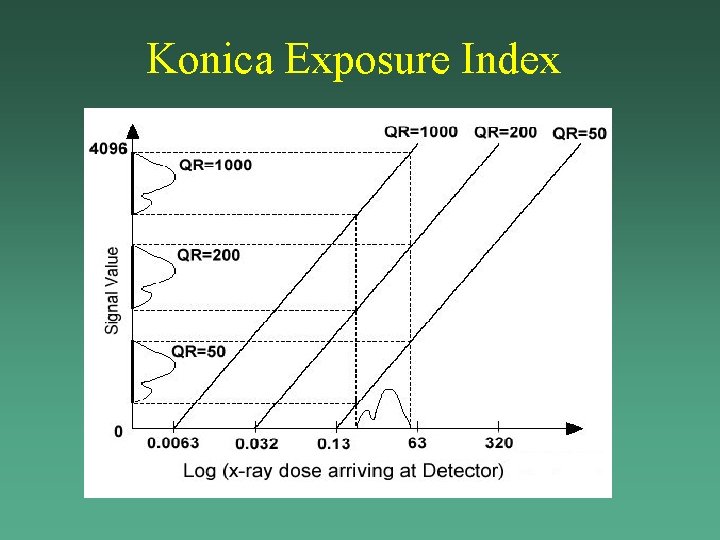
CR Indices (con’t) • Konica: Sensitivity value (S-value): S = QR x E 1/E – E 1 is plate exposure producing digital value 1535 – E is actual plate exposure in m. R – With QR=200 and 1 m. R exposure at plate, S = 200 – QR is a preset Quantization Range • QR = 50: approx 1. 3 to 1300 m. R • QR = 200: approx 0. 032 to 320 m. R • QR = 1000: approx. 0063 to 63 m. R
Konica Exposure Index
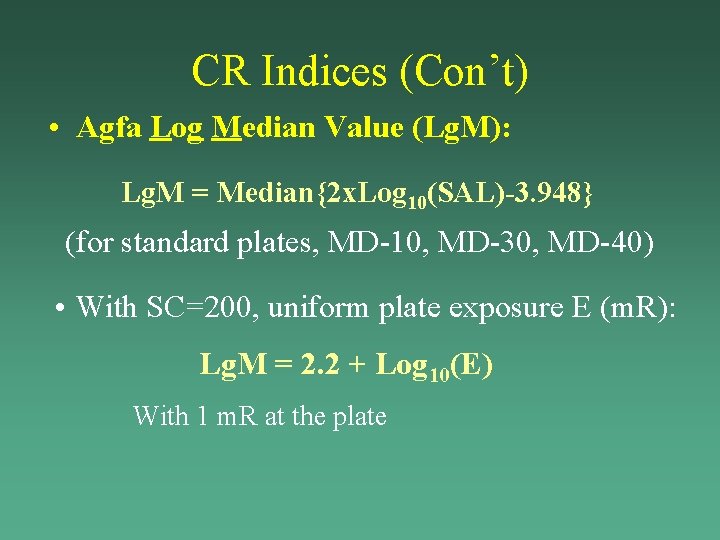
CR Indices (Con’t) • Agfa Log Median Value (Lg. M): – Raw PMT values square root amplification – mapped to 12 -bit pixel Scan Average Level (SAL) – Quantiz range depends on preset speed class ‘SC’ – Digital SAL value related to plate exposure as: SAL = [1800 x (SC/200) x (u. Gy/20)]1/2 –EG: standard plate, SC=200, 75 k. Vp, 1. 5 mm Cu: 20 u. Gy (~2. 3 m. R) SAL=1800 8. 7 u. Gy (~1 m. R) SAL=1200 103 u. Gy (~11. 5 m. R) SAL=4095 (limits dyn range)
CR Indices (Con’t) • Agfa Log Median Value (Lg. M): Lg. M = Median{2 x. Log 10(SAL)-3. 948} (for standard plates, MD-10, MD-30, MD-40) • With SC=200, uniform plate exposure E (m. R): Lg. M = 2. 2 + Log 10(E) With 1 m. R at the plate
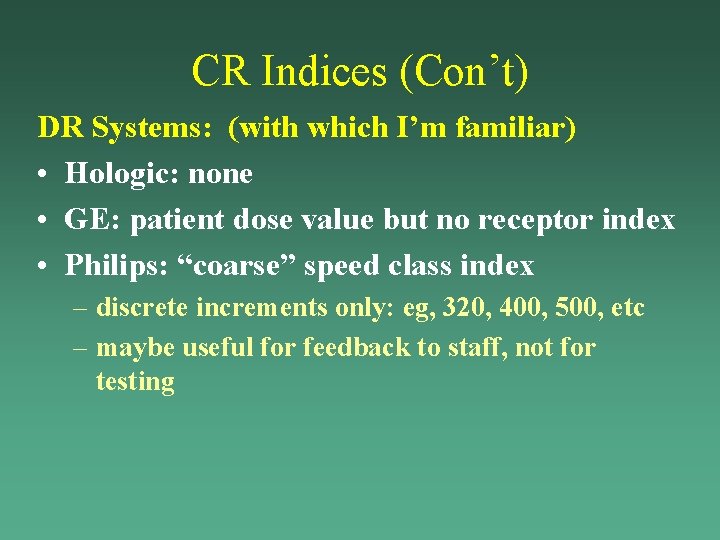
CR Indices (Con’t) DR Systems: (with which I’m familiar) • Hologic: none • GE: patient dose value but no receptor index • Philips: “coarse” speed class index – discrete increments only: eg, 320, 400, 500, etc – maybe useful for feedback to staff, not for testing
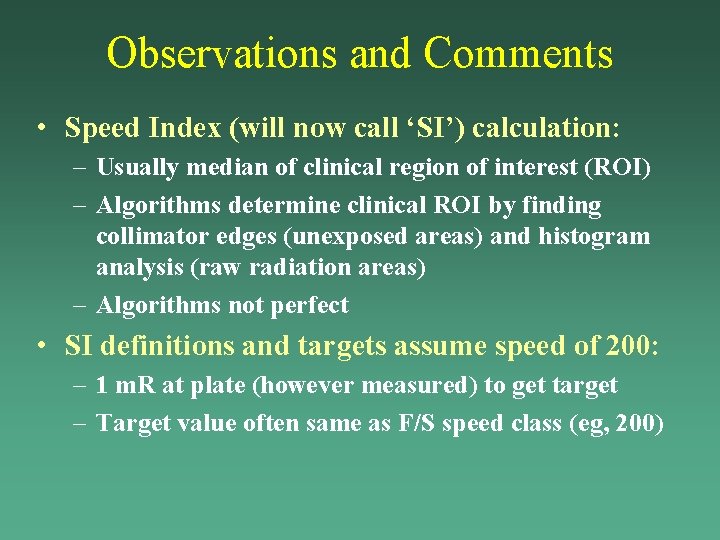
Observations and Comments • Speed Index (will now call ‘SI’) calculation: – Usually median of clinical region of interest (ROI) – Algorithms determine clinical ROI by finding collimator edges (unexposed areas) and histogram analysis (raw radiation areas) – Algorithms not perfect • SI definitions and targets assume speed of 200: – 1 m. R at plate (however measured) to get target – Target value often same as F/S speed class (eg, 200)
Objectives of This Presentation • Conventional speed values film/screen • Exposure or Speed indices used by CR/DR • Establishing CR exposures and SI target levels – – – CR exposure index (Lg. M) calibration process CR energy dependence Reader and plate differences Selection of desired exposure level Measuring plate exposure • AEC setup and performance testing with SIs • Speed/Exposure index as QC tool Techs
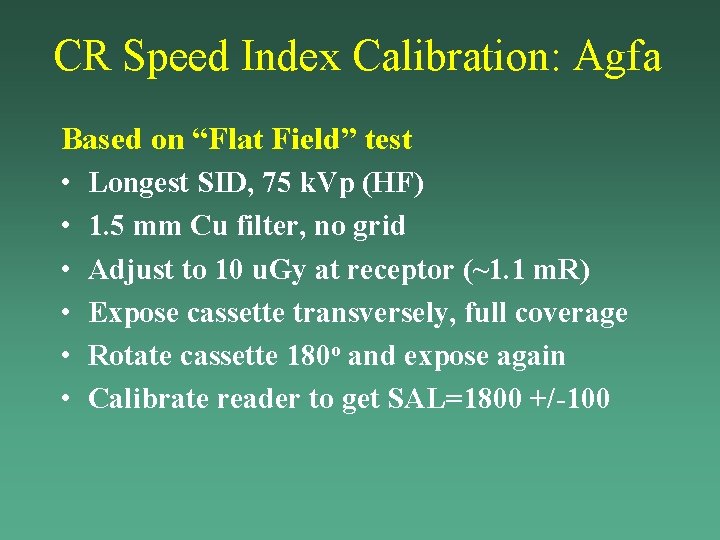
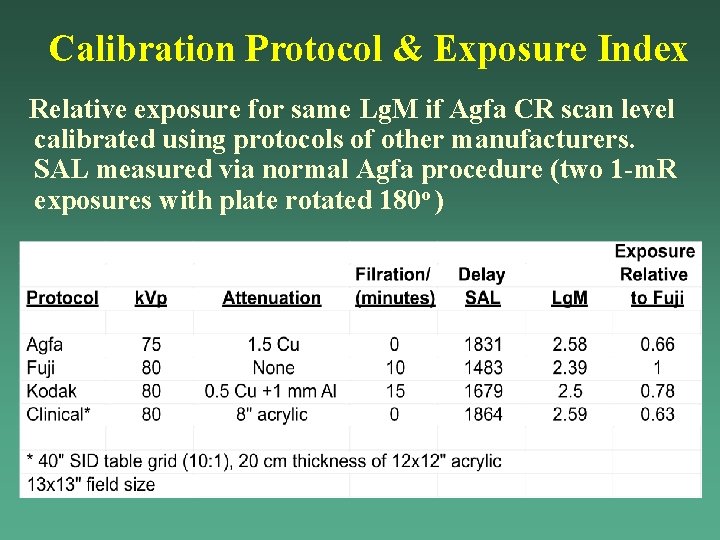
CR Speed Index Calibration: Agfa Based on “Flat Field” test • Longest SID, 75 k. Vp (HF) • 1. 5 mm Cu filter, no grid • Adjust to 10 u. Gy at receptor (~1. 1 m. R) • Expose cassette transversely, full coverage • Rotate cassette 180 o and expose again • Calibrate reader to get SAL=1800 +/-100
Calibration Protocol & Exposure Index Relative exposure for same Lg. M if Agfa CR scan level calibrated using protocols of other manufacturers. SAL measured via normal Agfa procedure (two 1 -m. R exposures with plate rotated 180 o )
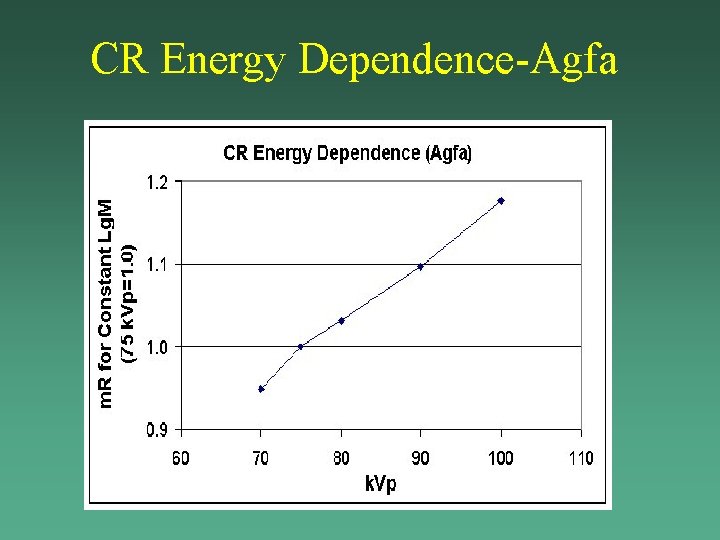
CR Energy Dependence-Agfa
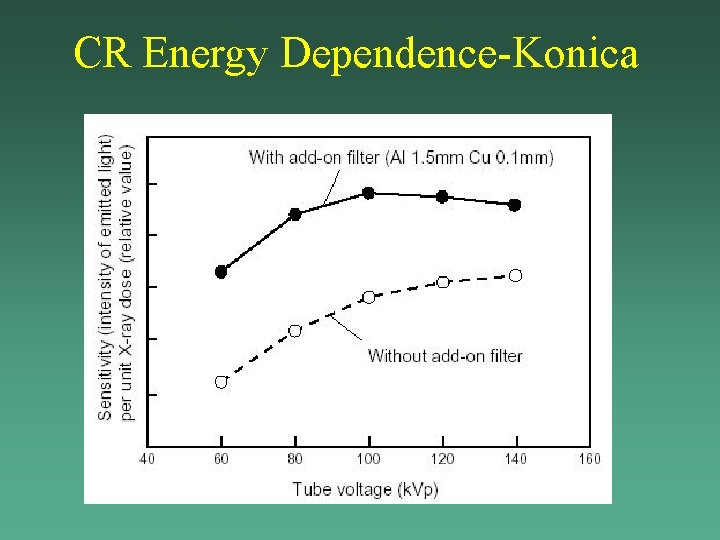
CR Energy Dependence-Konica
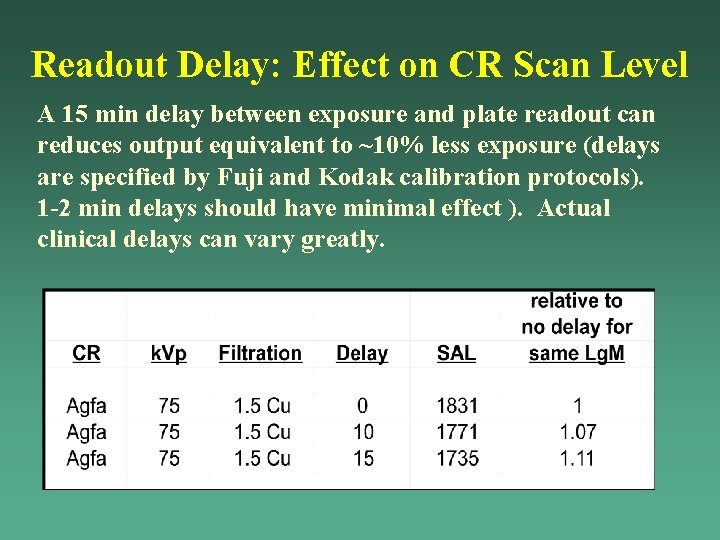
Readout Delay: Effect on CR Scan Level A 15 min delay between exposure and plate readout can reduces output equivalent to ~10% less exposure (delays are specified by Fuji and Kodak calibration protocols). 1 -2 min delays should have minimal effect ). Actual clinical delays can vary greatly.
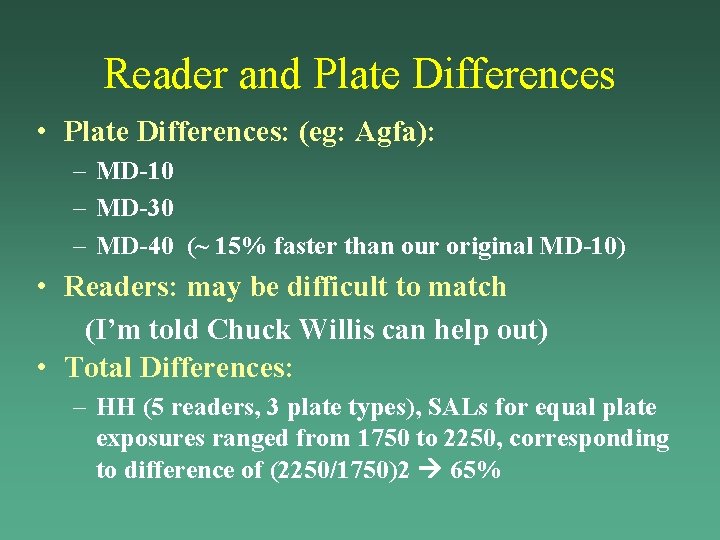
Reader and Plate Differences • Plate Differences: (eg: Agfa): – MD-10 – MD-30 – MD-40 (~ 15% faster than our original MD-10) • Readers: may be difficult to match (I’m told Chuck Willis can help out) • Total Differences: – HH (5 readers, 3 plate types), SALs for equal plate exposures ranged from 1750 to 2250, corresponding to difference of (2250/1750)2 65%
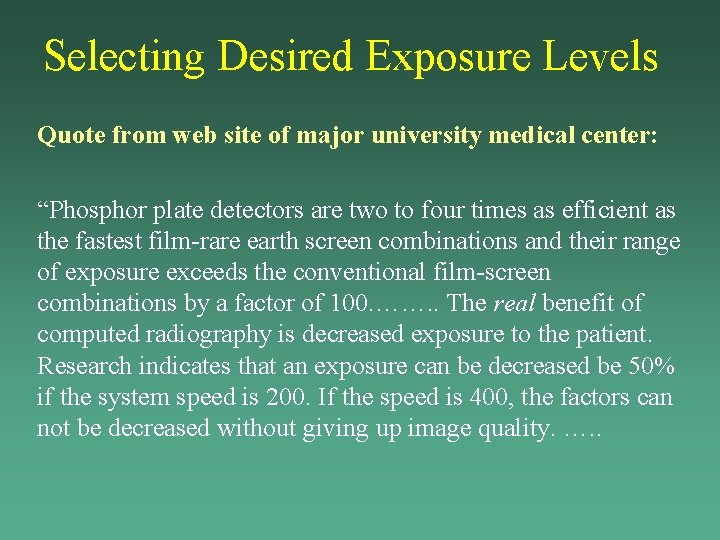
Selecting Desired Exposure Levels Quote from web site of major university medical center: “Phosphor plate detectors are two to four times as efficient as the fastest film-rare earth screen combinations and their range of exposure exceeds the conventional film-screen combinations by a factor of 100. ……. . The real benefit of computed radiography is decreased exposure to the patient. Research indicates that an exposure can be decreased be 50% if the system speed is 200. If the speed is 400, the factors can not be decreased without giving up image quality. …. .
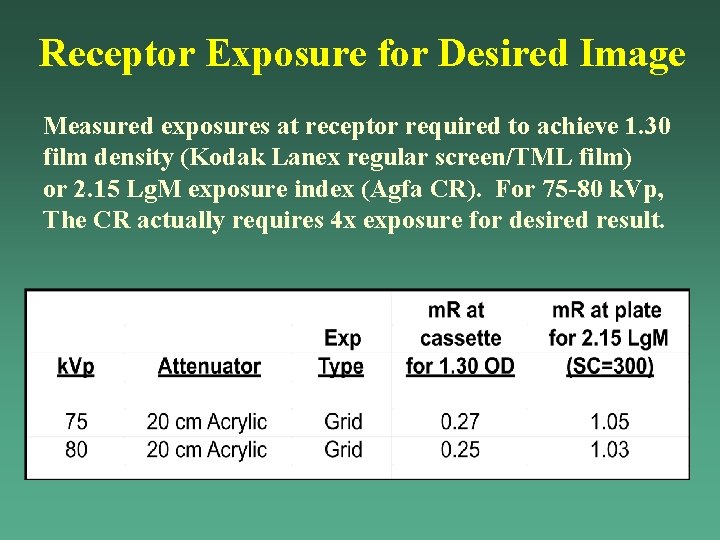
Receptor Exposure for Desired Image Measured exposures at receptor required to achieve 1. 30 film density (Kodak Lanex regular screen/TML film) or 2. 15 Lg. M exposure index (Agfa CR). For 75 -80 k. Vp, The CR actually requires 4 x exposure for desired result.
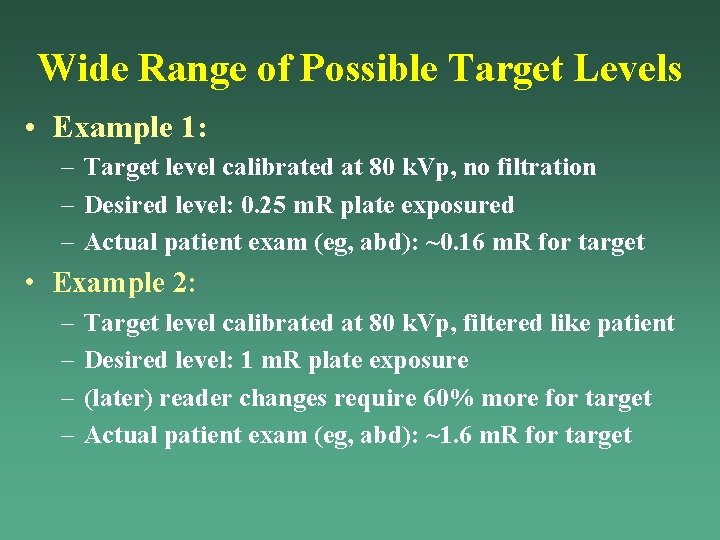
Wide Range of Possible Target Levels • Example 1: – Target level calibrated at 80 k. Vp, no filtration – Desired level: 0. 25 m. R plate exposured – Actual patient exam (eg, abd): ~0. 16 m. R for target • Example 2: – – Target level calibrated at 80 k. Vp, filtered like patient Desired level: 1 m. R plate exposure (later) reader changes require 60% more for target Actual patient exam (eg, abd): ~1. 6 m. R for target
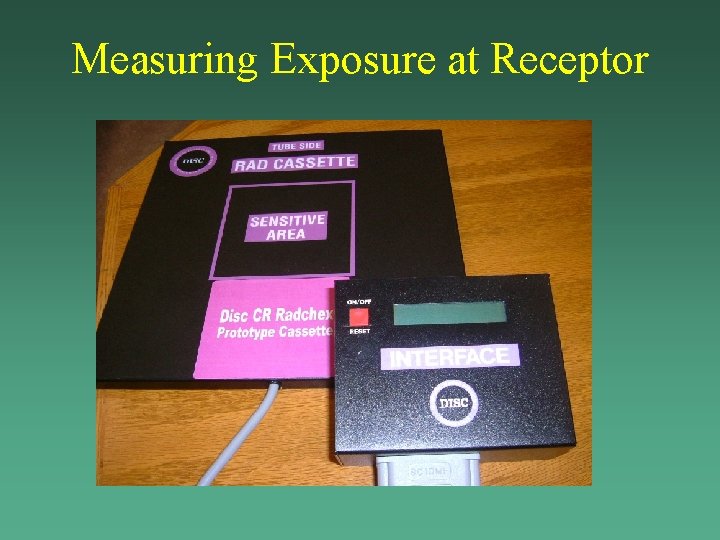
Measuring Exposure at Receptor
Objectives of This Presentation • • Conventional speed values film/screen Exposure or Speed indices used by CR/DR Establishing CR exposures and SI target levels AEC setup and performance testing with SIs – – – AEC performance testing procedures Basic problem: AECs designed for F/S Issues associated with SI calculation process Using pixel values Acceptance limits • Speed/Exposure index as QC tool Techs
AEC Performance Tests: Overview • • • Reproducibility Sensor area response k. Vp response Phan thickness response Backup timer Sensor area selection (if new or replaced)
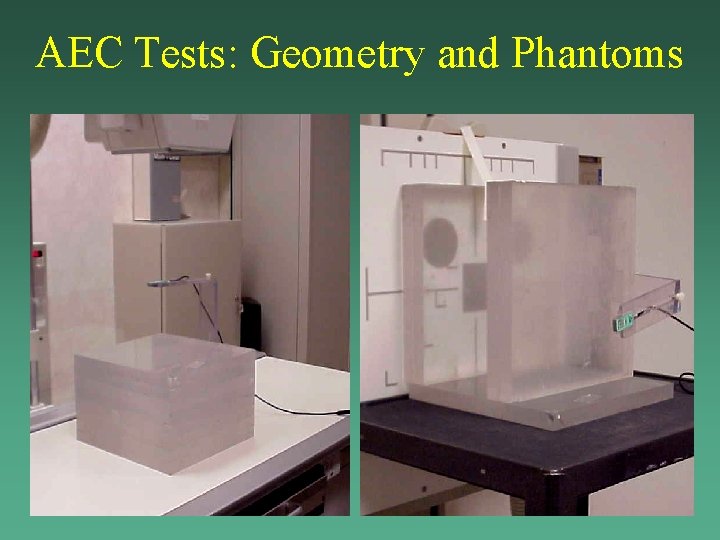
AEC Tests: Geometry and Phantoms
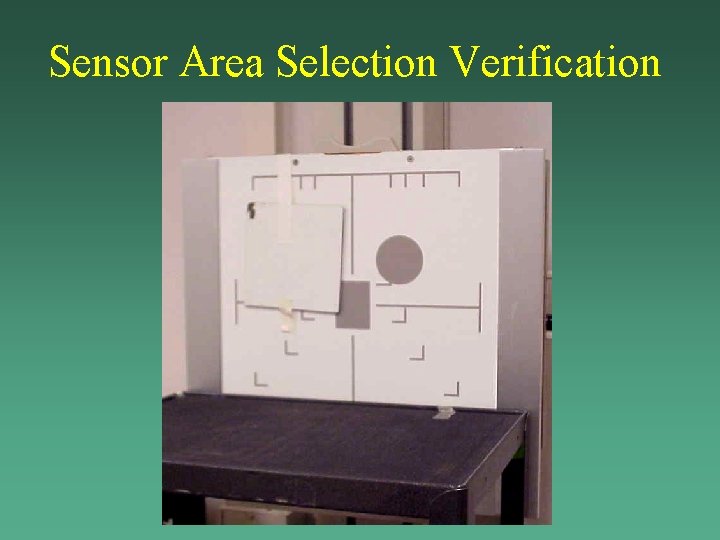
Sensor Area Selection Verification
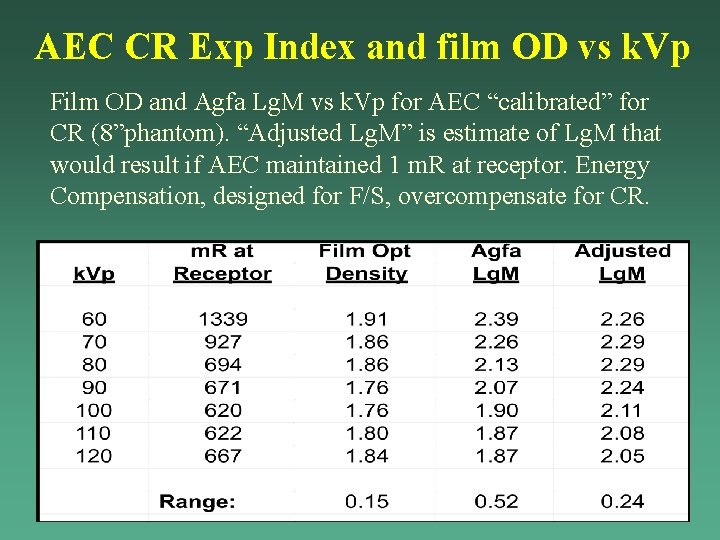
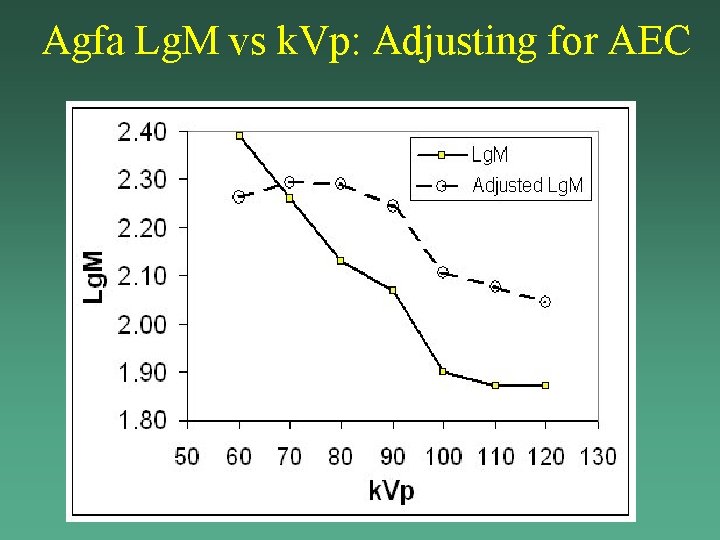
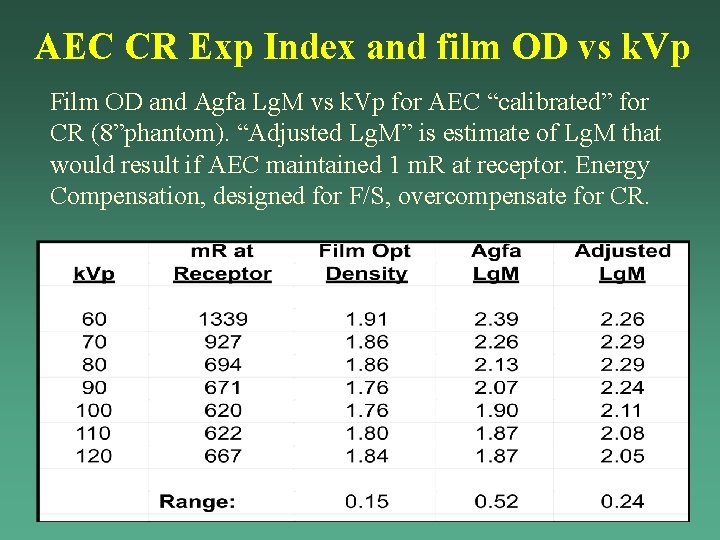
AEC CR Exp Index and film OD vs k. Vp Film OD and Agfa Lg. M vs k. Vp for AEC “calibrated” for CR (8”phantom). “Adjusted Lg. M” is estimate of Lg. M that would result if AEC maintained 1 m. R at receptor. Energy Compensation, designed for F/S, overcompensate for CR.
Agfa Lg. M vs k. Vp: Adjusting for AEC
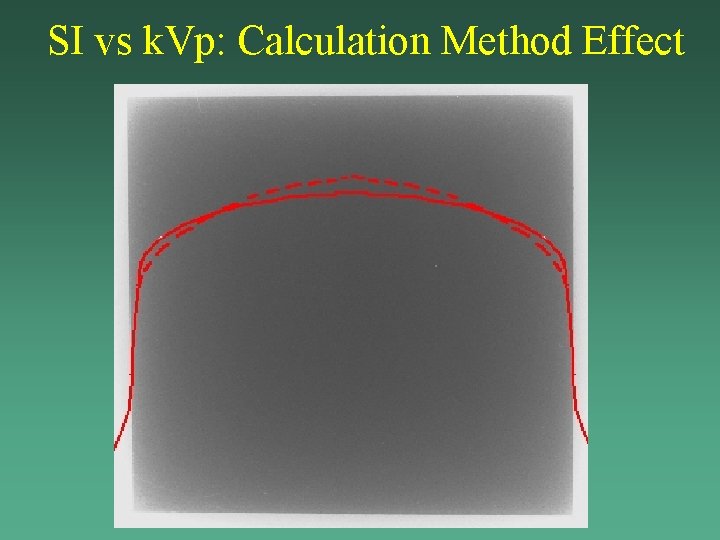
SI vs k. Vp: Calculation Method Effect
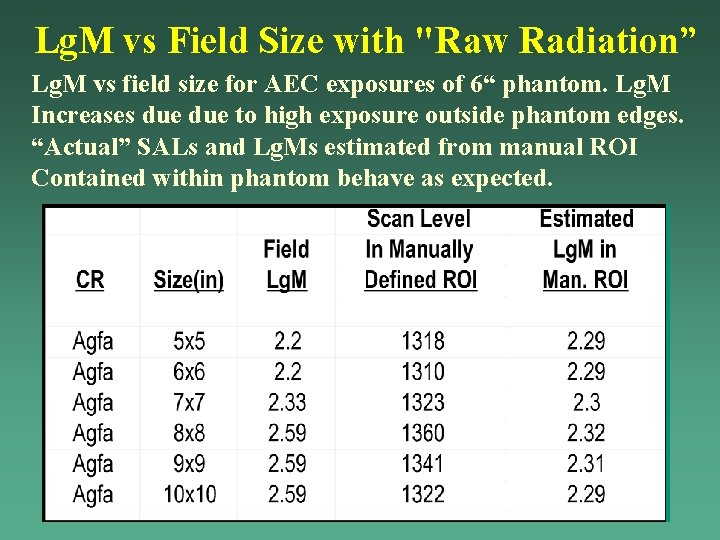
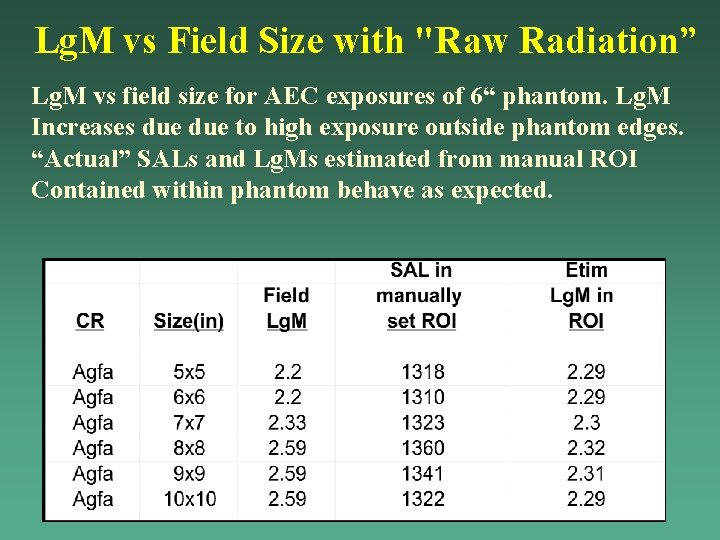
Lg. M vs Field Size with "Raw Radiation” Lg. M vs field size for AEC exposures of 6“ phantom. Lg. M Increases due to high exposure outside phantom edges. “Actual” SALs and Lg. Ms estimated from manual ROI Contained within phantom behave as expected.
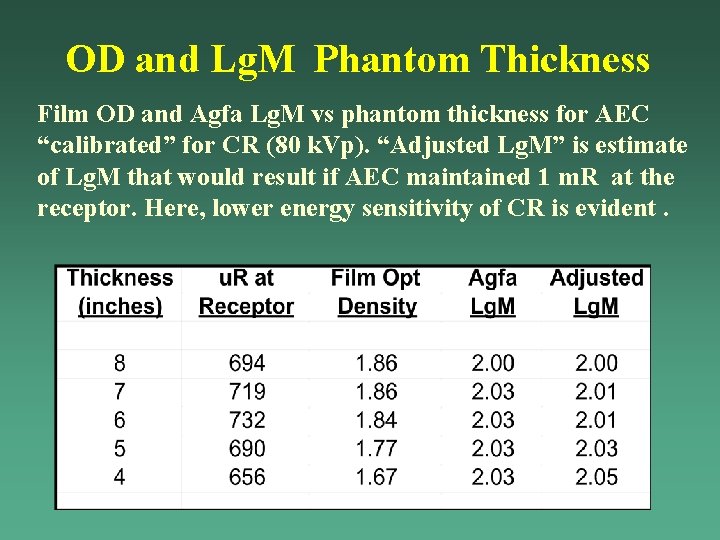
OD and Lg. M Phantom Thickness Film OD and Agfa Lg. M vs phantom thickness for AEC “calibrated” for CR (80 k. Vp). “Adjusted Lg. M” is estimate of Lg. M that would result if AEC maintained 1 m. R at the receptor. Here, lower energy sensitivity of CR is evident.
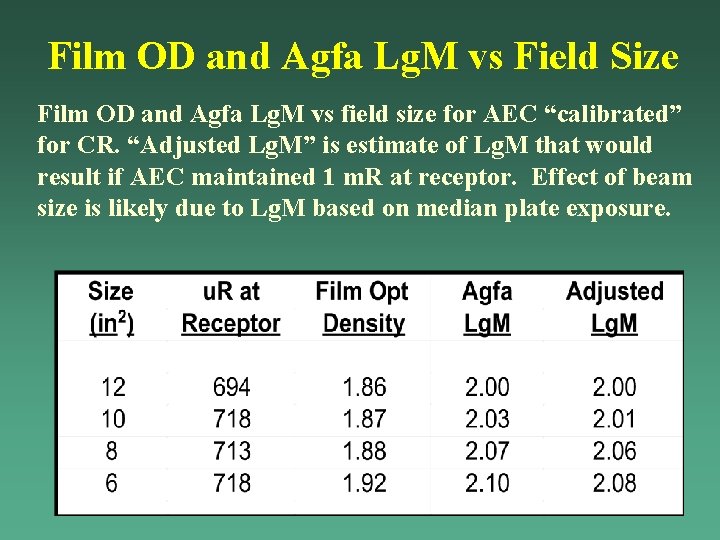
Film OD and Agfa Lg. M vs Field Size Film OD and Agfa Lg. M vs field size for AEC “calibrated” for CR. “Adjusted Lg. M” is estimate of Lg. M that would result if AEC maintained 1 m. R at receptor. Effect of beam size is likely due to Lg. M based on median plate exposure.
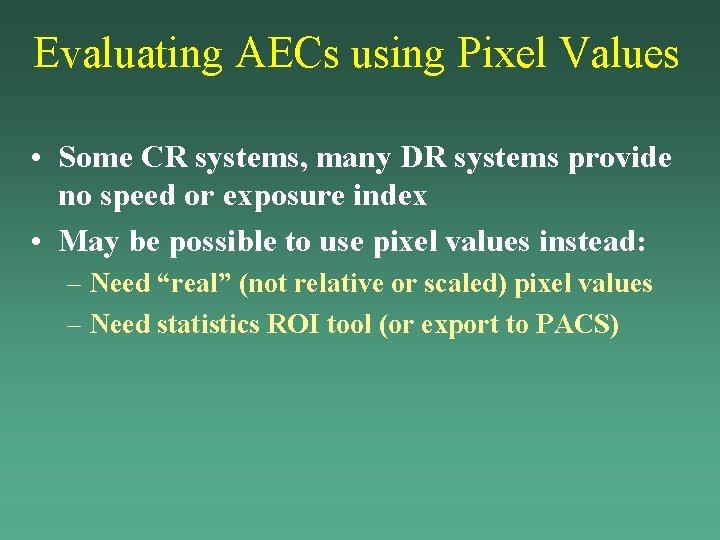
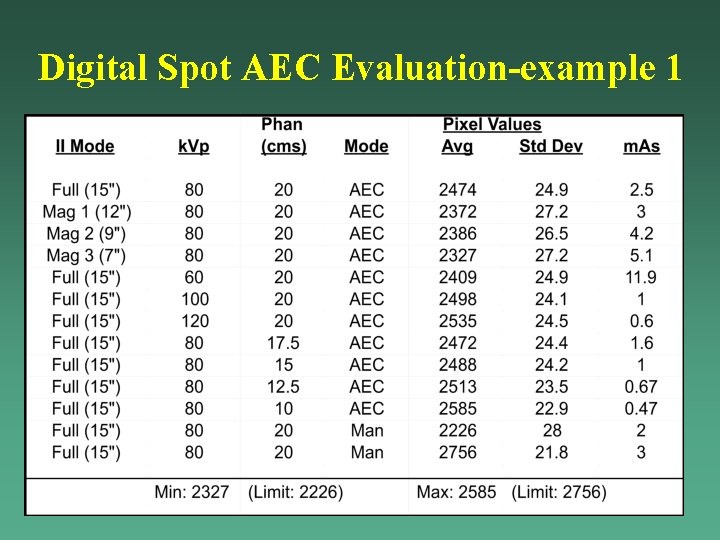
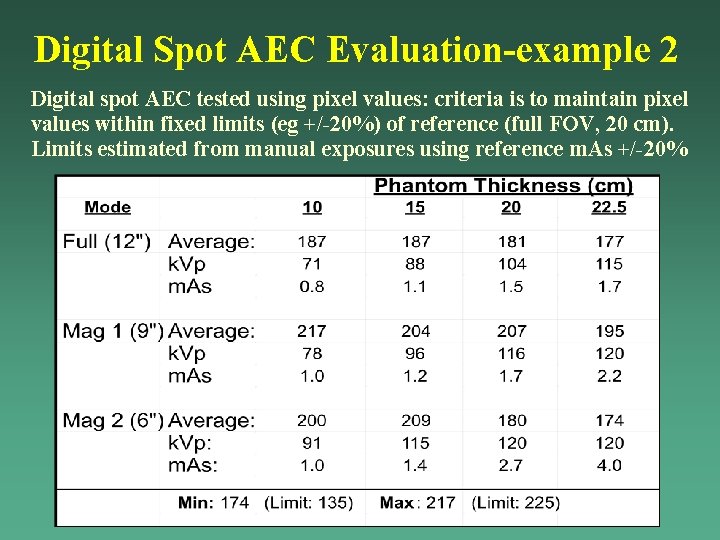
Evaluating AECs using Pixel Values • Some CR systems, many DR systems provide no speed or exposure index • May be possible to use pixel values instead: – Need “real” (not relative or scaled) pixel values – Need statistics ROI tool (or export to PACS)
Digital Spot AEC Evaluation-example 1
Digital Spot AEC Evaluation-example 2 Digital spot AEC tested using pixel values: criteria is to maintain pixel values within fixed limits (eg +/-20%) of reference (full FOV, 20 cm). Limits estimated from manual exposures using reference m. As +/-20%
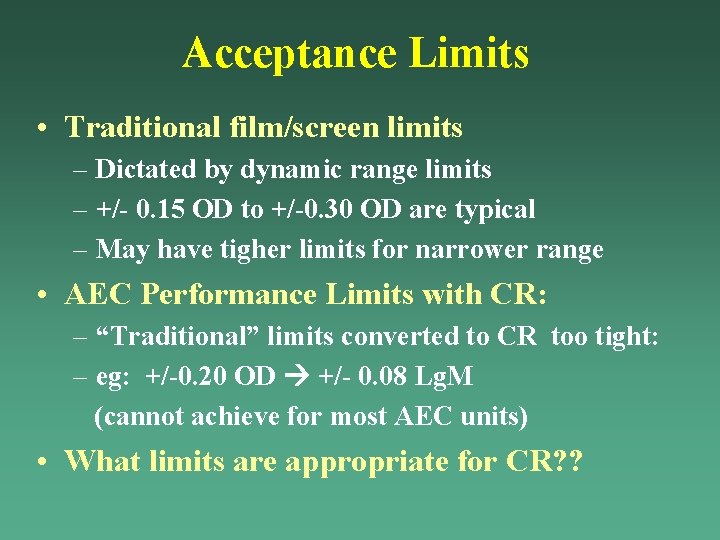
Acceptance Limits • Traditional film/screen limits – Dictated by dynamic range limits – +/- 0. 15 OD to +/-0. 30 OD are typical – May have tigher limits for narrower range • AEC Performance Limits with CR: – “Traditional” limits converted to CR too tight: – eg: +/-0. 20 OD +/- 0. 08 Lg. M (cannot achieve for most AEC units) • What limits are appropriate for CR? ?
Objectives of This Presentation • • • Conventional speed values film/screen Exposure or Speed indices used by CR/DR Establishing CR exposures and SI target levels AEC setup and performance testing with SIs Speed/Exposure index as QC tool Techs – How “tight” should “acceptance” limits be? – Sample limits used at HH – Staff education
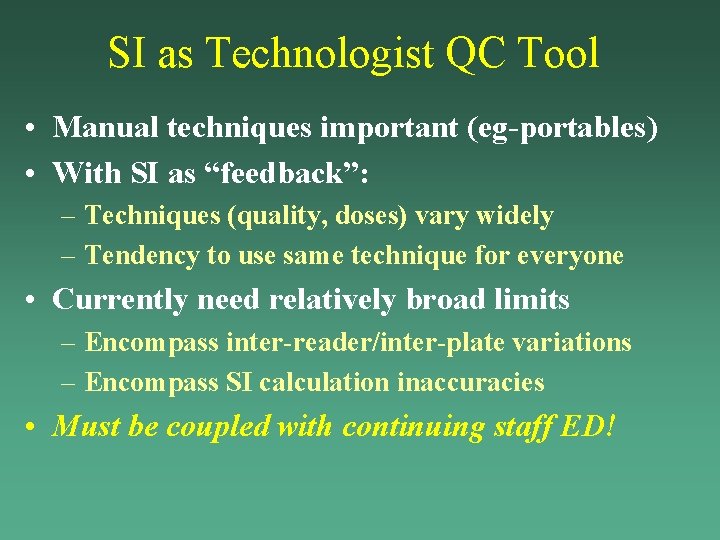
SI as Technologist QC Tool • Manual techniques important (eg-portables) • With SI as “feedback”: – Techniques (quality, doses) vary widely – Tendency to use same technique for everyone • Currently need relatively broad limits – Encompass inter-reader/inter-plate variations – Encompass SI calculation inaccuracies • Must be coupled with continuing staff ED!
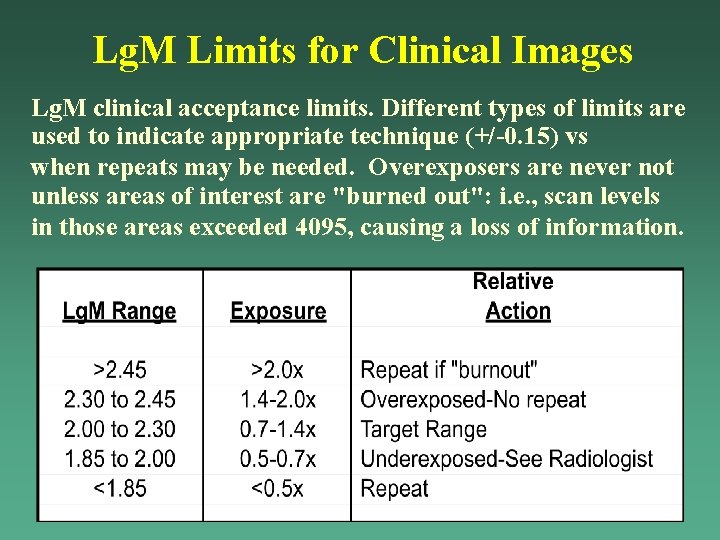
Lg. M Limits for Clinical Images Lg. M clinical acceptance limits. Different types of limits are used to indicate appropriate technique (+/-0. 15) vs when repeats may be needed. Overexposers are never not unless areas of interest are "burned out": i. e. , scan levels in those areas exceeded 4095, causing a loss of information.
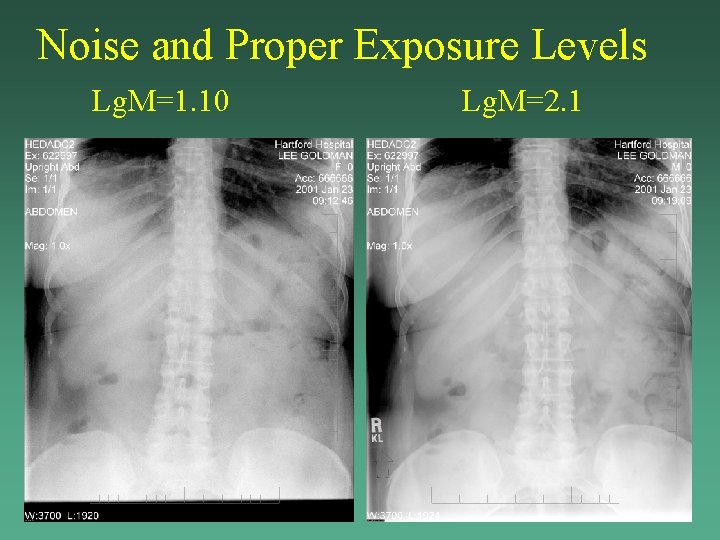
Noise and Proper Exposure Levels Lg. M=1. 10 Lg. M=2. 1
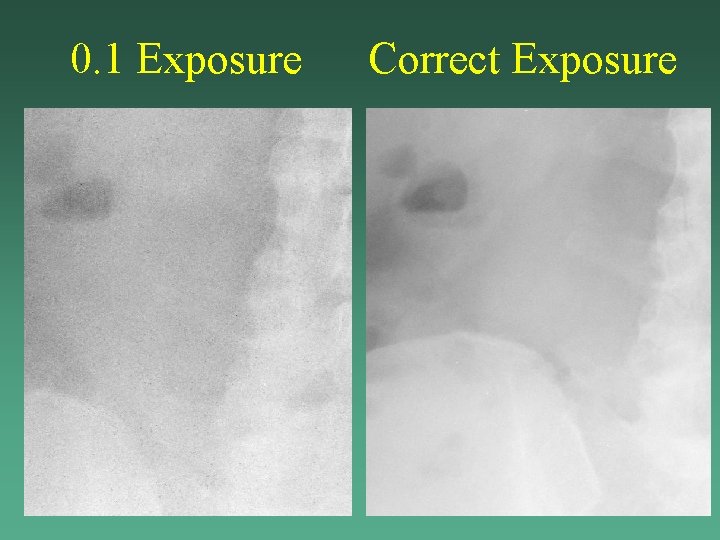
0. 1 Exposure Correct Exposure
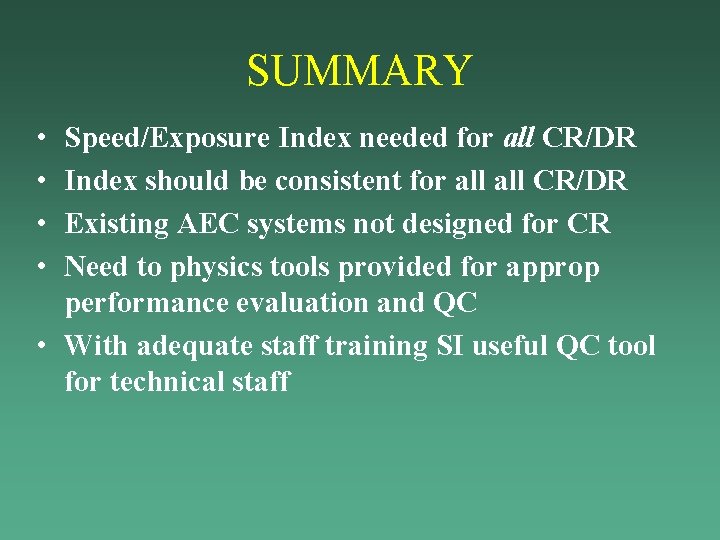
SUMMARY • • Speed/Exposure Index needed for all CR/DR Index should be consistent for all CR/DR Existing AEC systems not designed for CR Need to physics tools provided for approp performance evaluation and QC • With adequate staff training SI useful QC tool for technical staff
AEC CR Exp Index and film OD vs k. Vp Film OD and Agfa Lg. M vs k. Vp for AEC “calibrated” for CR (8”phantom). “Adjusted Lg. M” is estimate of Lg. M that would result if AEC maintained 1 m. R at receptor. Energy Compensation, designed for F/S, overcompensate for CR.
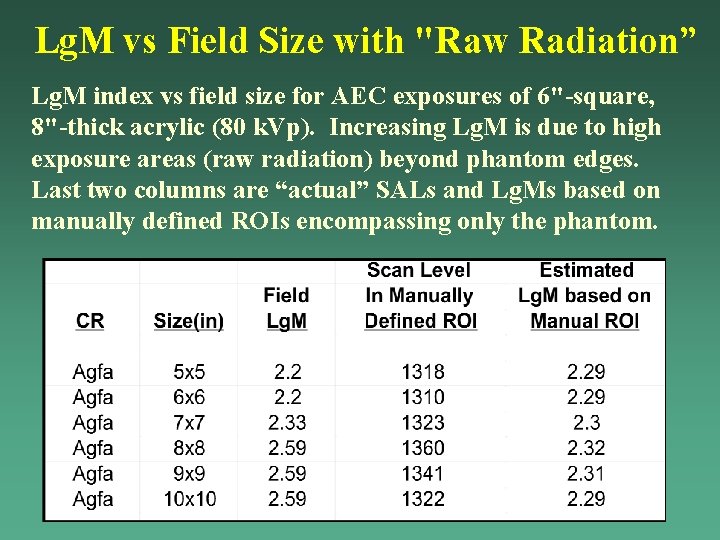
Lg. M vs Field Size with "Raw Radiation” Lg. M index vs field size for AEC exposures of 6"-square, 8"-thick acrylic (80 k. Vp). Increasing Lg. M is due to high exposure areas (raw radiation) beyond phantom edges. Last two columns are “actual” SALs and Lg. Ms based on manually defined ROIs encompassing only the phantom.
Lg. M vs Field Size with "Raw Radiation” Lg. M vs field size for AEC exposures of 6“ phantom. Lg. M Increases due to high exposure outside phantom edges. “Actual” SALs and Lg. Ms estimated from manual ROI Contained within phantom behave as expected.