Spectrophotometry Flame Atomic Absorption 2 Interferences Any factor

Spectrophotometry Flame Atomic Absorption 2

Interferences • Any factor that influences the atomisation of the analyte (whether it be chemical or physical) is an interference. • Common interferences are: – Spectral interferences – Chemical interference – Ionisation interference – Matrix/Physical interferences

Spectral Interference • Due to radiation overlapping that of the light source. – May be due to an absorption or emission line of another element. – May be due to background radiation from the flame, solvent or the analyte. • eg: when determining iron, if there is copper or nickel present, the emission lines may cause interference.

Chemical Interference • Cation Interference: – Al and Ti interfere as they tend to form anionic oxy or hydroxy species which then combine with analyte ions to form interfering compounds like Ca. Al 2 O 4. – Ti enhances Al and V absorbances and Al enhances the absorbances of V. • Anion interference: – Different salts can be produced from the standard and sample solution. • Two methods of reducing this interference: – Adding a protecting agent (eg: EDTA) which will preferentially bind to the element of interest. – Adding a releasing agent that will preferentially bind to phosphates, silicates and aluminates, freeing up the element of interest. (eg: lanthanum chloride)

Solution Absorbance 5 mg/L Sr 2+ 0. 285 5 mg/L Sr 2+ + 500 mg/L Al 3+ 0. 165 5 mg/L Sr 2+ + 500 mg/L PO 43 - 0. 255 5 mg/L Sr 2+ + 500 mg/L SO 42 - 0. 265 5 mg/L Sr 2+ + 1% La 3+ 0. 258 5 mg/L Sr 2+ + 1% La 3+ + 500 mg/L Al 3+ 0. 258 5 mg/L Sr 2+ + 1% La 3+ + 500 mg/L PO 43 - 0. 258 5 mg/L Sr 2+ + 1% La 3+ + 500 mg/L SO 42 - 0. 260

Chemical Interference • In the flame the elements in the solution droplets are broken down into ground state atoms. MX M 0 + X 0 • The energetic nature of the flame excites the atoms to the extent that they lose a number of electrons and ionisation occurs. M 0 M+ + e-

Chemical Interference • Adding an excess of a readily ionised salt adds excess electrons to the flame and supresses ionisation. M+ + e M 0 excess • Potassium chloride and Lanthanum chloride are widely used ionisation suppressants.

Physical interferences • Three types: – Sensitivity is enhanced by the presence of an organic solvent. – Sensitivity is depressed by the sample having a greater viscosity than the standard solutions. – The result is depressed due to high salt content. • To overcome: – Match the matrix of the standards with the analyte. – Using solvent extraction to separate the element of interest. – Standard addition

Physical Interferences • High amounts of total dissolved solids can cause background absorption. – Background correction should be used if the resonance wavelength is below 400 nm for the element being analysed. • Variation in the physical properties (density, viscosity and surface tension) of the sample and standards may result in different size droplets and different amounts of analyte entering the flame.

Use of Solvent Extraction • If the concentration of the analyte is well below the working range, solvent extraction should be used. • Pre-concentrating a sample by extracting 100 ml of aqueous analyte solution into 10 ml of organic solvent can bring the element concentration within range.

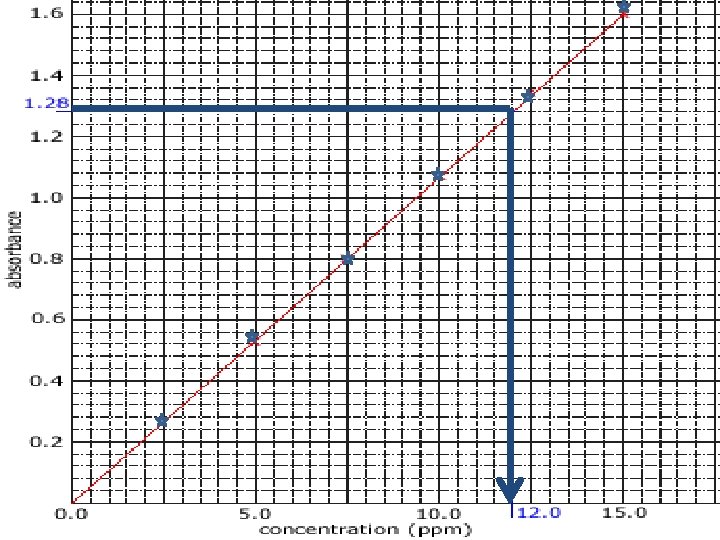
Calibration • When calibrating an instrument a blank solution and 4 -5 standards are prepared. – eg: if the working range is 2 -8 ppm, standards of 2, 4, 6 and 8 ppm are recommended. • Once the calibration standards are analysed, plotting absorbance vs concentration should give a linear graph or a smooth curve.

Drift • A random calibration standard should be analysed every 5 -10 samples to check instrument drift. • If instrument drift is confirmed, there is a “reslope” function to account for the difference in result.

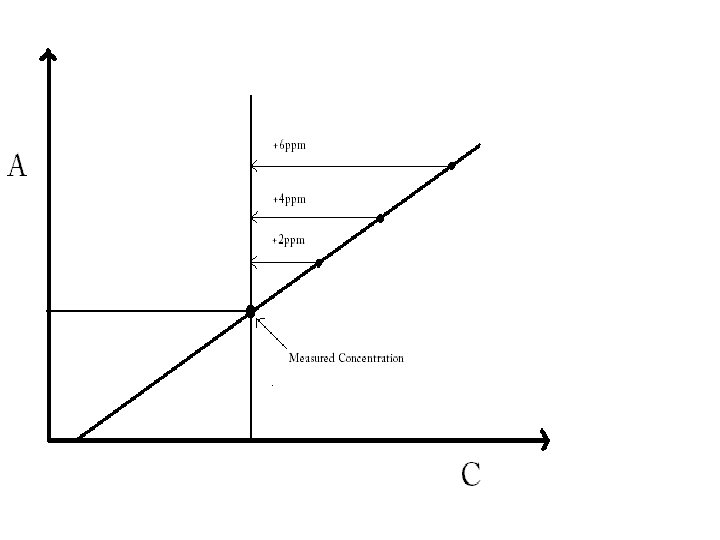
Standard Addition • A particular sample may give a lower absorbance reading due to interference. Standard addition can be used to rectify this. • Standard addition involves adding a certain concentration of the element to be analysed in step wise portions. – The calibration graph is plotted and the point of intersection on the negative axis gives the true concentration of the sample.

Example • Suppose 250 ml of sample is known to have a concentration of 12 ppm of Mn. When analysed the result is only 6 ppm. • Interference in expected and a standard addition calibration is decided upon.

The volume of 1000 ppm Mn needed to add 2, 4 and 6 ppm to the sample solution is calculated and the volume added by micropipette.
- Slides: 17