Spectral Characteristics In Remote Sensing Everything emits radiant


 is defined as the distance between the maximums or minimums")


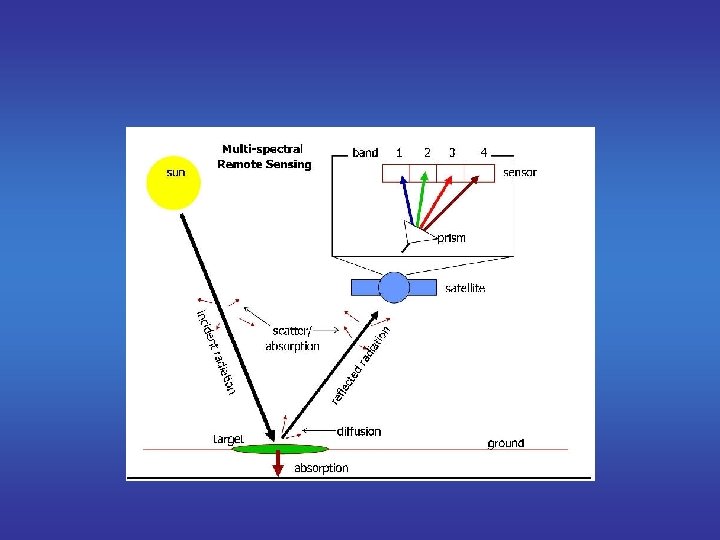
 is recorded for each pixel, in each")


 True-color composite images approximate the range of vision for")


 ►")
 ► Greatest water penetration ► Greatest")
 ► Vegetation discrimination ► Vigor Assessment")
 ► Chlorophyll absorption band of healthy")
 ► Wide range of sensitivity ► Visible")


- Slides: 45
Spectral Characteristics In Remote Sensing
Everything emits radiant energy. Technically speaking, energy is emitted by all objects above absolute zero
We can measure light in wavelengths.
Wavelength • Wavelength (λ) is defined as the distance between the maximums or minimums of a roughly periodic pattern. • Normally measured in micrometers (µ) or nanometers (nm).
The light we can see is a small part of the light on Earth (and in the universe!)
Remote Sensing uses our knowledge of this whole great Electromagnetic Spectrum
Every kind of surface reflects light differently, absorbing and reflecting it more or less in different wavelengths.
Every kind of surface has its own “spectral signature. ”
Spectral Signatures of Some Common Foods
People have learned to relate different kinds of surfaces and their spectral signatures to what they look like in a satellite scene. Guy with hand-held spectrometer
Seeing leaves with remote sensing IR = Infrared R = Red light G = Green light B = Blue light Infrared, green, and blue light from the sun hit the leaves. Green and Infrared light are reflected from the leaves, so that’s what we see.
Put another way… Chlorophyll strongly absorbs radiation in the red and blue wavelengths and reflects green wavelengths. This is why healthy vegetation appears green. Healthy leaves are excellent reflectors of near-infrared wavelengths. So we can use near-infrared reflectance to determine how healthy (or unhealthy) vegetation may be.
Remote Sensing Pathway of Light
Sensors sense some segment of the Electromagnetic Spectrum Reads the “spectral signature” of the surface that is reflecting/emitting light
Sensors Record Intensity of Reflected Energy Numerically
The amount of the reflected energy (intensity) is recorded for each pixel, in each band, on a scale of 0 -255.
Assigning Colors to Bands
Visible 1 2 Infrared 3 4 5 3, 2, 1 Green Blue Red Data is shown as Blue Green Red 6 7
Visible 1 2 Infrared 3 4 5 4, 3, 2 Green Red NIRDataisisisshownasas as. Green Red Blue 6 7
So we see more than we could otherwise. Same scene, different wavelengths Visible wavelengths Infrared wavelengths
True-Color Composite (3, 2, 1) True-color composite images approximate the range of vision for the human eye, and hence these images appear to be close to what we would expect to see in a normal photograph. True-color images tend to be low in contrast and somewhat hazy in appearance. This is because blue light is more susceptible than other bandwidths to scattering by the atmosphere. Broad-based analysis of underwater features and landcover are representative applications for truecolor composites. Near Infrared Composite (4, 3, 2) Adding a near infrared (NIR) band dropping the visible blue band creates a near infrared composite image. Vegetation in the NIR band is highly reflective due to chlorophyll, and an NIR composite vividly shows vegetation in various shades of red. Water appears dark, almost black, due to the absorption of energy in the visible red and NIR bands. Shortwave Infrared Composite (7, 4, 3 or 7, 4, 2) A shortwave infrared composite image is one that contains at least one shortwave infrared (SWIR) band. Reflectance in the SWIR region is due primarily to moisture content. SWIR bands are especially suited for camouflage detection, change detection, disturbed soils, soil type, and vegetation stress.
Some different band combinations…
Landsat 7, Path 35 Row 34, 09. 12. 00 3, 2, 1
4, 3, 2
7, 5, 2
7, 4, 2
Energy Sources ► Need an energy source that provides illumination ► Or a source that emits electromagnetic energy
Electromagnetic Energy and the atmosphere ► Radiation reacts to the atmosphere both to the target and the sensor
Atmospheric Scattering ► Rayleigh scatter Scattering-shorter wavelength to ► Mie Scattering-longer wavelengths to scatter ► Non-Selective wave lengths Scattering-Larger than the
Atmospheric Absorption ► Carbon ► Ozone Dioxide
Atmospheric Windows ► Comparing ► What the sun and the earth is visible and our eyes are most sensitive to corresponds with the peak energy level of the sun
Electromagnetic Energy and earth objects ► EMR interacts the same with features on the earth as it does with the atmosphere. ► Specular-smooth ► Diffuse- Rough
Emission of Electromagnetic Radiation ► Temperature ► Warmer-more ► Cooler- energy shorter wavelengths less energy longer wavelengths ► Emissivity- Varies with composition (Water)
Spectral Properties of Objects ► The spectral properties of an object allow us to conduct analysis. ► Objects absorb and reflect electromagnetic energy. ► Spectral Signature-a pattern of spectral response. ► Spectral Response Curve-Percentage of radiation of different wavelengths
Spectral Bands Commonly used in Remote Sensing ► Visible Green/Red ► Near infrared ► Mid-infrared bands ► Blue and thermal infrared
Remote Sensing in the Ultraviolet Spectrum ► UV Radiation is absorbed and scattered by the earth’s atmosphere. ► Some materials when illuminated by ultraviolet radiation absorb UV radiation and reemit it as visible light, this is known as fluorescence.
Remote Sensing in the Visible Spectrum ► What the human eye can see ► Photographic Film ► Cameras ► Digital Cameras ► Scanners
Applications of Visible Bands ► Visible Blue Band (. 45 -. 52 microns) ► Visible Green Band (. 52 -. 60 microns) ► Visible Red Band (. 63 -. 69 microns) ► Panchromatic Bands (. 50 -. 90 microns)
Visible Blue Band (. 45 -. 52 microns) ► Greatest water penetration ► Greatest atmospheric scattering ► Greatest absorption ► Used for : water depth water characteristics detection of subsurface features soil and vegetation discrimination forest, geology, cultural features
Visible Green Band (. 52 -. 60 micrometers) ► Vegetation discrimination ► Vigor Assessment ► Cultural Features ► Urban Infrastructure ► Less affected by atmospheric scattering ► Sediment and Chlorophyll Concentration
Visible Red Band (. 63 -. 69 micrometers) ► Chlorophyll absorption band of healthy green vegetation. ► Vegetation type ► Plant condition ► Soil and Geologic Boundaries ► Cultural Features ► Least affected by atmospheric scattering ► Less water penetration but good near surface information ie. Water quality, sediment, and chlorophyll.
Panchromatic Bands (. 50 -. 90 micrometers) ► Wide range of sensitivity ► Visible to Near IR ► Higher spatial resolution ► Can be combined with other multi-spectral bands.
Remote Sensing in the Infrared Spectrum ► Near infrared band (. 7 -1. 0 micrometer) ► Short-wave infrared band (1. 0 -3. 0 micrometer) ► Medium Wave (3. 0 -8 micrometer) ► Long Wave (8 -14 micrometer)
Remote Sensing in the Microwave Region ► No significant solar radiation in this portion of the spectrum. ► Use antenna and sophisticated electronics to focus on microwave energy. Valuable for sea surface temperature