Special Senses Chapter 17 The Special Senses and

 - chemical Taste")


 • Posterior")
 – Eyelashes – Eyebrows – Lacrimal apparatus")


- Slides: 62
Special Senses Chapter 17
The Special Senses and their modalities • • • Olfaction (Smell) - chemical Taste (Gustation) – chemical Vision (Sight) – photo Hearing – mechanical Equilibrium - mechanical
Olfaction • 10 – 100 million receptors on the roof of the nasal cavity. (about 5 square cm) • Three types of cells: – Olfactory receptors (bipolar neurons) – Supporting cells (pseudostratified columnar) – Basal stem cells (mitotic cells producing new receptors) • Just about the only nuerons that replace themselves in mature humans! • Olfactory (Bowman’s) glands – secrete mucus
Olfactory receptors
Olfactory epithelium
Olfactory physiology • 7 primary odors – Floral – Musky – Camphorous – Pepperminty – Etheraeal – Pungent – Putrid • About 10, 000 different odors are recognizable • Much depends upon experience and synthetic processing in the brain • Dogs have about 30, 000 times the acuity for smell
Olfactory pathway
Gustation • About 80% of taste is dependent upon smell • 5 primary tastes – Sweet – Salty – Sour – Bitter – Umami (savory) • Lowest threshold is for bitter, highest is for sweet • Lowest adaptation is for bitter, highest for sweet
Taste & the tongue
Four types of Papillae • Circumvallate – at the back of the tongue • Fungiform – all over • Foliate – lateral margins of tongue, taste buds gone after childhood • Filiform – all over tongue but not for taste, for friction
Different receptors respond to different stimuli
Neural pathways • Anterior tongue innervated by the facial nerve (CN VII) • Posterior tongue innervated by the glossopharyngeal (CN IX) • Lead to the solitary nucleus in the medulla and then to the thalamus and gustatory cortex (perception) or limbic system via the hypothalamus
Vision • Accessory structures – Eyelids (palpabrae) – Eyelashes – Eyebrows – Lacrimal apparatus – Extrinsic eye muscles • Superior & inferior rectus • Lateral & medial rectus • Superior & inferior obliques
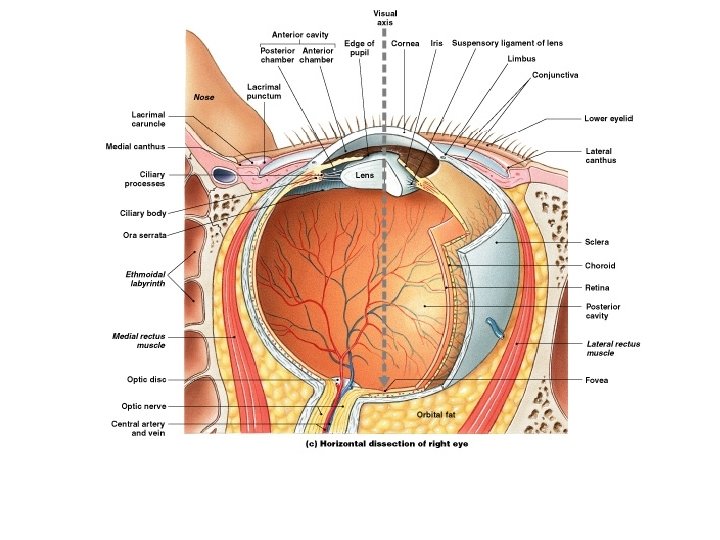
The eye
Fig. 16. 05
The Eyeball
The eyeball
The Tunics of the eye
The iris
Fig. 16. 08 The retina
Fig. 16. 09 Photoreceptors
Circulation of aqueous humor
The Optics of vision: Refraction
Fig. 16. 12 Common vision defects and their correction
Rods & Cones ~ 125 million rods ~ 6 million cones
Physiology of photoreception
Physiology of photoreception
Fig. 16. 15
• Integration of information from red, green, and blue cones Color Sensitivity Figure 17– 16
Color Blindness • Inability to detect certain colors • Normal color vision – 16% blue – 10% green – 74% red • Red-green color-blindness – Missing red cones leads to an inability to distinguish re from green. – Can be variable – Most common form is Xlinked, leading to more male than females Figure 17– 17
Visual peception and neural pathways
Off-Center Neurons • Inhibited by light in central zone • Stimulated by illumination at edges • Aids in “Acuity” • Cones are for precise vision • Rods are for contrast & low light and peripheral vision Figure 17– 18
Visual pathways
Contralateral & ipsilateral paths
The Ear Figure 17– 20
Middle Ear Figure 17– 21
Inner Ear Figure 17– 22
Anterior, Posterior, and Lateral Semicircular Ducts Figure 17– 23
Fig. 16. 23
Utricle and Saccule Figure 17– 23
Otolith • Gelatinous matrix and statoconia Figure 17– 24
• Instructions descend in vestibulospinal tracts of spinal cord Peripheral Muscle Tone, Head, and Neck Movements
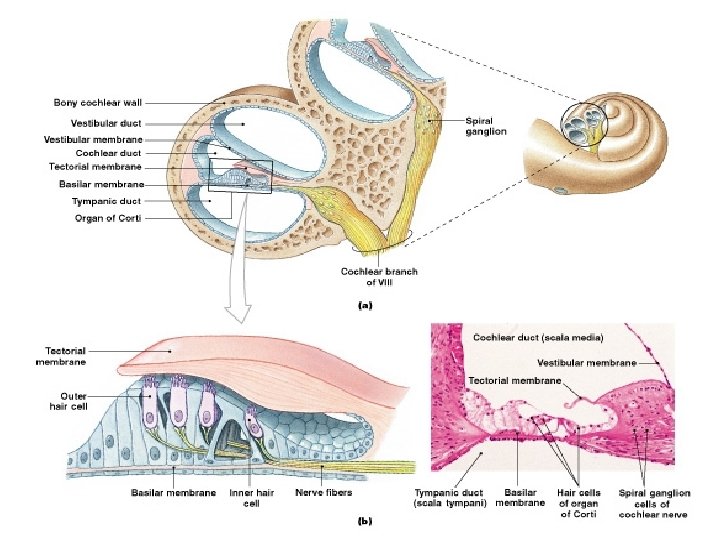
The Cochlea Figure 17– 26
Fig. 16. 20 d
Fig. 16. 21
Sound • Consists of waves of pressure through air or water
Pressure Wave Figure 17– 28
Pressure Wave • Consists of region where air molecules are crowded together • Adjacent zone where molecules are farther apart • Sine waves: – S-shaped curves
Wavelength • Distance between 2 adjacent wave troughs
Frequency • Number of waves that pass fixed reference point at given time • Physicists use term cycles instead of waves Hertz (Hz) • Number of cycles per second (cps) Pitch • Our sensory response to frequency
Amplitude Figure 17– 28
Amplitude • Intensity of sound wave • Sound energy is reported in decibels
The Power of Sounds Table 17– 1
Hearing Process • 6 basic steps Figure 17– 29
Frequency Discrimination Figure 17– 30
Hearing Range • From softest to loudest represents trillionfold increase in power • Never use full potential • Young children have greatest range
Aging Effects • Tympanic membrane gets less flexible • Articulations between ossicles stiffen • Round window may begin to ossify
Deafness • Conduction deafness – something hampers sound conduction to the fluids of the inner ear (e. g. , impacted earwax, perforated eardrum, osteosclerosis of the ossicles) • Sensorineural deafness – results from damage to the neural structures at any point from the cochlear hair cells to the auditory cortical cells
Other issues • Tinnitus – ringing or clicking sound in the ears in the absence of auditory stimuli • Meniere’s syndrome – labyrinth disorder that affects the cochlea and the semicircular canals, causing vertigo, nausea, and vomiting
Is that all? Yes, we are finally through the nervous system!