Special Astrophysical Observatory of RAS Nizhnij Arkhyz Multifrequency
")
Special Astrophysical Observatory of RAS, Nizhnij Arkhyz Multifrequency study of Gigahertz Peaked Spectrum (GPS) sources and candidates with RATAN-600 Mingaliev M. G. , Sotnikova Yu. V. , Erkenov A. K. Torniainen I. , Tornikoski M.
? spectral peak (500 MHz - 10 GHz in")
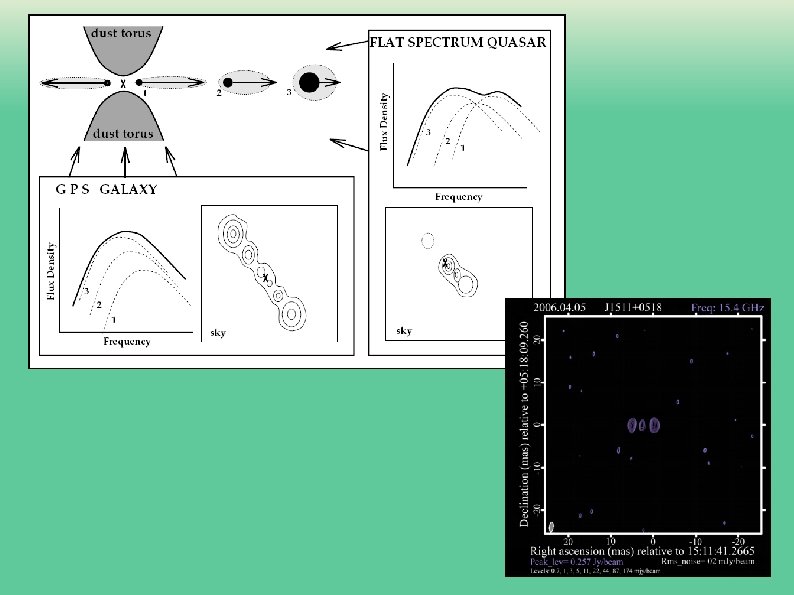
what is GPS (Gigahertz Peaked Spectrum)? spectral peak (500 MHz - 10 GHz in observer’s frame); homogeneous self-absorbed synchrotron source; powerful (log P 1. 4 ≥ 25 WHz-1); compact (≤ 1 kpc); bright radio source population (~10%); ● young radio sources (< 104 yr) [Fanti 1995; Readhead 1996; O’Dea & Baum 1997] ● dense environment [O'Dea 1991, Gopal-Krishna 1991] ● recurrent activity [Baum 1991]

why GPS? Ø contaminated GPS-sources sample Ø galaxy type 0. 1 ≤ z ≤ 1; quasar type 1 ≤ z ≤ 4 Ø different properties but similar spectrum’s shape Ø GPS quasars are considerably “contaminated” by variable sources Ø variable or not? long-term multifrequency monitoring

goals, tools, sample, observations 2006 -2010 simultaneous radio spectra variability spectral properties count of sources RATAN-600: 1. 1, 2. 3, 4. 8, 7. 7, 11. 2 and 21. 7 GHz 1) 12 observing campaigns (5 years of monitoring): 76 quasar-type and 29 galaxy-type; 17 – unidentified; total number - 122 sources 2) complete sample (1999 -2010): 75° ≤ δ ≤ 88°, S 1. 4 GHz ≥ 200 m. Jy: 4 -5 candidates

fluxes and radiospectra

fluxes and radiospectra proposed class N sources max 1 max 2 max 12 rising flat complex steep 48 10 11 1 14 19 9 10 all 122 type of spectra maximum at cm range flat plateau at low frequencies variable (≥ 25%) flattering and variable α≥ 0 0 ≥α ≥ -0. 5 two or more minimum α ≤ -0. 5

candidates in GPS only 25% candidates in GPS (using parameters of spectrum for homogeneous self-absorbed synchrotron source with a power law electron energy distribution: α 1≥ 0. 5 and α 2 ≤-0. 7 (below and above spectral peak) FWHM ≤ 1. 2 frequency decades (full width at half maximum) Var ≤ 25%
")
spectral properties The average spectral index of the optically thin part: -0. 90(0. 07) - galaxies, -0. 75 (0. 04) – quasars, -0. 7(0. 11) – unidentified the difference is about 0. 15 electron energy distribution* for GPS galaxies is steeper than for GPS quasars; index (γ) for GPS galaxies differs by 0. 3 *d. N(E) α 1 = (γ 1 - 1) /2; = k. E-γd. E α 2 = (γ 2 - 1)/2 Δα = (α 1 - α 2)= 0. 15; Δγ = 0. 3 selection effect ? ? ?
% QSO 8. 4 (± 3. 2)% G")
variability 11. 0(± 1. 4)% QSO 8. 4 (± 3. 2)% G

QSO, z=2. 37 G, z=0. 08 QSO, z=0. 68 QSO, z=1. 13, var = 70%

QSO, z= 1. 45, c n, c
 there are sufficiently few sources with narrow spectra narrowest")
width of the spectra (FWHM) there are sufficiently few sources with narrow spectra narrowest reasonable spectrum, assuming homogeneous self-absorbed synchrotron source with a power law electron energy distribution = 0. 77 (+0. 8) using observational data FWHM = 1. 2 Is the lack of sources with narrower spectra a real effect? …

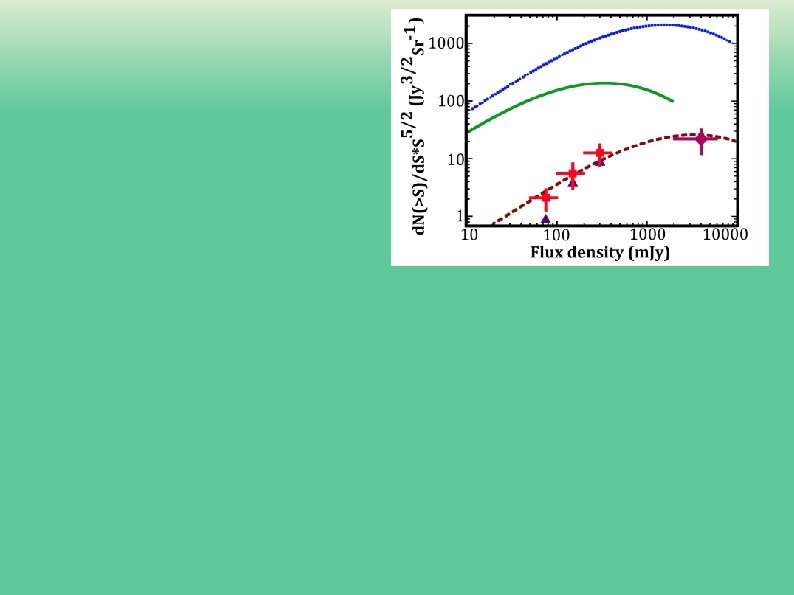
statistics 4 -5 candidates selected; 3 of them for the first time (S 1. 4 GHz ≥ 200 m. Jy, Dec 75º - 88º) The percentage of sources 0. 8 Jy at 1. 4 GHz – 450 (AGNs) with identical and 0. 8 Jy at 4 GHz – 225 increasing spectra is about 10% sources, 0. 2 sterad 25% at the studied flux level. [(225/10)*0. 2]=4. 5 sources This means that GPS sources are about 40% of the total number of AGNs or about 10% of all bright sources [0. 25*0. 4=0. 1].

conclusions The 5 -year monitoring of 122 GPS source and candidates revealed a small number of such sources - 25% of the initial sample. Only about 45% of candidates to GPSs remained as early as in the first RATAN-600 observational set (2006). Averaged instantaneous spectra at several epochs were obtained at frequencies 1. 1, 2. 3, 4. 8, 7. 7, 11. 2 and 21. 7 GHz The shape of the spectra remained clearly convex for only a fraction of sources of the sample. Most of the sources are variable flat-spectrum sources with inverted spectral shape only during flares (most of them - quasars). According to various study the genuine quasar-type GPS sources seem to be very rare. Spectral properties of galaxies and quasars differ: in optically thin part the average spectral index of galaxies is less than for quasars (~0. 15 ? ? ? ). There is a correlation between the high-frequency variability index and the high-frequency spectral index (99. 5%). There are sufficiently few sources with narrower spectra in our sample (25%). Studying spectral properties of complete sample in the polar region 4 -5 candidates to GPSs were selected (full sample of objects of this class in this area); 3 of them are considered as GPSs for the first time.

Thank you for attention!
 spectral index variability")
G QSO only 20% QSO α 2= -0. 75 (0. 04) spectral index variability 50% G α 2= -0. 90(0. 07) FWHM 25% of the sample 50% galaxies and 20% quasars (from the sample)
- Slides: 18