
Spearmans rho Chisquare 2 PSYA 4 Research Methods












- Slides: 46
Spearman’s rho Chi-square (χ2) PSYA 4 Research Methods
Learning Objective �To understand how to use Spearman’s rho and Chi-Square (χ2) tests for significance. Success Criteria Work in pairs or threes to conduct the two tests above. 2. Recall reasons for choosing these tests. 1.
Inferential Tests �Inferential tests are very important to psychologists. �They allow the psychologists to test whether a correlation or a difference between a set of results is significant. �In the exam you will not have to calculate the inferential tests. But you may be asked to justify why an inferential test is used, whether the result is significant, to sketch a graph of results, or identify co-variables, (to name just a few). �In today’s lesson we will look at the first two tests: �Spearman’s rho
EXAM TIP! �You will need to know how to choose statistical tests – but don’t panic…you do not need to actually work out the statistics! �The tests you will be soon be familiar with are: Spearman’s rho Chi-square (χ2) Mann-Whitney U Wilcoxon T
Levels of Measurement �Before you can work out the significance of a set of data, you need to know what type of data you have. �Over the next few slides you will look back at levels of measurement that you learnt in AS. Draw an image in your booklets of each data type.
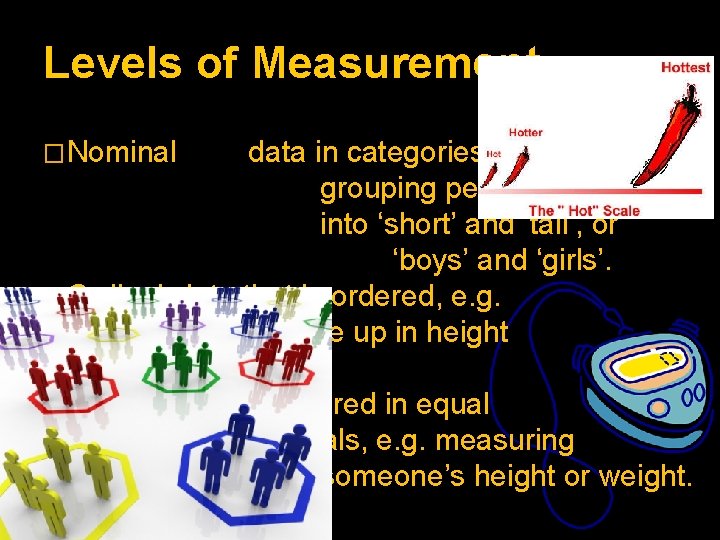
Levels of Measurement �Nominal data in categories, e. g. grouping people in class into ‘short’ and ‘tall’, or ‘boys’ and ‘girls’. �Ordinal data that is ordered, e. g. lining people up in height order. �Interval data measured in equal intervals, e. g. measuring someone’s height or weight.
Spearman’s rho
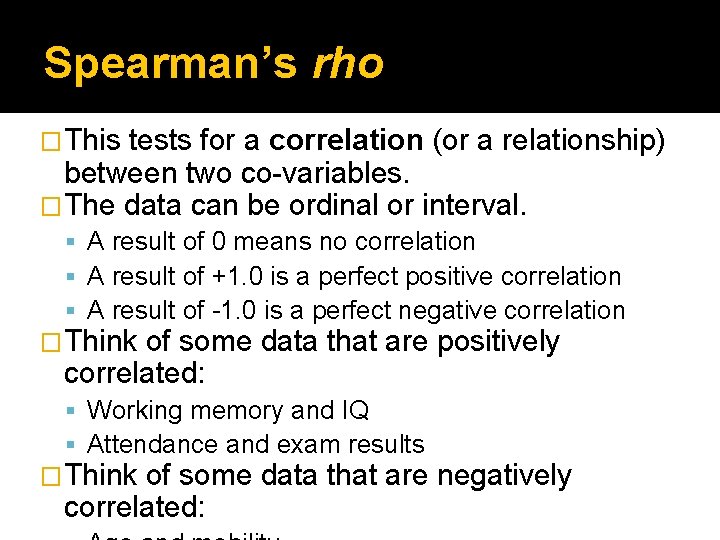
Spearman’s rho �This tests for a correlation (or a relationship) between two co-variables. �The data can be ordinal or interval. A result of 0 means no correlation A result of +1. 0 is a perfect positive correlation A result of -1. 0 is a perfect negative correlation �Think of some data that are positively correlated: Working memory and IQ Attendance and exam results �Think of some data that are negatively correlated:
Spearman’s rho �Step 1. Write a null hypothesis and an alternative hypothesis. �Step 2. Record the data, rank each covariable, and calculate the difference. �Step 3. Find the observed value of rho (correlation coefficient). �Step 4. Find the critical value of rho. �Step 5. State the conclusion.
Spearman’s rho �Step 1. Alternative hypothesis = there will be a positive correlation between the attractiveness of married couples. Null hypothesis = there will be no correlation between the attractiveness of married couples.
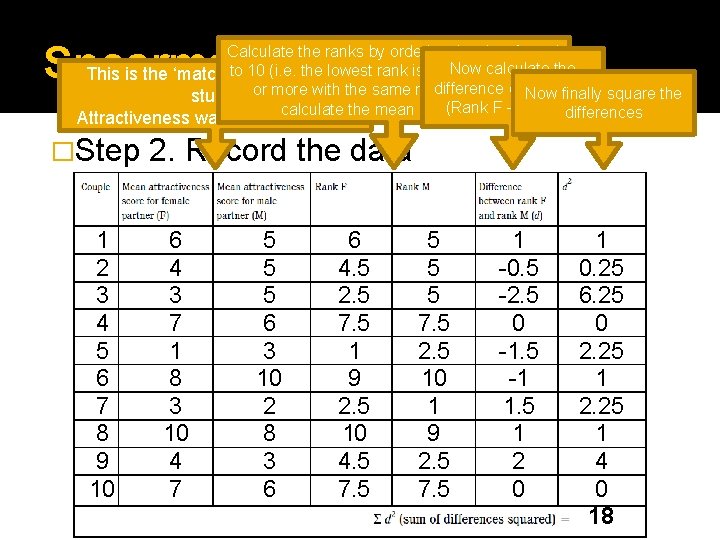
Spearman’s rho Calculate the ranks by ordering the data from 1 calculate to 10 (i. e. the lowest rank is 1). Now If there are twothe This is the ‘matching hypothesis’ difference the ranks then of you Now finally square the study. or more with the same number (Rank F – Rank M) calculate the mean of the ranks. differences Attractiveness was rated out of 10. �Step 1 2 3 4 5 6 7 8 9 10 2. Record the data 6 4 3 7 1 8 3 10 4 7 5 5 5 6 3 10 2 8 3 6 6 4. 5 2. 5 7. 5 1 9 2. 5 10 4. 5 7. 5 2. 5 10 1 9 2. 5 7. 5 1 -0. 5 -2. 5 0 -1. 5 -1 1. 5 1 2 0 1 0. 25 6. 25 0 2. 25 1 4 0 18
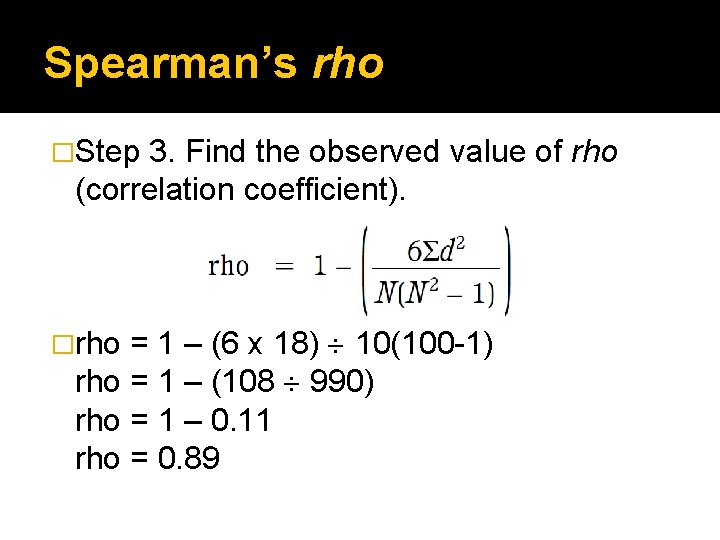
Spearman’s rho �Step 3. Find the observed value of rho (correlation coefficient). = 1 – (6 x 18) 10(100 -1) rho = 1 – (108 990) rho = 1 – 0. 11 rho = 0. 89 �rho
Pause!
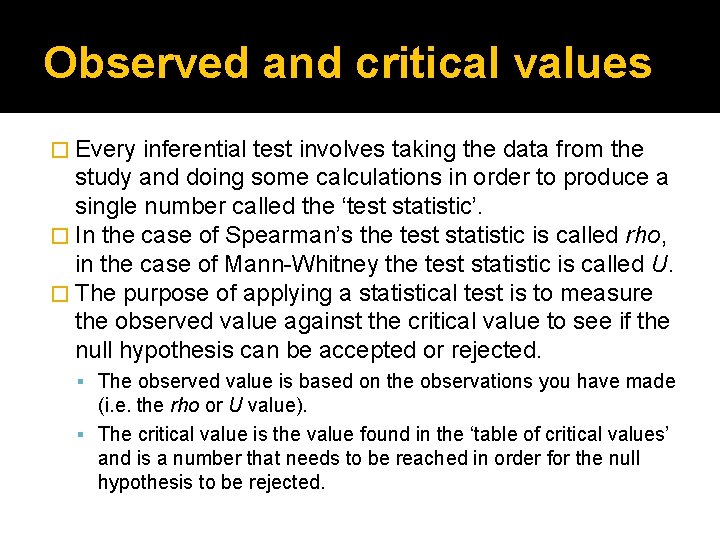
Observed and critical values � Every inferential test involves taking the data from the study and doing some calculations in order to produce a single number called the ‘test statistic’. � In the case of Spearman’s the test statistic is called rho, in the case of Mann-Whitney the test statistic is called U. � The purpose of applying a statistical test is to measure the observed value against the critical value to see if the null hypothesis can be accepted or rejected. The observed value is based on the observations you have made (i. e. the rho or U value). The critical value is the value found in the ‘table of critical values’ and is a number that needs to be reached in order for the null hypothesis to be rejected.
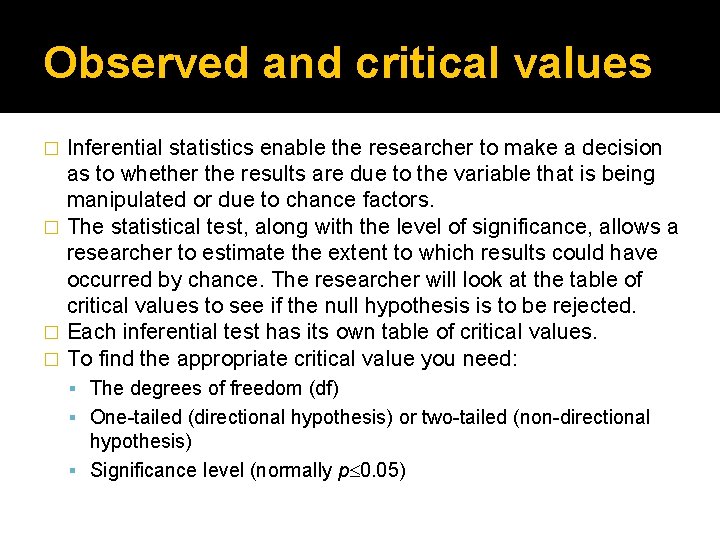
Observed and critical values Inferential statistics enable the researcher to make a decision as to whether the results are due to the variable that is being manipulated or due to chance factors. � The statistical test, along with the level of significance, allows a researcher to estimate the extent to which results could have occurred by chance. The researcher will look at the table of critical values to see if the null hypothesis is to be rejected. � Each inferential test has its own table of critical values. � To find the appropriate critical value you need: � The degrees of freedom (df) One-tailed (directional hypothesis) or two-tailed (non-directional hypothesis) Significance level (normally p 0. 05)
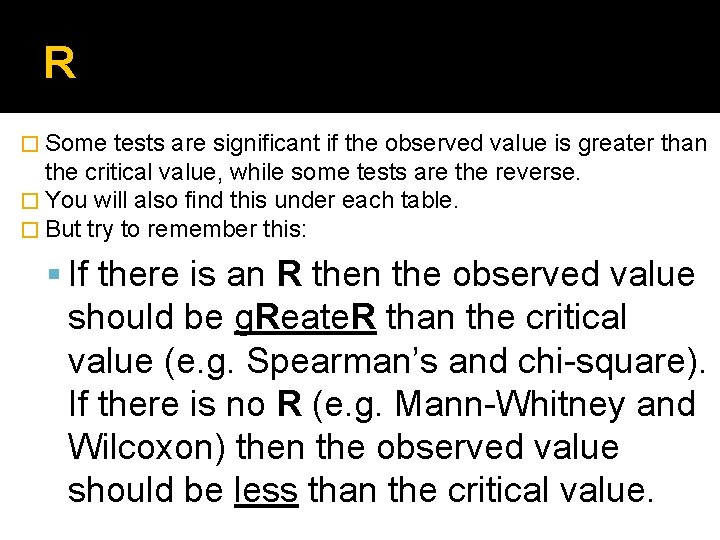
R � Some tests are significant if the observed value is greater than the critical value, while some tests are the reverse. � You will also find this under each table. � But try to remember this: If there is an R then the observed value should be g. Reate. R than the critical value (e. g. Spearman’s and chi-square). If there is no R (e. g. Mann-Whitney and Wilcoxon) then the observed value should be less than the critical value.
Spearman’s rho �Step 4. Find the critical value of rho. You need to know the value of N Whether the hypothesis is directional or non- directional �Step Is the result significant? 5. State the conclusion The observed value (0. 89) is greater than the critical value (0. 564) we can reject the null hypothesis (at p≤ 0. 05) and conclude that there is a positive correlation between
Chi squared
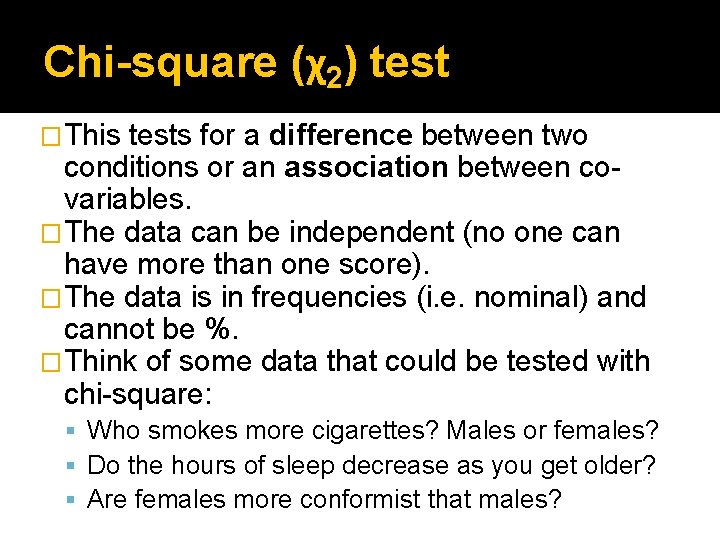
Chi-square (χ2) test �This tests for a difference between two conditions or an association between covariables. �The data can be independent (no one can have more than one score). �The data is in frequencies (i. e. nominal) and cannot be %. �Think of some data that could be tested with chi-square: Who smokes more cigarettes? Males or females? Do the hours of sleep decrease as you get older? Are females more conformist that males?
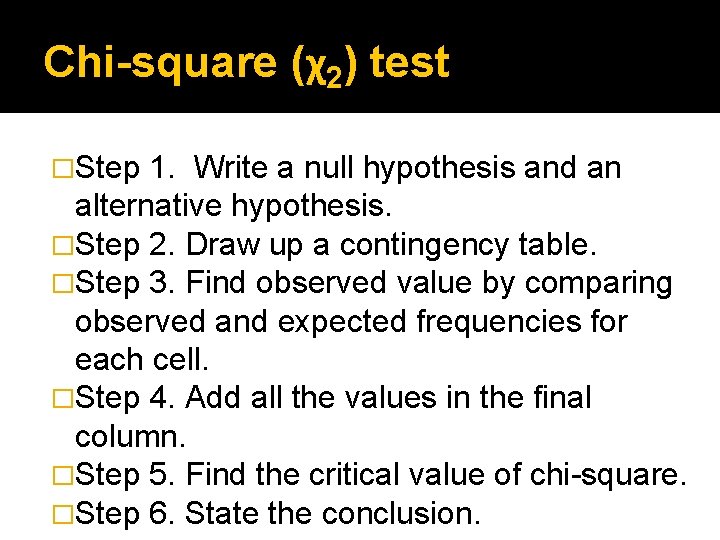
Chi-square (χ2) test �Step 1. Write a null hypothesis and an alternative hypothesis. �Step 2. Draw up a contingency table. �Step 3. Find observed value by comparing observed and expected frequencies for each cell. �Step 4. Add all the values in the final column. �Step 5. Find the critical value of chi-square. �Step 6. State the conclusion.
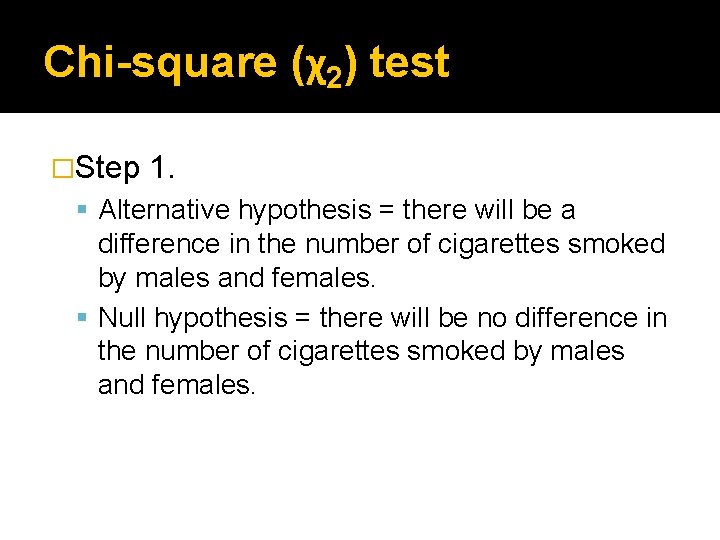
Chi-square (χ2) test �Step 1. Alternative hypothesis = there will be a difference in the number of cigarettes smoked by males and females. Null hypothesis = there will be no difference in the number of cigarettes smoked by males and females.
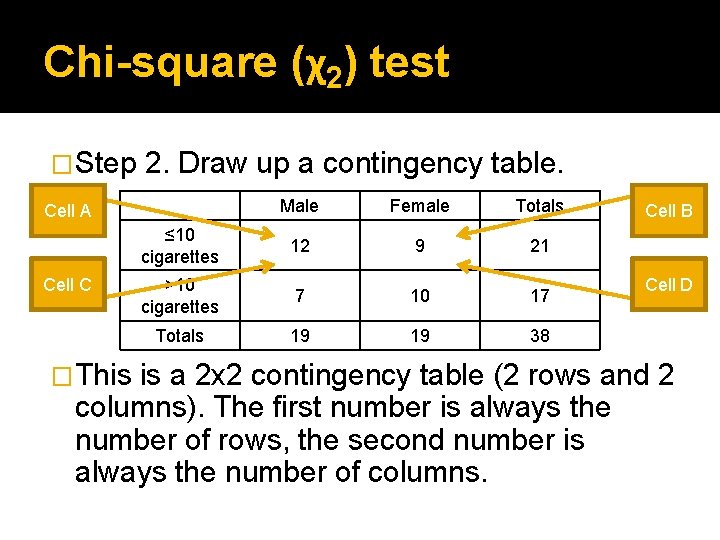
Chi-square (χ2) test �Step 2. Draw up a contingency table. Male Female Totals ≤ 10 cigarettes 12 9 21 >10 cigarettes 7 10 17 Totals 19 19 38 Cell A Cell C �This Cell B Cell D is a 2 x 2 contingency table (2 rows and 2 columns). The first number is always the number of rows, the second number is always the number of columns.
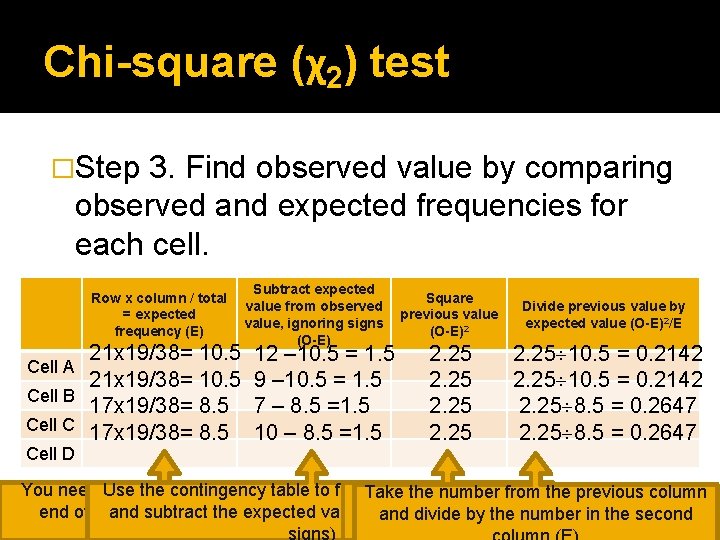
Chi-square (χ2) test �Step 3. Find observed value by comparing observed and expected frequencies for each cell. Row x column / total = expected frequency (E) 21 x 19/38= 10. 5 Cell B 17 x 19/38= 8. 5 Cell C 17 x 19/38= 8. 5 Cell A Cell D Subtract expected value from observed value, ignoring signs (O-E) 12 – 10. 5 = 1. 5 9 – 10. 5 = 1. 5 7 – 8. 5 =1. 5 10 – 8. 5 =1. 5 Square previous value (O-E)2 2. 25 Divide previous value by expected value (O-E)2/E 2. 25 10. 5 = 0. 2142 2. 25 8. 5 = 0. 2647 You need Use to use thethe contingency numbers attable the to find Take the observed value the number from the previous column 2 end of the and rows subtract and columns the expected to value(O-E) from (ignore (O-E) = any (O-E) andxitdivide by the number in the second calculate ‘E’ signs)
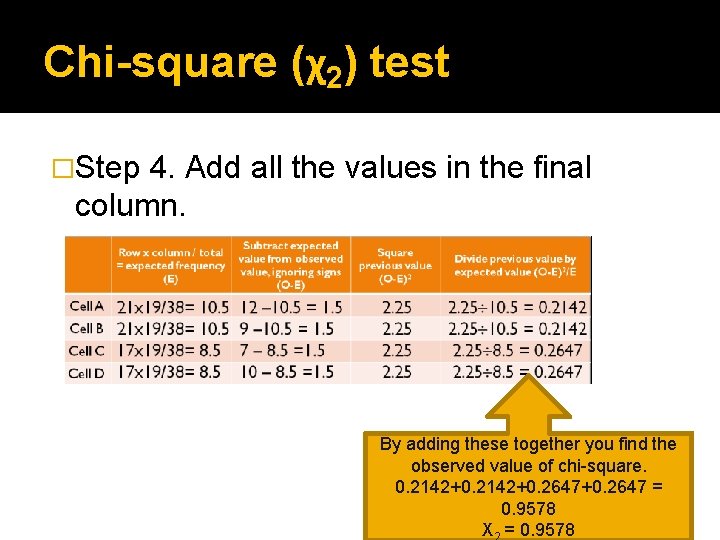
Chi-square (χ2) test �Step 4. Add all the values in the final column. By adding these together you find the observed value of chi-square. 0. 2142+0. 2647+0. 2647 = 0. 9578 Χ = 0. 9578
Pause!
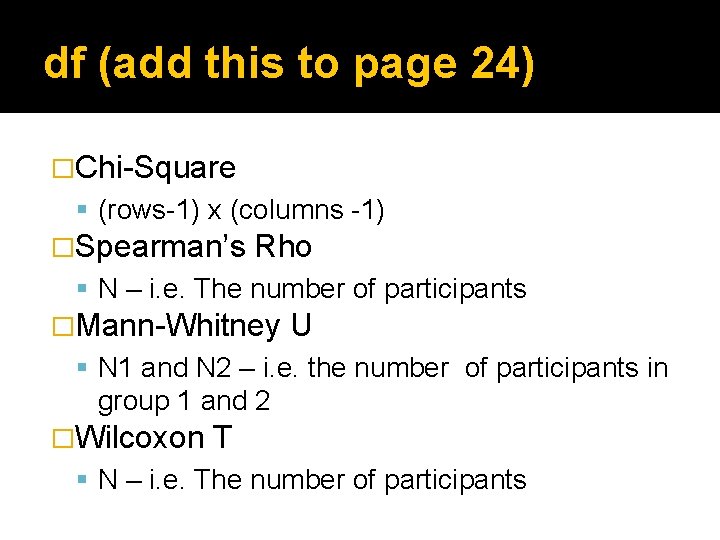
df (add this to page 24) �Chi-Square (rows-1) x (columns -1) �Spearman’s Rho N – i. e. The number of participants �Mann-Whitney U N 1 and N 2 – i. e. the number of participants in group 1 and 2 �Wilcoxon T N – i. e. The number of participants
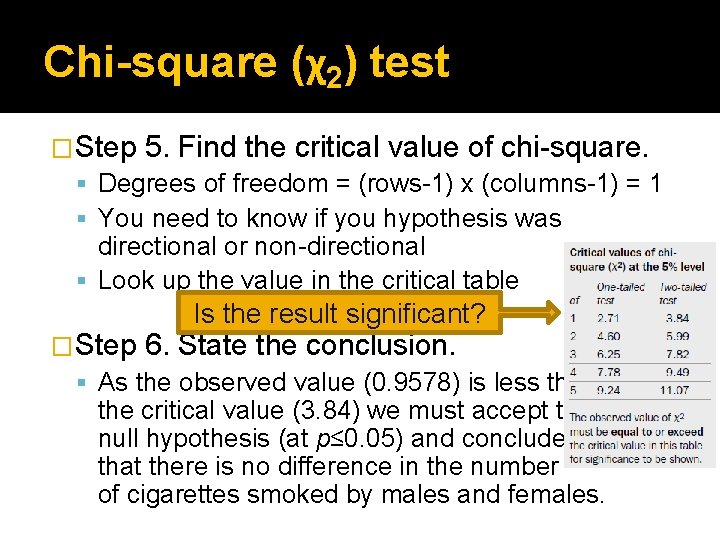
Chi-square (χ2) test �Step 5. Find the critical value of chi-square. Degrees of freedom = (rows-1) x (columns-1) = 1 You need to know if you hypothesis was directional or non-directional Look up the value in the critical table Is the result significant? �Step 6. State the conclusion. As the observed value (0. 9578) is less than the critical value (3. 84) we must accept the null hypothesis (at p≤ 0. 05) and conclude that there is no difference in the number of cigarettes smoked by males and females.
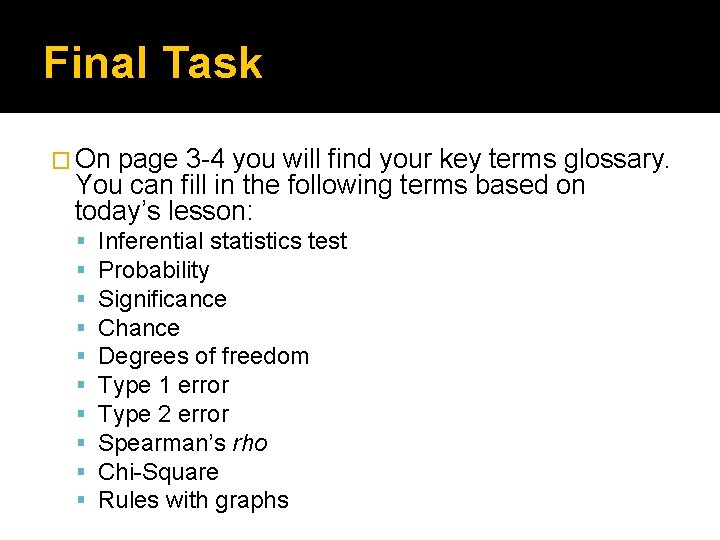
Final Task � On page 3 -4 you will find your key terms glossary. You can fill in the following terms based on today’s lesson: Inferential statistics test Probability Significance Chance Degrees of freedom Type 1 error Type 2 error Spearman’s rho Chi-Square Rules with graphs
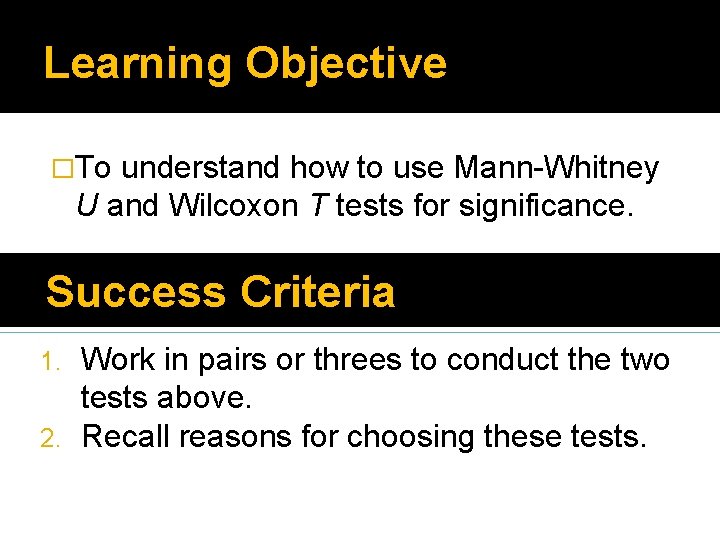
Learning Objective �To understand how to use Mann-Whitney U and Wilcoxon T tests for significance. Success Criteria Work in pairs or threes to conduct the two tests above. 2. Recall reasons for choosing these tests. 1.
Starter 1. When would you use a Spearman’s rho test? Test of a correlation To test a relationship between 2 co- variables At least ordinal data 2. When would you use a chi-square test? Test of a difference Nominal data (i. e. frequencies not %) Data is independent
Mann-Whitney U � This test is used to predict a difference between two sets of data. � The two sets of data are from separate groups or participants (independent groups). � The data can be ordinal or interval. � Think of some data that could be tested with Mann -Whitney: Testing two groups of participants to see if it is better to revise with or without music.
Mann-Whitney � Step 1. Write a null hypothesis and an alternative hypothesis. � Step 2. Record the data in a table and allocate points. � Step 3. Find the observed value of U. � Step 4. Find the critical value of U. � Step 5. State the conclusion.
Mann-Whitney �Step 1. Alternative hypothesis = students can revise more effectively in a quiet room, and get a higher score on a test, than those participants listening to an i. Pod. Null hypothesis = there will be no difference in the test scores of participants after revising in a quiet room or while listening to an i. Pod.
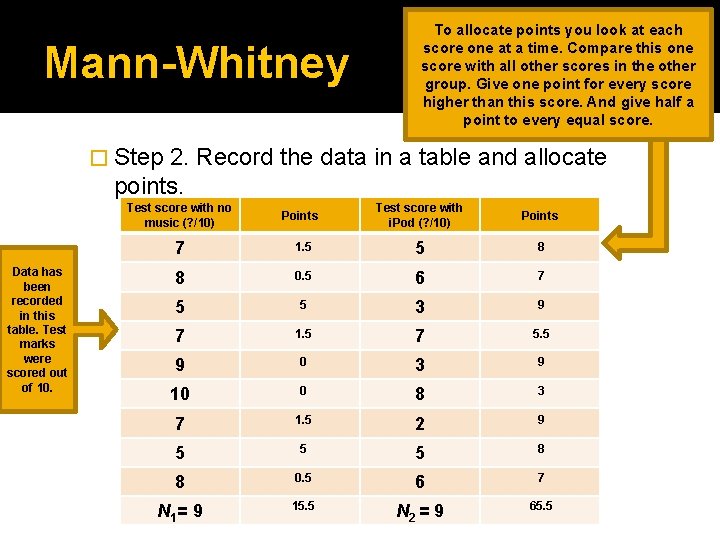
Mann-Whitney To allocate points you look at each score one at a time. Compare this one score with all other scores in the other group. Give one point for every score higher than this score. And give half a point to every equal score. � Step 2. Record the data in a table and allocate points. Data has been recorded in this table. Test marks were scored out of 10. Test score with no music (? /10) Points Test score with i. Pod (? /10) Points 7 1. 5 5 8 8 0. 5 6 7 5 5 3 9 7 1. 5 7 5. 5 9 0 3 9 10 0 8 3 7 1. 5 2 9 5 5 5 8 8 0. 5 6 7 N 1 = 9 15. 5 N 2 = 9 65. 5
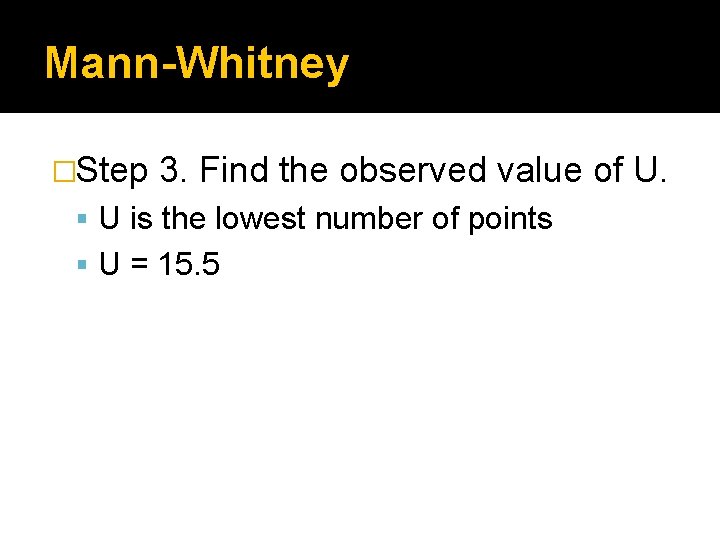
Mann-Whitney �Step 3. Find the observed value of U. U is the lowest number of points U = 15. 5
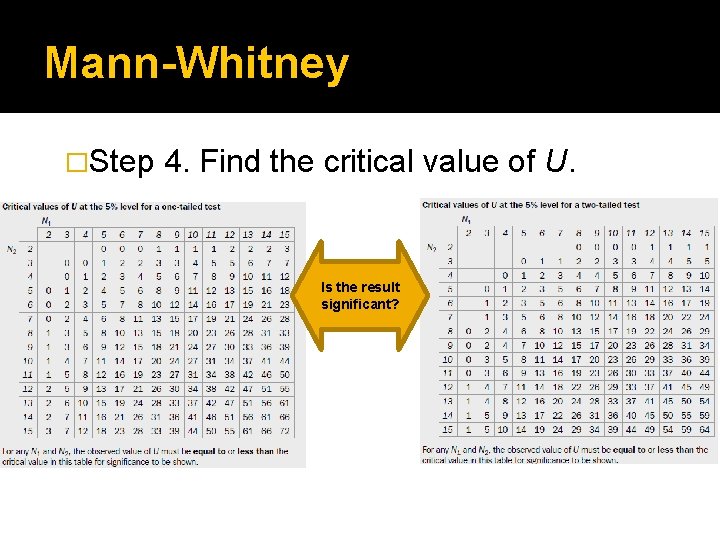
Mann-Whitney �Step 4. Find the critical value of U. Is the result significant?
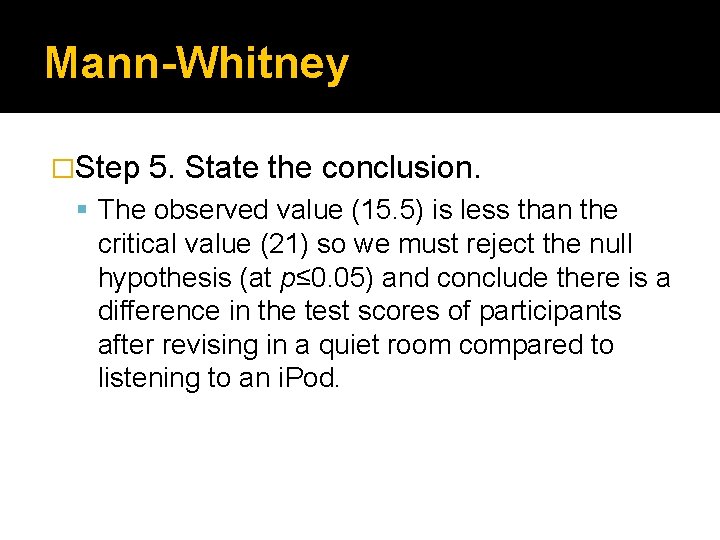
Mann-Whitney �Step 5. State the conclusion. The observed value (15. 5) is less than the critical value (21) so we must reject the null hypothesis (at p≤ 0. 05) and conclude there is a difference in the test scores of participants after revising in a quiet room compared to listening to an i. Pod.
Wilcoxon T
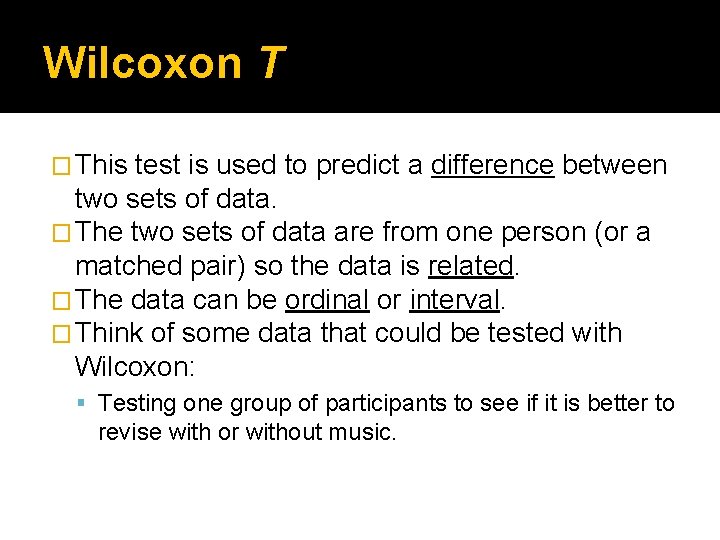
Wilcoxon T � This test is used to predict a difference between two sets of data. � The two sets of data are from one person (or a matched pair) so the data is related. � The data can be ordinal or interval. � Think of some data that could be tested with Wilcoxon: Testing one group of participants to see if it is better to revise with or without music.
Wilcoxon T � Step 1. Write a null hypothesis and an alternative hypothesis. � Step 2. Record the data, calculate the difference between scores and rank. � Step 3. Find the observed value of T. � Step 4. Find the critical value of T. � Step 5. State the conclusion.
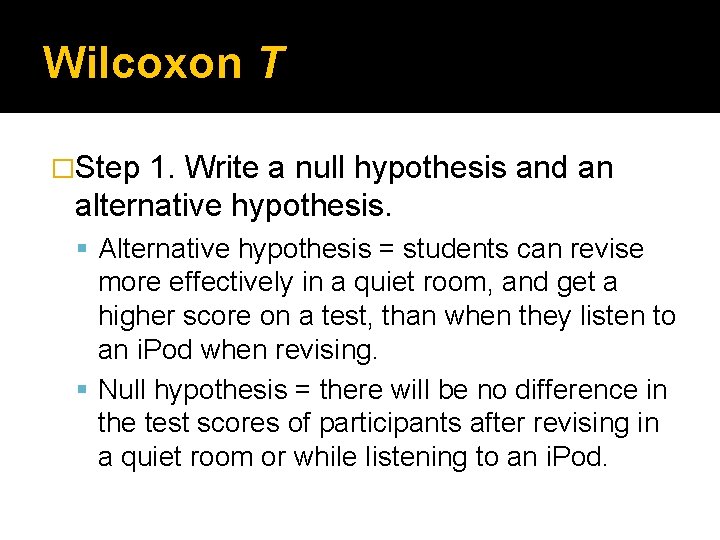
Wilcoxon T �Step 1. Write a null hypothesis and an alternative hypothesis. Alternative hypothesis = students can revise more effectively in a quiet room, and get a higher score on a test, than when they listen to an i. Pod when revising. Null hypothesis = there will be no difference in the test scores of participants after revising in a quiet room or while listening to an i. Pod.
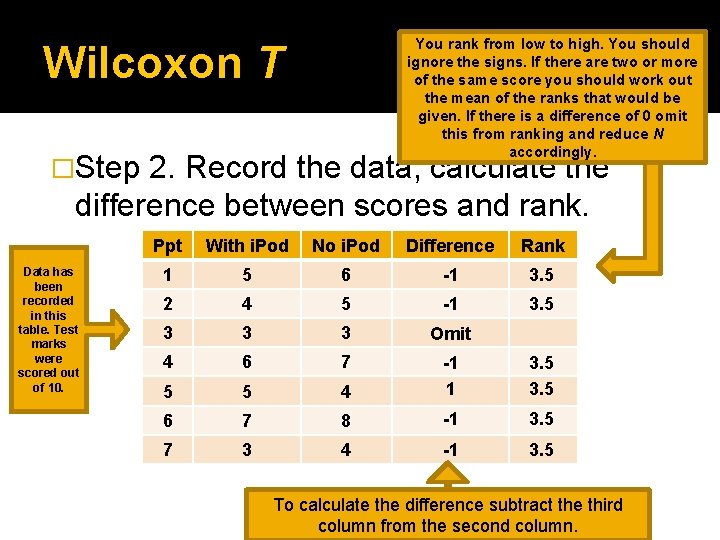
You rank from low to high. You should ignore the signs. If there are two or more of the same score you should work out the mean of the ranks that would be given. If there is a difference of 0 omit this from ranking and reduce N accordingly. Wilcoxon T �Step 2. Record the data, calculate the difference between scores and rank. Data has been recorded in this table. Test marks were scored out of 10. Ppt With i. Pod No i. Pod Difference Rank 1 5 6 -1 3. 5 2 4 5 -1 3. 5 3 3 3 Omit 4 6 7 5 5 4 -1 1 3. 5 6 7 8 -1 3. 5 7 3 4 -1 3. 5 To calculate the difference subtract the third column from the second column.
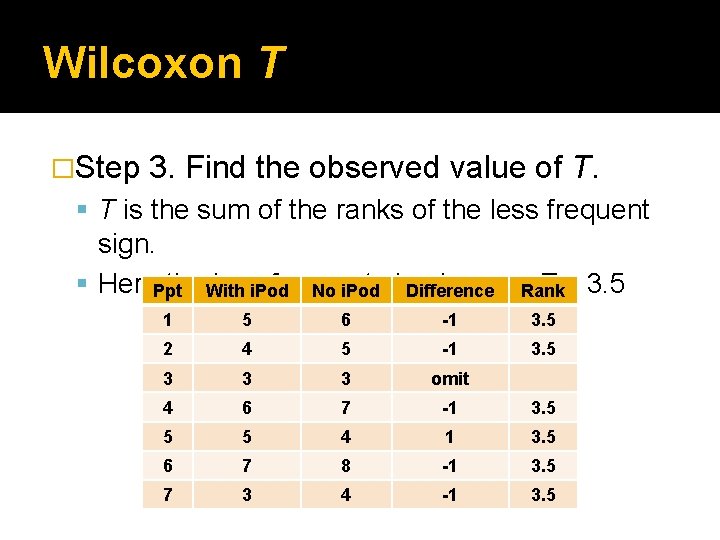
Wilcoxon T �Step 3. Find the observed value of T. T is the sum of the ranks of the less frequent sign. Here. Ppt the. With lessi. Pod frequent is +, so. Rank T = 3. 5 No i. Pod sign Difference 1 5 6 -1 3. 5 2 4 5 -1 3. 5 3 3 3 omit 4 6 7 -1 3. 5 5 5 4 1 3. 5 6 7 8 -1 3. 5 7 3 4 -1 3. 5
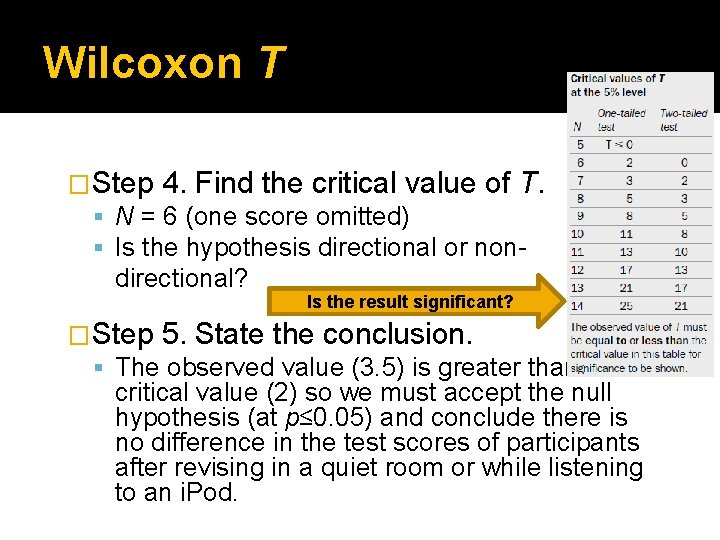
Wilcoxon T �Step 4. Find the critical value of T. N = 6 (one score omitted) Is the hypothesis directional or non- directional? Is the result significant? �Step 5. State the conclusion. The observed value (3. 5) is greater than the critical value (2) so we must accept the null hypothesis (at p≤ 0. 05) and conclude there is no difference in the test scores of participants after revising in a quiet room or while listening to an i. Pod.
Final Tasks Fill in the key terms for today’s lesson 1. Mann-Whitney U Wilcoxon T Highlight the grid on page 25 and annotate the flowchart. You will need to memorise the chart. 3. Create a poster, mindmap, flowchart or revision grid on page 31 to help you remember the 4 tests. 4. Complete the practice questions on page 30. 2.
Homework �Revise pages 23 -31 for a test. �Remember what you were told at the start of last lesson: You will never be asked to carry out a statistical test. You could be asked to look up observed values in a table of critical values. You can be asked to define key terms. You could be asked if a value is significant or not.