Spatiotemporal Analysis of Rapidly Evolving Coastal Topography using


- Slides: 36

Spatio-temporal Analysis of Rapidly Evolving Coastal Topography using Open Source GRASS GIS Helena Mitasova Department of Marine, Earth and Atmospheric Sciences, NCSU, Raleigh, T. Drake, MEAS NCSU, R. Harmon, US Army Res. Office, J. Mc. Ninch Virginia Inst. of Marine Science, D. Bernstein CMWS, Coastal Carolina Univ. , C. Freeman, UNC-CH http: //www. skagit. meas. ncsu. edu/~helena

Goal Explore the possibilities to gain new insight into short-term coastal topography evolution by combining modern mapping technologies with Open source GRASS GIS and provide methodology and valuable information for coastal management. Study areas - Jockey's Ridge sand dune migration - Bald Head Island pre and post-nourishment beach evolution - Bogue Island

Mapping technologies Beach topography: Real Time Kinematic GPS Nearshore bathymetry: multibeam and conventional sonar Coastal topography: LIDAR USGS/NOAA ATM 1996 -2000 USACE FRF, Duck, NC www. csc. noaa. gov/crs/tcm/about_ldart. html

Modern digital coastal data and GIS Challenges : � massive data sets, oversampling, � noisy data and complex surfaces � anisotropy and heterogeneous coverage � almost all data are spatio-temporal Robust and flexible gridding technique is crucial: tunable spatial approximation such as RST (Regularized Spline with Smoothing and Tension) H. Mitasova

Jockey’s Ridge evolution Combining 98 IR-DOQQ, 99 LIDAR and 02 RTK GPS to assess the change: decreasing elevation, migration C Height Year: m 1950: 43 1974: 34 1995: 27 1999: 26 2002: 24 A B N H. Mitasova

Jockey’s Ridge Migration location main dune peak main dune crest A main dune crest B south dune peak south dune crest south dune fence C south dune fence D east dune near peak east dune crest horizontal change 98 -99 99 -02 vertical change elevation 99 -02 99 02 NA 10 7. 6 - 44. 7 18. 4 21. 4 - -2. 1 +3. 9 +4. 0 -3. 0 +4. 7 +1. 7 +2. 8 -1. 7 16. 2 25. 0 +3. 0 25. 7 23. 6 14. 3 18. 2 6. 5 10. 8 7. 8 1. 4 6. 1 3. 6 5. 3 7. 2 10. 0 15. 3 13. 6 1. 7 3. 7 direction S S SW SW H. Mitasova

Dune crests movement based on 1998(IR-DOQQ) - 1999(LIDAR) - 2002(RTKGPS) A: South dune B: East dune Horizontal movement: 40 m W Horizontal movement: 40 m SW Change in elevation: -2 m D: Central section 40 m remains to reach road! C: Main ridge Horizontal movement: no crest Horizontal movement: 40 m SW Change in elevation: + 3 m Change in elevation: - 2. 6 m! 25. 9 –> 23. 3 m

Jockey’s Ridge 2000 - 2002 A 2000 2002 Minigolf castle

Bald Head Island v r. R ea e. F ap C Human impact on evolution of shore topography and nearshore bathymetry: channel deepening, nourishment Natural forces: hurricanes LIDAR 1997 -2000 RTK GPS 2001 -02 elevation [m] Single beam sonar 2000, 2002 Multibeam sonar 2001 Integrated 10 m resolution model from multiple sources

Off-shore mound: interferometric sonar Original gridded data: 1. 3 x 1. 3 km 2 m res. model interpolated by RST 65 m swaths, 10 -20 m gaps change: elev. : -0. 5 m April 2001 slope: -3 deg Jan. 2002 volume: +8400 m 3 Original gridded data 250 x 300 Overlayed 0. 5 m res surfaces More results at skagit. meas. ncsu. edu/~helena/measwork/mound. html

Bald Head Island shore change Historical change ~ 1850 - 1962 after Cleary et al. 1989 Recent change 1998: LIDAR 0 m 2000: LIDAR 0 m 800 m 2001 Dec. : RTK GPS after nourishment Shoreline rotates around pivot area

South Beach evolution 1997 -2000 Overlayed 1997 and 2000 LIDAR surfaces: central section is relatively stable, rest erodes while changing its shape West convex -> concave Center 2000 z>0 m z<0 m stable pivot area stable East concave -> convex

Beach slope change 1997 -2000

Slope and curvature change Severely eroding area approximated analyzed by RST 1998 Slope 2000 Profile curvature concave convex

South Beach change: 1997 -2000 Elevation change 1997 -2000 Volume change: m m 3 loss: 376, 000 gain: 30, 000 m 3 loss gain detail draped over 1997 surface acceleration detail draped over 1997 surface Second order change 1997 -1998 -2000 H. Mitasova

RTK GPS 2001 -2001 RTK GPS data are oversampled in the direction of the vehicle movement. Anisotropic interpolation is needed when distance between profiles is significantly greater than resolution. RST : default parameters RST with anisotropic tension Impact on volume change estimate: 120000 m 3/160000 m 3 H. Mitasova

Pre-nourishment 2000 LIDAR 2000 H. Mitasova

Change after nourishment LIDAR 00 + RTK GPS Dec. 01 H. Mitasova

Change after nourishment LIDAR 00 + RTK GPS May 02 H. Mitasova

Change after nourishment LIDAR 00 + RTK GPS Sep. 02

Change after nourishment LIDAR 00 + RTK GPS Dec 02

Change after nourishment: profiles LIDAR 2000 RTKS: Dec. 2001 May 2002 September 2002

Change after nourishment LIDAR 2000 September 2002 December 2002

Moved volumes after nourishment Sep. 2002 - Dec. 2001 RTK GPS Aug. 2000 – Fall 1997 LIDAR Sep. 2002 -Aug. 2000 RTK GPS - LIDAR H. Mitasova

Moved volumes South Beach Cape Fear H. Mitasova

Cape Fear evolution LIDAR: 1997 1998 RTK GPS: Dec 2001 May 2002 1999, grey is 2000 Sep 2002

Cape Fear elevation change LIDAR 1997 -2000 RTK GPS Dec. 2001 2000 -Dec. 2001 Dec. 2002 Dec. 2001 -Dec. 2002

Zalewski: June 2001 Bernstein December 2002

Bogue Island collaboration with Chris Freeman and Dave Bernstein Slope Profile curvature Sand bars

Bogue Island : May - August 2002 change

Conclusions I Combination of modern mapping techniques with Open source GIS provides unique insight into 3 D coastal topography evolution at high spatial and temporal resolution. GIS based analysis and visualization allows us to quantify the observed changes (elevation, shoreline, volume, slope and shape) and evaluate effectiveness of stabilization measures. The developed methodology is being further enhanced and applied to other areas. H. Mitasova

Conclusions II Jockey's Ridge: LIDAR and RTK GPS data confirmed that Jockey’s Ridge is flattening and GIS analysis allowed us to quantify the dune migration and identify the critical areas Future Continue monitoring, LIDAR (ATM or EAARL) would help to assess the impact of fences. Modeling? Compare with historical elevation and land use data: collaboration with Dr. Overton. 3 D subsurface data? Museum exhibition: evolution of Jockey's Ridge, explain why it is not the largest dune anymore H. Mitasova

Conclusions III Bald Head Island Analysis based on LIDAR and RTK GPS data showed systematic, spatially variable erosion of the beach accompanied with beach shape change. After renourishment the rates increased in the west section and more beach become more stable in the east. Future Analysis of the entire area as a single system: - bathymetry (fate of eroded sand: back to channel, CF shoal, sandbars ? ) - new LIDAR survey - modeling (DELFT 3 D? MIKE? ) H. Mitasova

Acknowledgment: This project is funded by the NRC/ARO fellowship. In addition to observations acquired by co-authors, data from NOAA-USGS (LDART), USACE FRF Duck NC (FRF web site) and UNC Wilmigton (Anders et al. 1990, Clearly et al. 1989) were used. 1997 12/2001 1998 1999 2000 05/2002 09/2002 1997 -2002 Cape Fear change 1997 - 2002 H. Mitasova

Open source GIS: GRASS grass. itc. it General purpose GIS for raster, vector, site and image data processing Links to other OS projects: Map. Server, GSTATS Developed at US Army CERL (1982 -1995). General Public Licence (GPL) in 1999 : free to run, modify, distribute, and release (but it cannot be improved and released as a proprietary system)

Regularized Spline with Tension RST (Mitasova and Mitas 1993): implemented in GRASS to support spatial approximation. Simulates behavior of flexible plate forced to pass close to the data points. Properties: - 2 D, 3 D and 4 D implementation, - flexible properties through tension and smoothing, - simultaneous computation of slope, aspect, curvatures, - segmented processing for large data sets -formally equivalent to universal kriging (covariance function determined by smoothness seminorm
 Spatiotemporal data mining
 Evolving design
 A framework for clustering evolving data streams
 Key evolving signature
 Evolving
 Bipolar analysis of coastal defences
 To beat rapidly and make light and airy
 Which compounds solubility decreases most rapidly
 Which rock weathers most rapidly when exposed to acid rain?
 Plyometrics involves moving a weight as rapidly as possible
 Which of the following gases will effuse the most rapidly
 When air rapidly expands its temperature normally
 Whats a compound sentence
 15:4 observing standard precautions
 To cook by the vapor produced from boiling water
 Extracapillary
 Corporations developed rapidly in the 1830s
 What process occurs
 Active phagocytes that increase rapidly acute infection
 Utopia dystopia vocabulary
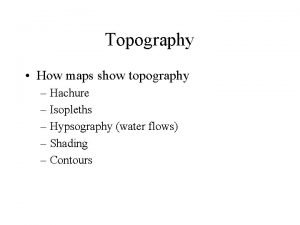
 Section topography
 Topography associated with igneous rocks
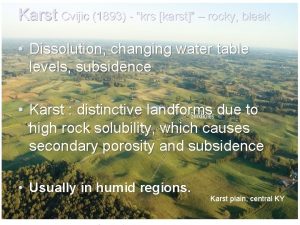
 Karst topography
 Canyon ocean
 Shaping within topography example
 Karst window
 Ainkholes
 Karst topography
 Orbscan topography
 India topography
 Shaping aba cooper
 Lesson 1 physical geography of eastern europe
 Topography of jerusalem
 Hepar topography
 Leg
Leg Calgary topography
 Midwest topography


