Spatial Models and Modeling May 18 2016 Institute


- Slides: 31
Spatial Models and Modeling` May 18, 2016 Institute of Space Technology, Karachi
�Chapter 13: Spatial Models and Modeling
Model �Description of reality �Static reproduction that represents basic shape and form of an object �A conceptual description of key elements and processes in a system �Sophisticated replica of objects, events, or processes �For this class �Restricted to computer-based models of spatial features
Computer Based Spatial Models �Combination of �GIS �Computer programming languages �Spatial and non-spatial analytical tools
Two Broad Classes �Spatio-temporal Models �Dynamic in both space and time �Example: analysis of oil after spill �Cartographic Models �Static models �Involve application of spatial operations �Example: buffer, interpolation, reclassification, overly �Combine data from multiple data layers
Cartographic Models �Represent spatial features at a fixed point or points of time �Most GIS models are cartographic models that are temporally static �Provides information through a combination of spatial data sets, functions and operations �Reclassification �Overlay �Interpolation �Terrain analysis �Buffering, �Map algebra, etc.
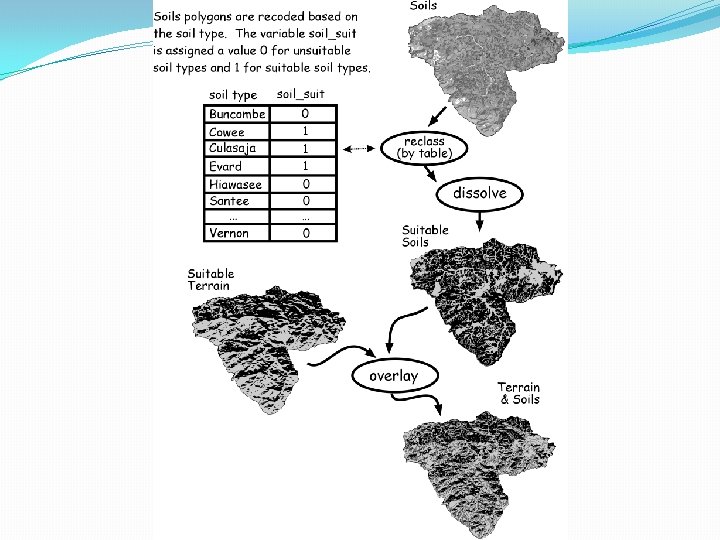
Example: Suitability Analysis � Suitable park sites based on the proximity to Roads and Lakes and the absence of Wetlands
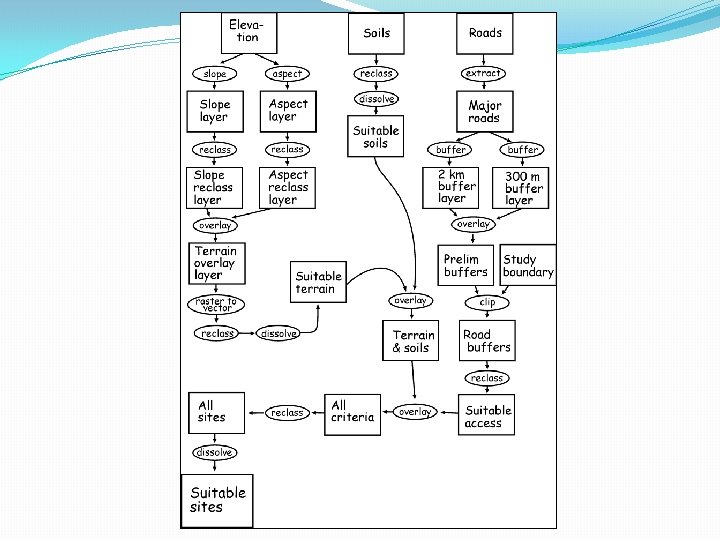
Flow Chart �A graphic representation of the spatial data, operations and their sequence of use in a cartographic model
Application �Site selection �Land use planning �Transportation route and corridor studies �Design and development of water distribution systems �Human disease spread �Pollution response planning �Endangered species preservation
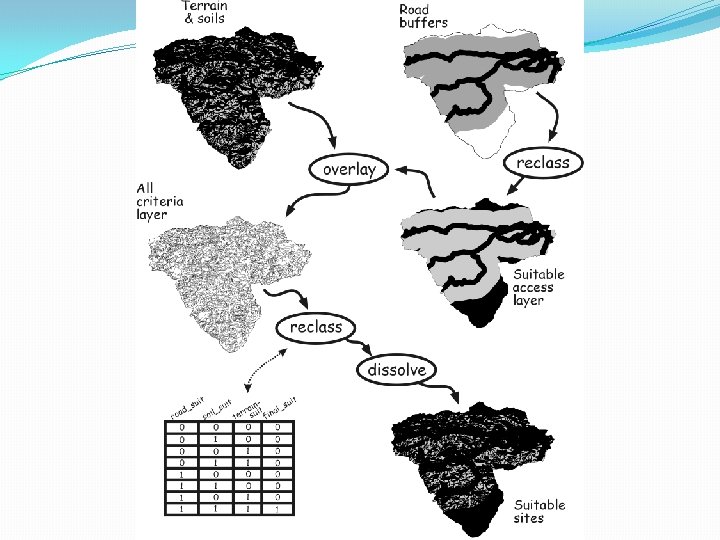
Designing a Cartographic Model �Spatial functions and operations are mixed and matched in cartographic models �Variation in sequence of same operations will result in entirely different outputs �With a small set of data layers and tools, a huge number of models can be created �Usually produces a large number of ‘intermediate’ or temporary data layers that are not needed in final output or decision making
Designing the BEST Cartographic Model �Selection of appropriate spatial tools and specification of their sequence
Conti. . Designing a Cartographic Model �Based on a set of criteria �These criteria are usually defined in qualitative terms �The slope must not be too steep �Interpretation /translation of criteria into selection and sequence of spatial operations �What is meant by “too steep” �Need to be converted to specific, quantitative measures
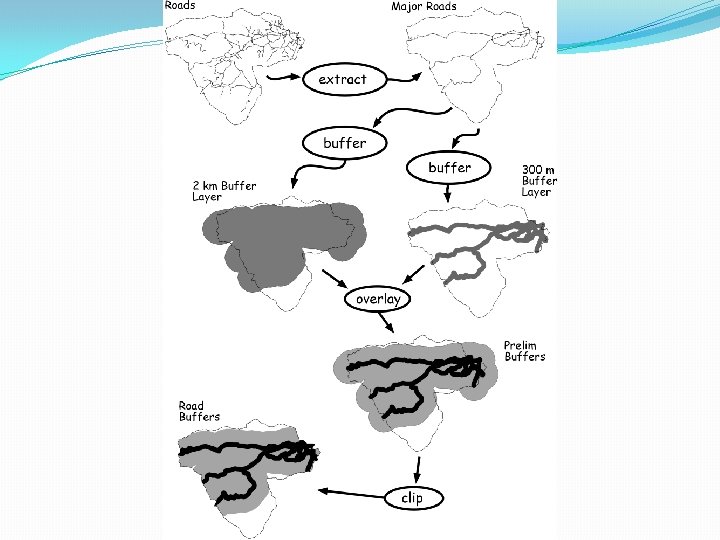
Example: Home Site Selection �Problem: Ranking sites by suitability for home construction �Criteria: �Slopes should not be too steep �Southern aspect is preferred to enhance solar warming �Soils suitable for on-site septic systems �Sites should be far enough from a main road to offer some privacy but not so far as to be isolated
�First convert these criteria into more specific quantitative terms �Check availability and quality of data � Do the required data layers exist for the study area? � Are spatial accuracies, spatial resolution and attributes appropriate for analysis � What level of map generalization? �If required data is not available � Obtain or develop the required data OR � Modify the goals �Explicit ranking of the relative importance of different classes or types of criteria
General Criteria Refined Criteria Slopes Not Too Steep Slope < 30 degrees Southern Aspect Preferred 90 < aspect < 270 Soils Suitable for Septic System Specified list of septic-suitable soil units Far enough from Road to Provide Privacy, But Not Isolated 300 meters < distance to road < 2000 meters
Ranking and Weighting �Ranking: Assignment of relative values within the same layer �How we rank a sandy soil vs. a silty soil in a soil layer �‘Weighting’ – assigning the relative values of different layers �How we weight the values in an elevation layer vs. the values in a land use layer
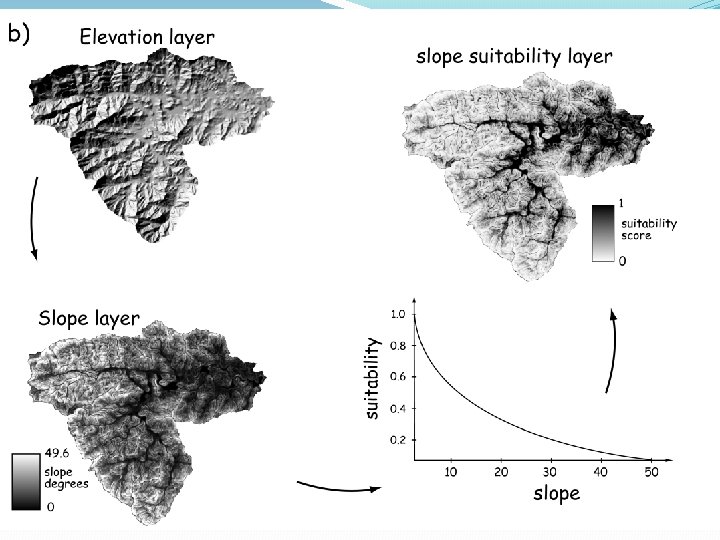
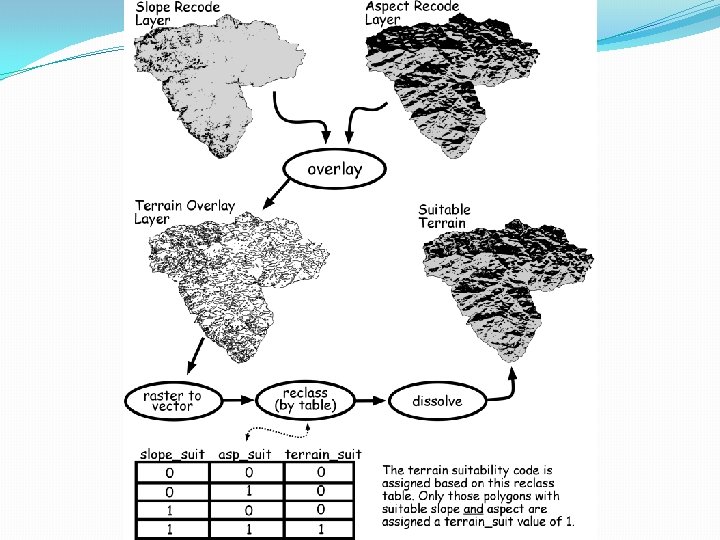
Ranking Within Criteria �Each Criterion in cartographic model is usually expressed by a data layer or ‘criterion layer’ �Each criterion layer is a spatial representation of some constraint or selection condition �Select site outside floodplain: Floodplain sites = 0, Upland sites = 1
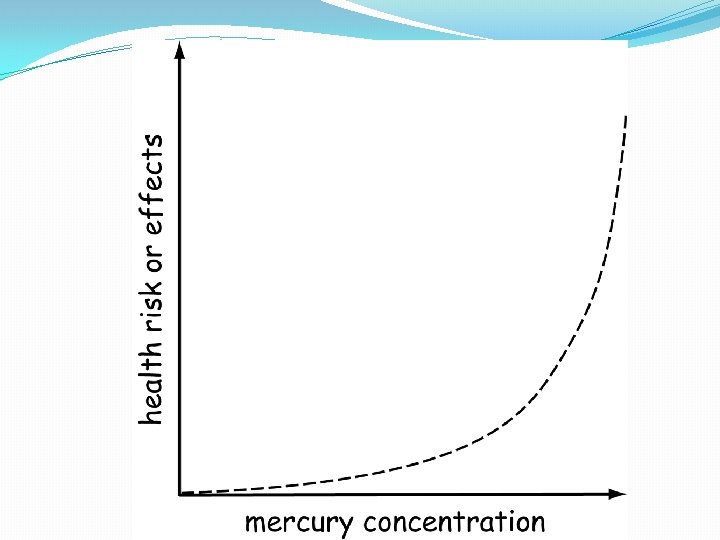
Discrete vs. Continuous Ranking �Discrete: when input data are interpreted such that criterion data layer is a map of discrete value �Soil = Good, Bad �Slope = steep or acceptable �Continuous: ranks vary along a scale �Soils: Rated from 1 to 100 for construction suitability
Discrete and Continuous ranking
Criterion: desirable sites are greater than 300 but less than 2000 meters from road
Weighting Among Criteria � Criteria combined in spatial analysis – in overlay or addition process � How to weigh one layer over another? � How important is slope relative to aspect? � Will an optimum aspect offset a moderately steep site? � The relative weightings given to each criterion will influence the result � Different weights are likely to result in different suitability rankings � Easy to define when importance of the various criteria expressed on a common scale – money � Reducing all criteria to a common scale removes differential weighting among criteria
Assigning Weights based on Importance Ranking
Low to high Elevation: black to light shade Low slope: light shades Aspect: light to dark from 0 -360 o
Spatio-temporal Models �Includes time driven processes within the framework of model �Feature boundaries, point feature locations, and attribute variables may change within model run �Complicated models