Spatial Data Management Summary Spatial data requires special


 ◦ E. g. , ESRI’s")


. ◦ Find all hotels within")
. ◦ Given a face, find the five")


 � Constructs the minimal bounding box (mbb) � Check validity")


 R 1 R 2 R 3 R 4 R 5")


 abstracts the “tree” nature of")


- Slides: 50
Spatial Data Management
Summary � Spatial data requires special data structures, similar to B-trees
Lecture outline � Types of spatial data � Example of spatial and geometric data – splines and Voronoi diagrams � One-dimensional index – interval trees � R-trees � T-tree variants
Types of Spatial Data � Point Data ◦ Points in a multidimensional space ◦ E. g. , Raster data such as satellite imagery, where each pixel stores a measured value ◦ E. g. , Feature vectors extracted from text � Region Data ◦ Objects have spatial extent with location and boundary ◦ DB typically uses geometric approximations constructed using line segments, polygons, etc. , called vector data.
Examples of GIS data � Different types of sampling are used to collect data
Splines
Examples of Voronoi regions
Terrain from splines and Voronoi diagrams
Spatial filtering
Spatial filtering � Low-pass filter – the value for the cell is computed as average of other cells � High-pass-continuous surface –low pass
Spatial filtering � Window size has effect on filtering
Smoothing of maps
Types of Spatial Queries � Spatial Range Queries ◦ Find all cities within 50 miles of Madison ◦ Query has associated region (location, boundary) ◦ Answer includes ovelapping or contained data regions � Nearest-Neighbor Queries ◦ Find the 10 cities nearest to Madison ◦ Results must be ordered by proximity � Spatial Join Queries ◦ Find all cities near a lake ◦ Expensive, join condition involves regions and proximity
Applications of Spatial Data � Geographic Information Systems (GIS) ◦ E. g. , ESRI’s Arc. Info; Open. GIS Consortium ◦ Geospatial information ◦ All classes of spatial queries and data are common � Computer-Aided Design/Manufacturing ◦ Store spatial objects such as surface of airplane fuselage ◦ Range queries and spatial join queries are common � Multimedia Databases ◦ Images, video, text, etc. stored and retrieved by content ◦ First converted to feature vector form; high dimensionality ◦ Nearest-neighbor queries are the most common
Single-Dimensional Indexes � B+ trees are fundamentally single-dimensional indexes. � When we create a composite search key B+ tree, e. g. , an index on <age, sal>, we effectively linearize the 2 dimensional space since we sort entries first by age and then by sal. Consider entries: <11, 80>, <12, 10> <12, 20>, <13, 75> 80 70 60 50 40 30 20 10 B+ tree order 11 12 13
Multidimensional Indexes �A multidimensional index clusters entries so as to exploit “nearness” in multidimensional space. � Keeping track of entries and maintaining a balanced index structure presents a challenge! Consider entries: <11, 80>, <12, 10> <12, 20>, <13, 75> 80 70 60 50 40 30 20 10 Spatial clusters 11 12 13 B+ tree order
Motivation for Multidimensional Indexes � Spatial queries (GIS, CAD). ◦ Find all hotels within a radius of 5 miles from the conference venue. ◦ Find the city with population 500, 000 or more that is nearest to Kalamazoo, MI. ◦ Find all cities that lie on the Nile in Egypt. ◦ Find all parts that touch the fuselage (in a plane design). � Multidimensional range queries. ◦ 50 < age < 55 AND 80 K < sal < 90 K
Motivation � Similarity queries (content -based retrieval). ◦ Given a face, find the five most similar faces/expressions.
Interval trees � Geometric, 1 -dimensional tree � Interval is defined by (x 1, x 2) � Split at the middle (5), again at the middle (3, 7), again at the middle (2, 8) � All intervals intersecting a middle point are stored at the corresponding root. (4, 6) (4, 8) (2, 4) 1 2 3 4 5 6 7 8 9 (6, 9) (7. 5, 8. 5)
Interval trees �Finding intervals – by finding x 1, x 2 against the nodes �Find interval containing specific value – from the root �Sort intervals within each node of the tree according to their coorsinates �Cost of the “stabbing query”– finding all intervals containing the specified value is O(log n + k), where k is the number of reported intervals.
SAM (Spatial Access Method) � Constructs the minimal bounding box (mbb) � Check validity (predicate) on mbb � Refinement step verifies if actual objects satisfy the predicate.
What’s the difficulty? � An index based on spatial location needed. ◦ One-dimensional indexes don’t support multidimensional searching efficiently. ◦ Hash indexes only support point queries; want to support range queries as well. ◦ Must support inserts and deletes gracefully. � Ideally, want to support non-point data as well (e. g. , lines, shapes). � The R-tree meets these requirements, and variants are widely used today.
The R-Tree � The R-tree is a tree-structured index that remains balanced on inserts and deletes. � Each key stored in a leaf entry is intuitively a box, or collection of intervals, with one interval per dimension. � Example in 2 -D: Root of R Tree Y X Leaf level
R-Tree Properties � Leaf entry = < n-dimensional box, rid > ◦ This is Alternative (2), with key value being a box. ◦ Box is the tightest bounding box for a data object. � Non-leaf node > entry = < n-dim box, ptr to child ◦ Box covers all boxes in child node (in fact, subtree). � All leaves at same distance from root. � Nodes can be kept 50% full (except root). ◦ Can choose a parameter m that is <= 50%, and ensure that every node is at least m% full.
Example of an R-Tree Leaf entry Index entry R 1 R 4 R 3 R 8 R 9 R 10 R 11 Spatial object approximated by bounding box R 8 R 5 R 13 R 14 R 12 R 7 R 6 R 15 R 18 R 17 R 16 R 19 R 2
Example R-Tree (Contd. ) R 1 R 2 R 3 R 4 R 5 R 8 R 9 R 10 R 11 R 12 R 6 R 7 R 13 R 14 R 15 R 16 R 17 R 18 R 19
Search for Objects Overlapping Box Q Start at root. 1. If current node is non-leaf, for each entry <E, ptr>, if box E overlaps Q, search subtree identified by ptr. 2. If current node is leaf, for each entry <E, rid>, if E overlaps Q, rid identifies an object that might overlap Q. Note: May have to search several subtrees at each node! (In contrast, a B-tree equality search goes to just one leaf. )
Improving Search Using Constraints � It is convenient to store boxes in the R-tree as approximations of arbitrary regions, because boxes can be represented compactly. � But why not use convex polygons to approximate query regions more accurately? ◦ Will reduce overlap with nodes in tree, and reduce the number of nodes fetched by avoiding some branches altogether. ◦ Cost of overlap test is higher than bounding box intersection, but it is a main-memory cost, and can actually be done quite efficiently. Generally a win.
Insert Entry <B, ptr> � Start at root and go down to “best-fit” leaf L. ◦ Go to child whose box needs least enlargement to cover B; resolve ties by going to smallest area child. � If best-fit leaf L has space, insert entry and stop. Otherwise, split L into L 1 and L 2. ◦ Adjust entry for L in its parent so that the box now covers (only) L 1. ◦ Add an entry (in the parent node of L) for L 2. (This could cause the parent node to recursively split. )
Splitting a Node During Insertion � The entries in node L plus the newly inserted entry must be distributed between L 1 and L 2. � Goal is to reduce likelihood of both L 1 and L 2 being searched on subsequent queries. � Idea: Redistribute so as to minimize area of L 1 plus area of L 2. Exhaustive algorithm is too slow; quadratic and linear heuristics are popular in research. GOOD SPLIT! BAD!
R-Tree Variants � The R* tree uses the concept of forced reinserts to reduce overlap in tree nodes. When a node overflows, instead of splitting: ◦ Remove some (say, 30% of the) entries and reinsert them into the tree. ◦ Could result in all reinserted entries fitting on some existing pages, avoiding a split. R* trees also use a different heuristic, minimizing box perimeters rather than box areas during insertion. � Another variant, the R+ tree, avoids overlap by inserting an object into multiple leaves if necessary. � ◦ Searches now take a single path to a leaf, at cost of redundancy.
Gi. ST � The Generalized Search Tree (Gi. ST) abstracts the “tree” nature of a class of indexes including B+ trees and R-tree variants. ◦ Striking similarities in insert/delete/search and even concurrency control algorithms make it possible to provide “templates” for these algorithms that can be customized to obtain the many different tree index structures. ◦ B+ trees are so important (and simple enough to allow further specialization) that they are implemented specially in all DBMSs. ◦ Gi. ST provides an alternative for implementing other tree indexes.
Indexing High-Dimensional Data � Typically, high-dimensional datasets are collections of points, not regions. ◦ E. g. , Feature vectors in multimedia applications. ◦ Very sparse � Nearest neighbor queries are common. ◦ R-tree becomes worse than sequential scan for most datasets with more than a dozen dimensions. � As dimensionality increases contrast (ratio of distances between nearest and farthest points) usually decreases; “nearest neighbor” is not meaningful.
Comments on R-trees � Spatial data management has many applications, including GIS, CAD/CAM, multimedia indexing. ◦ Point and region data ◦ Overlap/containment and nearest-neighbor queries � Many approaches to indexing spatial data ◦ R-tree approach is widely used in GIS systems ◦ Other approaches include Grid Files, Quad trees, and techniques based on “space-filling” curves. ◦ For high-dimensional datasets, unless data has good “contrast”, nearest-neighbor may not be well -separated
Comments on R-Trees � Deletion consists of searching for the entry to be deleted, removing it, and if the node becomes under-full, deleting the node and then re-inserting the remaining entries. � Overall, works quite well for 2 and 3 D datasets. Several variants (notably, R+ and R* trees) have been proposed; widely used. � Can improve search performance by using a convex polygon to approximate query shape (instead of a bounding box) and testing for polygon-box intersection.
The grid � "Print Gallery, " by M. C. Escher. Curious about the blank spot in the middle of Escher’s 1956 lithograph, Hendrik Lenstra set out to learn whether the artist had encountered a mathematical problem he couldn’t solve. © 2002 Cordon Art B. V. , Baarn, Holland. All rights reserved.
The grid structure � Fixed grid: � Stored as a 2 D array, each entry contains a link to a list of points (object) stored in a grid. a, b
Page overflow � Too many points in one grid cell: Solution A –overflow (linked list) Solution B- Split the cell and increase index!
Rectangle indexing with grids � Rectangles may share different grid cells � Rectangle duplicates are stored � Grid cells are of fixed size
Grid file vs. grid �In a grid file, the index is dynamically increased in size when overflow happens. �The space is split by a vertical or a horizontal line, and then further subdivided when overflow happens! �Index is dynamically growing �Boundaries of cells of different sizes are stores, thus point and stabbing queries are easy
The quadtree � Instead tree! of using an array as an index, use � Quadtree decomposition – cells are indexed by using quaternary B-tree. � All cells are squares, not polygons. � Search in a tree is faster!
Quad-tree example First three levels of a quad tree
Image stored in a quad-tree 8 x 8 pixel picture represented in a quad tree � Project #32: PICTURE REPRESENTATION USING QUAD TREES, Mc. Gill University:
Grid file � Example of a grid file
Linear quadtree � B+ index – actual references to rectangles are stored in the leaves, saving more space+ access time � Label nodes according to Z or “pi” order
Linear quadtree � Level of detail increases as the number of quadtree decompositions increases! Decompositions have indexes of a form: 00, 01, 02, 03, 10, 11, 12, 13, 2, 300 301 , 302 , 303 , 31 , 32 , 33 ◦ Stores as Bplus tree
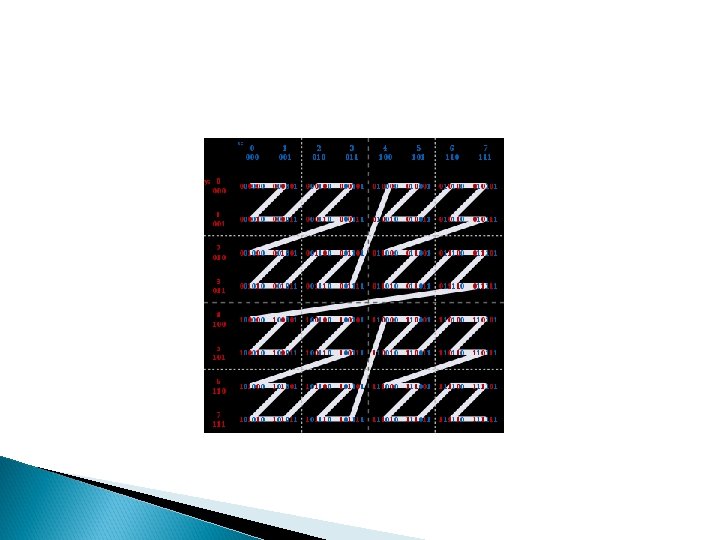
Z-order
Review questions � What is spatial data structure? � What is the difference between grid and grid file? � Explain how z or p ordering works? � Define interval trees � Provide example of R-tree � List R-tree variants � How spatial index structure differs from regular B+ tree?
Resources � Text 1 instructor’s resources � Mc. Gill University web space � Wikepedia (z order images) � Face recognition research � SPARCS lab project on image processing