SPATIAL ANALYSIS TECHNIQUE AND THEMATIC REPRESENTATION IN GIS


 Pythagorean distance, (b) Manhattan distance, (c) proximity distances and (d)")


- Slides: 25
SPATIAL ANALYSIS TECHNIQUE AND THEMATIC REPRESENTATION IN GIS DR. PRASENJIT DAS
Spatial Analysis What is it? � � One Definition: the quantitative procedures employed in the study of the spatial arrangement of features (points, lines, polygons and surfaces. “…the purpose of geographic inquiry is to examine relationships between geographic features collectively and to use the relationships to describe the real-world phenomena that map features represent. ” (Clarke 2001, 182).
� GIS systems really come into their own when they are used to analyze geographic data. The processes of geographic analysis often called spatial analysis or geo-processing uses the geographic properties of features to look for patterns and trends, and to undertake "what if" scenarios. Modern GIS have many powerful analytical tools to analyse the data.
Spatial data analysis Usually involves manipulations or calculation of coordinates or attribute variables with a various operators (tools), such as: Measurement Overlay Reclassification Buffering Network Analysis
Raster GIS measurements: (a) Pythagorean distance, (b) Manhattan distance, (c) proximity distances and (d) perimeter and area Figure 6. 1
Spatial data analysis Usually involves manipulations or calculation of coordinates or attribute variables with a various operators (tools), such as: Measurement Overlay Reclassification Buffering Network Analysis
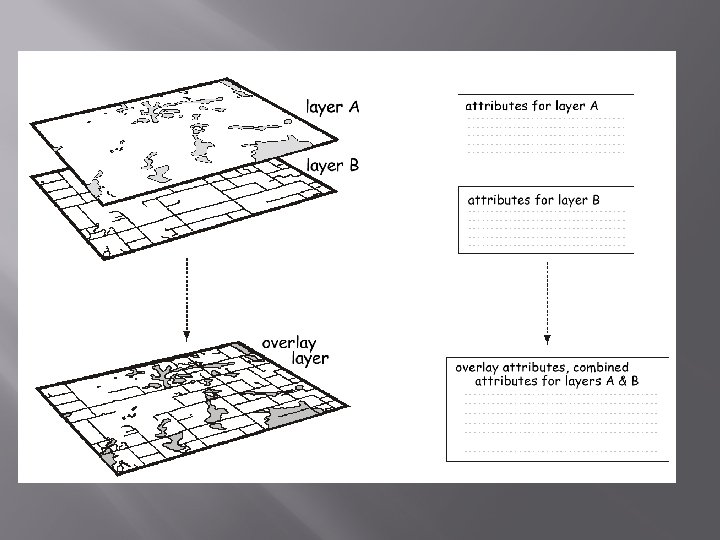
Overlay Analysis � The integration of different data layers involves a process called overlay. At its simplest, this could be a visual operation, but analytical operations require one or more data layers to be joined physically. This overlay, or spatial join, can integrate data on soils, slope, and vegetation, or land ownership. For example, data layers for soil and land use can be combined resulting in a new map which contains both soil and land use information. This will be helpful to understand the different behaviour of the situation on different parameters.
Overlay Combination of different data layers Both spatial and attribute data is combined Requires that data layers use a common coordinate system A new data layer is created
Spatial data analysis Usually involves manipulations or calculation of coordinates or attribute variables with a various operators (tools), such as: Measurement Queries & Selection Reclassification Buffering Overlay Network Analysis
Spatial data analysis: Reclassification An assignment of a class or value based on the attributes or geography of an object Example: Parcels Reclassified By size
Spatial data analysis Usually involves manipulations or calculation of coordinates or attribute variables with a various operators (tools), such as: Measurement Queries & Selection Reclassification Buffering Overlay Network Analysis
Buffering and other Proximity Functions
Spatial data analysis Usually involves manipulations or calculation of coordinates or attribute variables with a various operators (tools), such as: Measurement Overlay Reclassification Buffering Network Analysis
Service Area Closest Facility Route Arc. GIS Network Analyst Extension Solving transportation problems Location-Allocation Vehicle Routing Problem Origin-Destination Cost Matrix
Shortest Path: Drive Time or Distance
Cost Attributes - Drive Time
Geocoding - Addresses
Closest Facilities
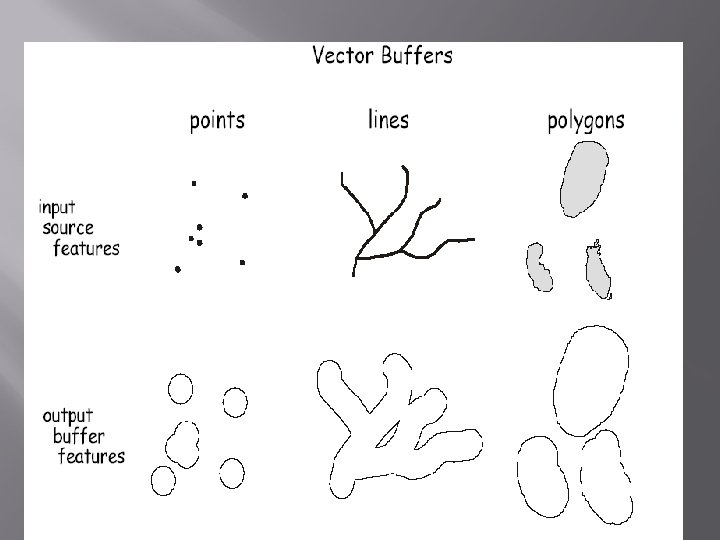
Proximity Analysis � GIS software can also support buffer generation that involves the creation of new polygons from points, lines, and polygon features stored in the database. For example, to know answer to questions like; How much area covered within 1 km of water canal? What is area covered under different crops? And, for watershed projects, where is the boundary or delineation of watershed, slope, water channels, different types water harvesting structures are required, etc.
Create a buffer: Raster
Create a Buffer: vector
Topological Overlay Relations
Visualization � GIS can provide hardcopy maps, statistical summaries, modeling solutions and graphical display of maps for both spatial and tabular data. For many types of geographic operation the end result is best visualized as a map or graph. Maps are very efficient at storing and communicating geographic information. GIS provides new and exciting tools to extend the art of visualization of output information to the users.