Sparse Representation based Biomarker Identification for Schizophrenia DATA

Sparse Representation based Biomarker Identification for Schizophrenia DATA INTEGRATION OF IMAGING AND GWAS DATA Yin Yao National Institutes of Mental Health, NIH, Bethesda, 20892, USA
 One of the most chronically disabling psychiatric illnesses. • Global")
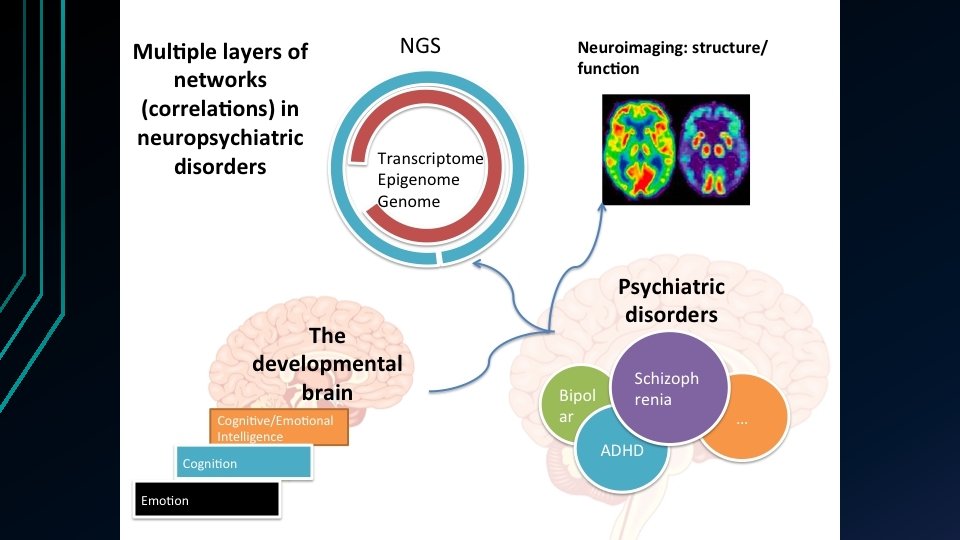
Background • Schizophrenia (SCZ) One of the most chronically disabling psychiatric illnesses. • Global median lifetime morbid risk of 7. 2/1000 persons. • Both genomic (e. g. GWAS) and brain imaging data (e. g. f. MRI) were used to explore the pathogenesis of SCZ. • • Data Integration Take advantage of complementary information. • Seek higher power to identify potential biomarkers that might be missed by using a single type of analysis. •
 has been a way to explore")
Genomic Data • A genome-wide association study (GWAS) has been a way to explore potential effects in human diseases. • GWAS typically focus on association(s) between single nucleotide polymorphisms (SNPs) and human diseases. • GWAS has been viewed as a powerful method for identifying susceptible genes for many common diseases.

Limitations of GWAS • Lack of information • single SNP has very small effect on a disease. • High rates of false-positive • Many “associated” variants are not causal, need large sample size. • Investigators typically search the entire genome for associations.

f. MRI Imaging Data: Neurological Study on Schizophrenia • Functional Magnetic Resonance Imaging (f. MRI) Task-f. MRI (tf. MRI) • Resting state f. MRI (rsf. MRI) • • Identify both structural and functional abnormalities in brain regions Locating functional differences in the frontal lobes, hippocampus and temporal lobes in brain of Schizophrenia patients

Proposed Regression Model for integrative data analysis •

Weighting factors and classification •

Cross-Validation • Varoquaux et al. , Assessing and tuning brain decoders: Cross-validation, caveats, and guidelines, Neuro. Image, Volume 145, 2017, Pages 166 -179

Weighting factors and classification •

Solve the Model: Sparse Regression Multivariate regression N Samples phenotype P Measurements P>>N Fig. Schematic diagram of a sparse regression model

SRVS ALGORITHM Sparse Representation Variable Selection

Sparse Representation Variable Selection Algorithm SRVS ALGORITHM

Finding X using SRVS Sparse Representation Variable Selection

Properties of SRVS CONVERGENCE MULTI-SCALE PROPERTY Sparse Representation Variable Selection

Application 1: GWAS data and tf. MRI data integration • Simulated GWAS Data 92 cases, 116 controls, with 759, 075 SNPs • Use SNPs as features • • tf. MRI data The sample size is the same as the GWAS data • Stimulus-on vs. stimulus-off images were collected from both cases and controls • A total of 153, 594 f. MRI voxels features available • (Cao et al. , 2014, Neuro. Image)
 from Cross validation (%) SNPs alone: 83.")
Application 1: Results • Classification ratio (CR) from Cross validation (%) SNPs alone: 83. 1 • tf. MRI voxels alone: 63. 1 • Integration features by SRVS: 89. 7 • (Cao et al. , 2014, Neuro. Image)

Application 2: GWAS data and rf. MRI data integration •

Application 2: Feature extraction using rf. MRI data •
 116 AAL brain regions; (b) using rf. MRI data")
Application 2: Results 1 (a) 116 AAL brain regions; (b) using rf. MRI data alone selected brain regions; (c) brain regions selected from integrated biomarker selection with SRVS

Application 2: Results 2 Using SNP feature alone: 301 SNP selected; CR=91. 7% Using rf. MRI feature alone: 154 f. MRI selected; CR=94. 8% Using both SNP & rf. MRI features: 195 f. MRI selected; CR=98. 9%

Application 2: Results 3 Using both SNP & rf. MRI features: 195 rf. MRI selected; CR=98. 9% Using rf. MRI feature alone: 154 rf. MRI selected; CR=94. 8% Using SNP feature alone: 301 SNP selected; CR=91. 7%

Application 2: Results 4 Using SNP feature alone: 301 SNP selected; CR=91. 7% Using rf. MRI feature alone: 154 f. MRI selected; CR=94. 8% Using both SNP & rf. MRI features: 195 f. MRI selected; CR=98. 9%

Summary • Integrating both f. MRI data and SNPs seems to point to better accuracy for SCZ diagnosis. • Both rf. MRI and tf. MRI can be integrated with SNPs. • The Sparse-Representation-Variable-Selection method is effective in selecting biomarkers when the number of variables is large and the sample size is small.

To Conclude: • We addressed the data integration problem by developing a generalized sparse model (GSM) using weighting factors (α 1 and α 2) to integrate multi-modality data for “empirical predictor” selection • More applied projects are on the way

Acknowledgement • Hong Bao Cao conducted the data analysis • Yin Yao and Yu-Ping Wang conceived the concept

Thanks! QUESTIONS?
- Slides: 27