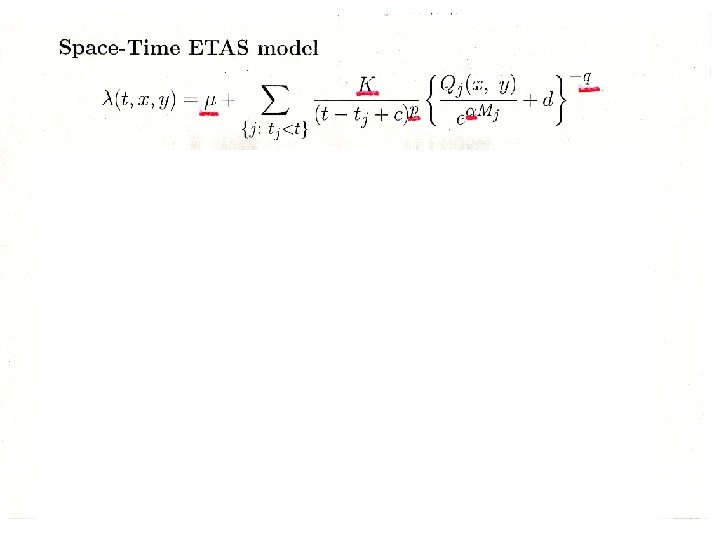
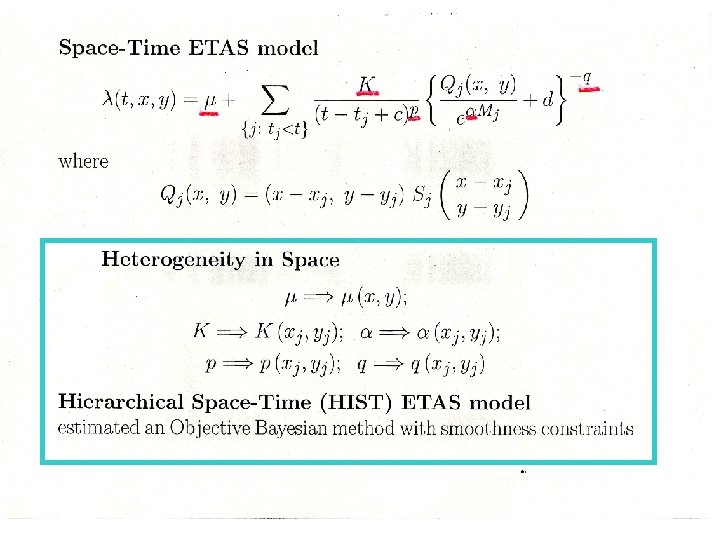
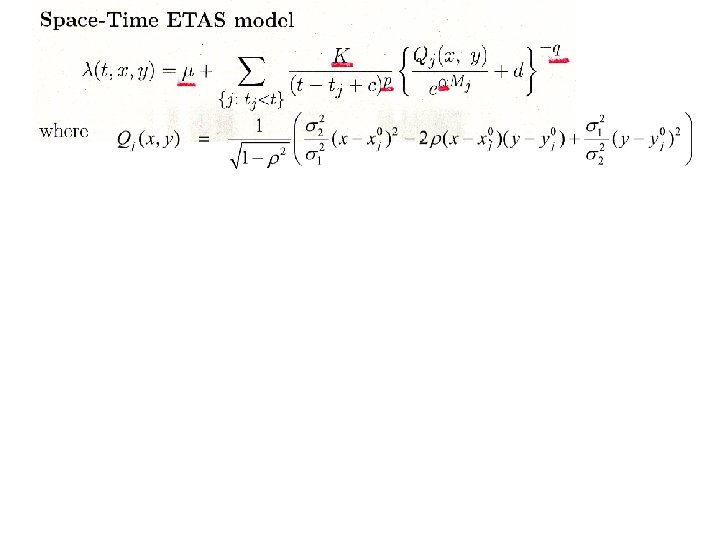
Spacetime ETAS model forecasting seismicity in and around


 r L (r ) r (r ) Choose w’s L(w),")


")
")
")


 Isotropic kernel: within 1 hour Anisotropic")


")


- Slides: 28
Space-time ETAS model forecasting seismicity in and around Japan Ogata, Yosihiko The Institute of Statistical Mathematics, Tokyo & Graduate University for Advanced Studies
for ANISOTROPY:
for ANISOTROPY:
1926 – 1995, M >= 5. 0, depth<100 km
r=( r r ) r L (r ) r (r ) Choose w’s L(w), r that maximize the L and then minimize Akaike Bayesian information criterion (Akaike, 1980)
1926 -1995 1926 -2005 Ko Ko 1926 -1995 1926 -2005 a 1926 -1995 a 1926 -2005 p p
71 Long term forecast of large earthquakes, say, M 7 class, in and around Japan
1926 -1995 m (x, y)
Estimated from M>=5. 0 For 1926 -1995 m (x, y)
= earthquakes of M>= 6. 7 occurred during 1996 - 2007 m (x, y) events / deg^2 / day Estimated from M>=5. 0 For 1926 -1995
events / deg^2 / day Earthquakes of M>= 6. 7 occurred during 1996 - 2007
events / deg^2 / day Earthquakes of M>= 6. 7 occurred during 1996 - 2007
71 Short term forecast of earthquakes, say, M 4 -6, in and around Japan
24 hours Cumulative number Magnitude >= 4. 0 Κ-values Estimated from M>=5. 0 for 1926 -1995 Elapsed time after main shock (days) Due to the JMA report.
Immediately after a large event (say, M>=5. 5) Isotropic kernel: within 1 hour Anisotropic kernel: after 1 hour
2008 5 8 M 6. 4 2008 6 14 M 7. 2 2008 5 9 M 5. 8 2008 5 8 M 7. 0 2008 9 11 M 7. 1 2008 12 20 M 6. 6 2008 7 22 M 5. 5
A cluster of immediate aftershocks of a large event within 1 hour
A cluster of immediate aftershocks of a large event within 1 hour By AIC, select the best fit from the following 4 bivariate Normal distributions for
A cluster of immediate aftershocks of a large event within 1 hour By AIC, select the best fit from the following 4 bivariate Normal distributions for are the MLE.
2008 5 8 M 6. 4 2008 6 14 M 7. 2 2008 5 9 M 5. 8 2008 5 8 M 7. 0 2008 9 11 M 7. 1 2008 12 20 M 6. 6 2008 7 22 M 5. 5
71 Magnitude frequency
78 Ogata and Katsura (1993, GJI)
JMA 2008 b-values m –values = 50% s -values m +2 s = 97. 5%
JMA 2008; frequency-linearized values b-values m –values = 50% s -values m +2 s = 97. 5%
71 Thank you very much for listening