Space Allocation Optimization at NASA Langley Research Center


 - 1,")


- Slides: 28
Space Allocation Optimization at NASA Langley Research Center Rex K. Kincaid, College of William & Mary Robert Gage, NASA Langley Research Center Raymond Gates, NASA Langley Research Center
Goals • Integrated planning system – Schedule allocation of office and technical space based on current and projected organizational and project requirements – Maintain organizational synergy by co-locating within/between related organizations – Comply with space guidelines/requirements – Plan for changes in available space due to new construction, demolition, rehab, lease – Minimize moves – Save money
Center Characteristics • • 3, 500 employees 6, 200 rooms 1, 600 labs 300 buildings
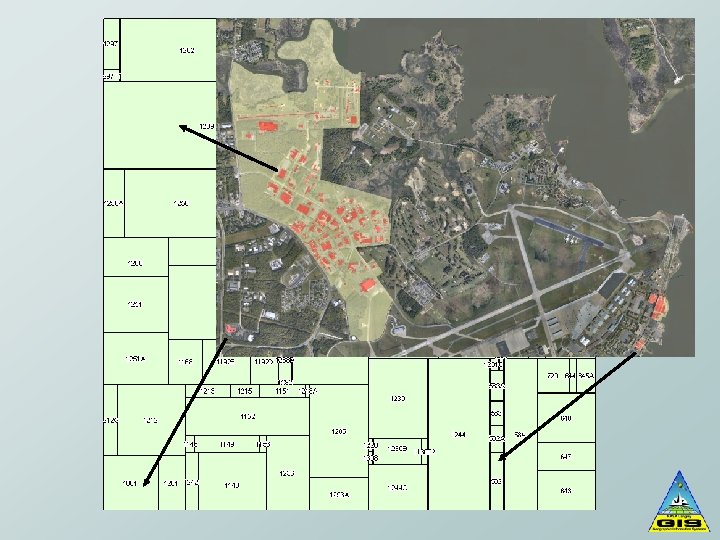
Visualization • Problems – Buildings are sparsely distributed – Disjoint E/W areas – Floors overlay – Difficult to provide a single image that conveys all the details necessary
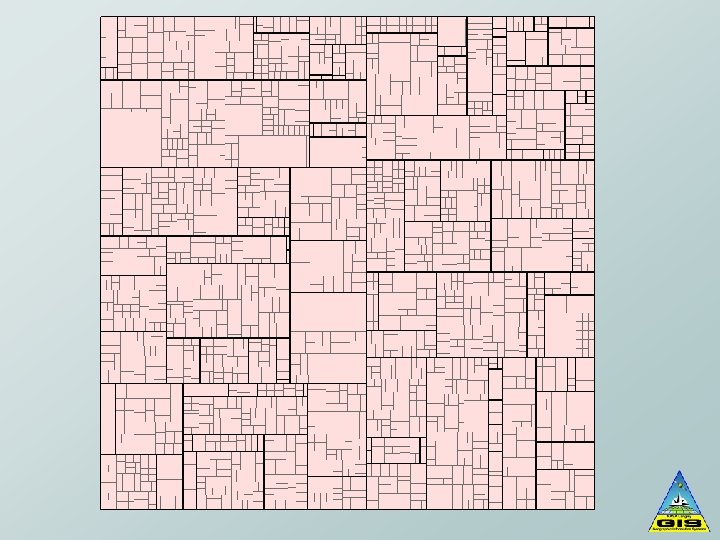
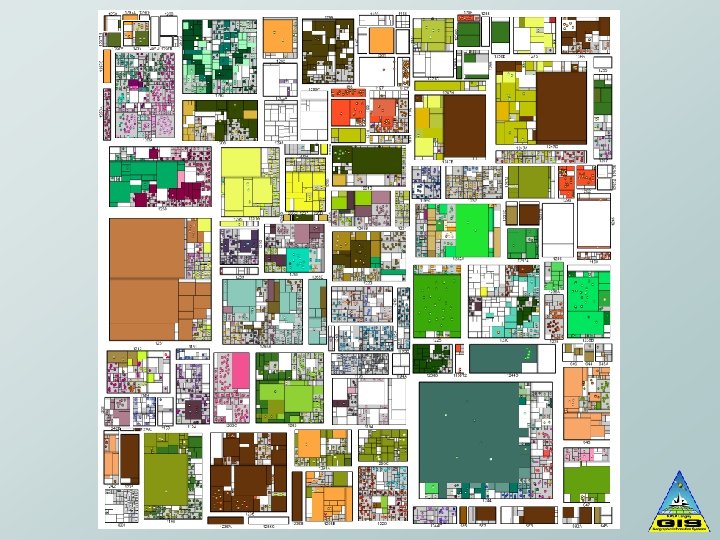
Visualization • Spatial Subdivision Diagram – Permits display of large amounts of information in a compact form – Rectangular features are proxies for the actual spatial entities such as buildings – Features are scaled relatively to represent any quantity such as gross area, office area, or capacity
System Architecture User Interface High Level Algorithmic Components Mid Level Algorithmic Components Low Level Algorithmic Components Data Analysis / Preparation Data Sources
User Interface High Level Algorithmic Components Mid Level Algorithmic Components Low Level Algorithmic Components Data Analysis / Preparation Data Sources • Existing Data Personnel Space Utilization GIS Center and Floor Plan Spatial Data • New Data Technical Space Features Technical Function Requirements
User Interface High Level Algorithmic Components Mid Level Algorithmic Components Low Level Algorithmic Components Data Analysis / Preparation Data Sources • Dynamic Inconsistent and continually changing Planned and unplanned changes Planning based on snapshots Need to be reconciled often
Monthly Move Data Histogram
Monthly Move Data Histograms
Details of Move Data Time Period A: 8 months (July 2004—February 2005) - 1, 791 total moves - 335 moves within same building Time Period B: 22 months (March 2005—December 2006) - 455 total moves - 7% of employees move each year - 13 moves within same building
User Interface High Level Algorithmic Components Mid Level Algorithmic Components Low Level Algorithmic Components Data Analysis / Preparation • Filter and Classify Input Data • Problem Domain Reduction • Examples Classify Personnel for Space Requirements Determine Pools of Compatible Space Data Sources
User Interface High Level Algorithmic Components Mid Level Algorithmic Components Low Level Algorithmic Components • Components for modeling aspects of optimization problem • Examples Space represents areas to be assigned, i. e. rooms Consumers represent any function that consumes space, i. e. people, technical functions, conference areas Data Analysis / Preparation Data Sources
User Interface High Level Algorithmic Components Mid Level Algorithmic Components • Components for modeling requirements and goals of optimization problem Constraints Minimum necessary conditions May reduce problem domain Metrics Define the measures for an optimal solution Use a cost-based minimization approach Low Level Algorithmic Components Data Analysis / Preparation Data Sources
User Interface High Level Algorithmic Components Mid Level Algorithmic Components • Examples Constraints Space Compatibility Minimal Area Requirements Consumer Compatibility Metrics Move Cost Office Area Person Synergy Low Level Algorithmic Components Data Analysis / Preparation Data Sources
System Architecture • Synergy Metric – Hierarchical, flat interaction model assumes equal interaction between peers in each organization – Reality is different – Organizations self-organize – Use current allocation to find probable interactions
User Interface High Level Algorithmic Components • Components for modeling techniques for searching problem domain • Examples Local Greedy Heuristic Random Search, Tabu Search, Simulated Annealing, Genetic Algorithms, Hybrid Techniques Mid Level Algorithmic Components Low Level Algorithmic Components Data Analysis / Preparation Data Sources
Search Techniques • Large Search Space – Exhaustive Search not possible – Find the best local optima in a limited amount of time
Search Techniques • Greedy Approach – From a random starting point, proceed in the most downhill direction – compare features of local optima • Beyond Greedy – implement simple tabu search
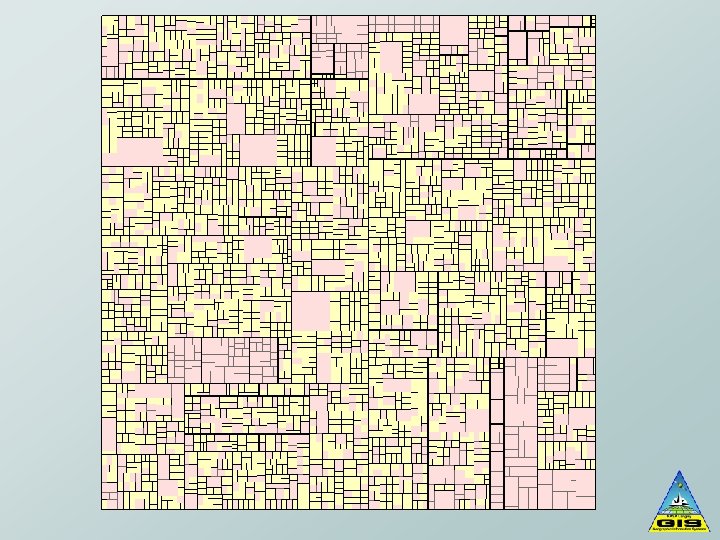
Current NASA configuration
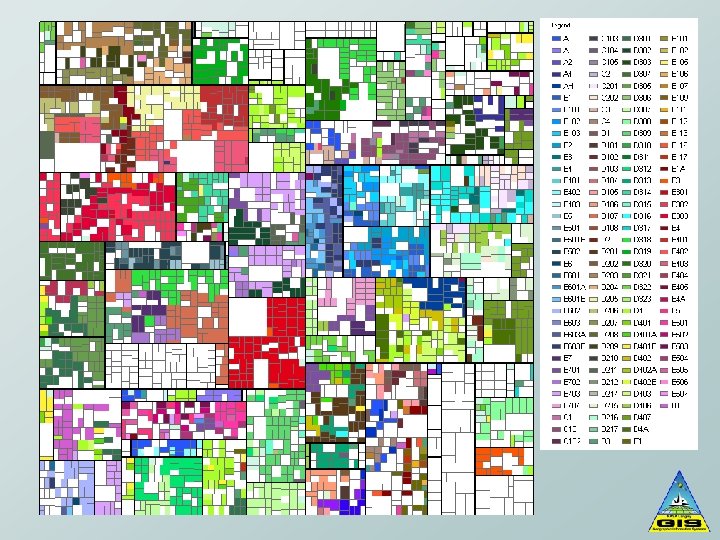
Local Optimum: NASA Space Allocation
Status • Visualization tools largely complete • Primary metrics and constraints for personnel defined and implemented • Greedy Heuristic implemented to search from any initial state to a local optimum • Continuing to tune heuristic to improve speed and adjust definition of local neighborhood with new operators
Status • Plan to extend local search by including simple tabu search features • Plan to experiment with long term memory by keeping track of high (low) quality partial solutions