Southwestern Conquistador Beer Secondary Data Measures Hypothesis Formulation

Southwestern Conquistador Beer, Secondary Data, Measures, Hypothesis Formulation, Chi-Square Market Intelligence Julie Edell Britton Session 2 August 8, 2009

Today’s Agenda § § § Announcements Southwestern Conquistador Beer Case Backward Market Research Secondary data quality Measure types Hypothesis Testing and Chi-Square

Announcements • National Insurance Case for Sat. 8/22 – Download National. sav from platform – SPSS on machines in MBA PC Lab and see installation direction on the platform on how to install on your machine – Do tutorial to familiarize with SPSS – Use handout in course pack to answer questions: 1 -6 – Stephen will do a tutorial on Friday, 8/21 from 1: 00 2: 15 in the MBA PC Lab and be available on 8/21 from 7 – 9 pm in the MBA PC Lab to answer questions – Submit slides by 8: 00 am on Sat. 8/22 3

SWCB Objectives § § § Feasibility decisions Problem formulation, information needs Role of secondary data Role of research and time budgets Quality, cost, speed 4

SWCB Questions § What should Mr. Gomez do? § Consumer behavior? § What information do we need to make decision? § Which reports allow that information to be estimated? § What decision do these reports suggest? 5

SWCB Conclusions § Feasibility studies need data on: industry demand, market share, investment, costs, margins. Break even analysis common. § Conceptualize data before doing research § Effort at problem formulation stage reduces later costs of doing research § Secondary data is the place to start 6
 § Cost of information is real; research budget typically constrained")
SWCB Conclusions (cont. ) § Cost of information is real; research budget typically constrained § Cheap info may not be most economical if it is unreliable § Just because budget has funds does not mean you should conduct extraneous research. 7

Today’s Agenda § § § Announcements Southwestern Conquistador Beer Case Backward Market Research Secondary data quality Measure types Hypothesis Testing and Chi-Square

Backward Market Research § Obvious? Psychology of why so hard to do. § Imagine the end of the process: § What will the final report look like? DUMMY TABLES § What decision alternatives might be implemented? § What analyses can support a choice between alternatives? § Where to get the data for analysis? § Do they already exist? § If not, may need to commission a study. § Design the study (“need-” vs. “nice-to-know”) § Analyze data & make recommendation
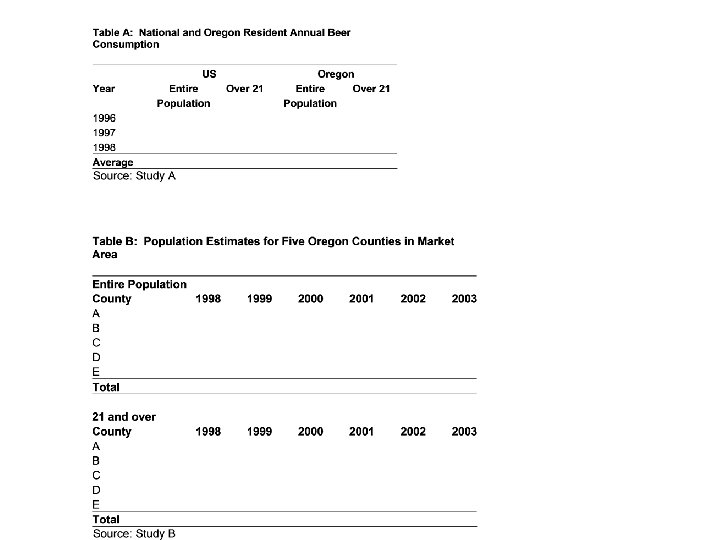

Analysis Dummy Table Consumers’ Upbeat Learning of Feelings Ad Claims Consumers’ Attitude toward the Ad Consumers’ Attitude toward the Brand Ad A Ad B Ad Score =. 25 Up. F +. 20 Claims +. 15 AAd +. 40 AB Action Standard - Run the Ad with the Higher Ad Score

Research Process Fig 3 -1, p. 49 § § § § Marketing Planning & Info System. Agree on Research Purpose Am. Ex Research Objectives (hypotheses, bounds) Value of Information (the clairvoyant, p. 59) Design Research Collect Data & Analyze Report Results & Make Recommendations
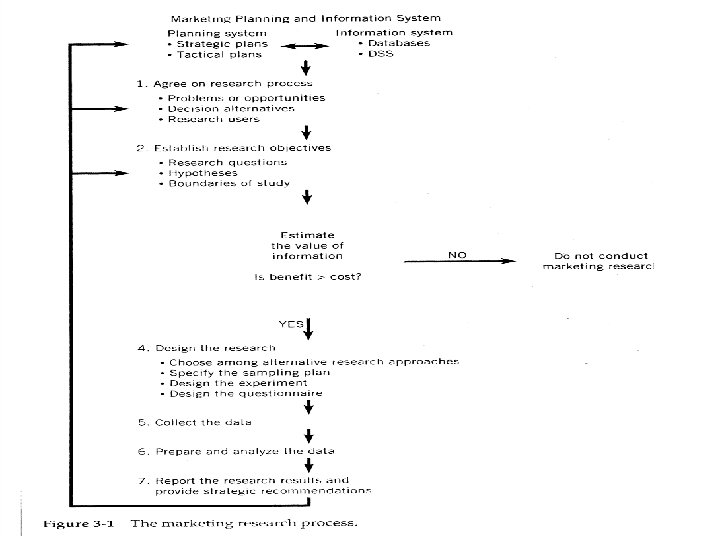

Research Process Fig 3 -1, p. 49 § § § § Marketing Planning & Info System. Agree on Research Purpose Am. Ex Research Objectives (hypotheses, bounds) Value of Information (the clairvoyant, p. 59) Design Research Collect Data & Analyze Report Results & Make Recommendations
 § Marketing")
American Express Marketing Research Brief (To Be filled out by End User) § Marketing Background - Describe the current information or environment – what are the issues that precipitated the need for the research? What business units will be impacted? § Business Decisions - What decisions will be made and what actions will be taken as a result of the research? (If appropriate, specify alternatives being considered). What other data or business considerations will impact the decision? § Information Objectives - What are the key questions (critical information) that must be answered in order to make the decision? § Relevant Populations - Who do we need to talk to and why? § Timing - When must the research be completed to make the marketing decision? § Budget – How much money has been budgeted for this research? To § § § what budget line will it be charged? Requested by ________ Manager Requested by ________ Director Requested by ________ Vice President
 Job #")
American Express Marketing Research Brief (To Be filled out by Marketing Research) Job # __ Project Title _____ Budget Line ___ Business Unit___ § Marketing Background § Business Decisions To Be Made § Research Objectives § Research Design § Action Standards § Existing Sources of Information Consulted (e. g. syndicated and/or previous research) § § Research Firm Timing Cost Market Research Department Travel Cost § § § Approval ________ Vice President Approval ________ if between $100, 000 and $500, 000 - Sr. VP Approval ________ if over $500, 000 - Exec. Committee Member
 §")
American Express Marketing Research Actionability Audit (To Be filled out by End User) § § Project Name End User Name 1. What Decisions or Actions were taken or are planned as a result of this research? If none, explain why. Were any Actions Taken or are any actions being considered that are in conflict with the research learning? If so, why? In retrospect, is there anything that could have been done differently to improve the actionability of the research investment? If so, what? Relevant Populations - Who do we need to talk to and why? 2. 3. 4.

Research Process Fig 3 -1, p. 49 § § § § Marketing Planning & Info System. Agree on Research Purpose Am. Ex Research Objectives (hypotheses, bounds) Value of Information (the clairvoyant, p. 59) Design Research Collect Data & Analyze Report Results & Make Recommendations

Overview of Research Design § Exploratory § Generate ideas on alternatives & criteria to evaluate the alternatives § Descriptive § 1 -way: frequencies, proportions, means, medians § 2 -way: correlations, crosstabs § Causal § Assess cause-effect relationships

Today’s Agenda § § § Announcements Southwestern Conquistador Beer Case Backward Market Research Secondary data quality Measure types Hypothesis Testing and Chi-Square
 §Getting data and judging its quality")
3 Key Skills §Backward market research (1, 2) §Getting data and judging its quality §Secondary data (2) §Exploratory research (3) §Descriptive research (4, 5) §Causal research (6) §Analysis frameworks for classic marketing problems (7 -10)

Primary vs. Secondary Data §Primary -- collected anew for current purposes §Secondary -- exists already, was collected for some other purpose §Finding Secondary Data Online @ Fuqua § http: //library. fuqua. duke. edu

Primary vs. Secondary Data

Evaluating Sources of Secondary Data §If you can’t find the source of a number, don’t use it. Look for further data. §Always give sources when writing a report. §Applies for Focus Group write-ups too §Be skeptical.

Secondary Data: Pros & Cons §Advantages §cheap §quick §often sufficient §Disadvantages §there is a lot of data out there §numbers sometimes conflict §categories may not fit your needs
")
Types of Secondary Data *IRI = Information Resources, Inc. (http: //us. infores. com/)

Secondary Data Quality: KAD p. 120 & “What’s Behind the Numbers? ” §Data consistent with other independent sources? §What are the classifications? Do they fit needs? §When were numbers collected? Obsolete? §Who collected the numbers? Bias, resources? §Why were the data collected? Self-interest? §How were the numbers generated? Exter: §Sample size §Sampling method (Sessions 5&6) §Measure type §Causality (MBA Marketing Timing & Internship)

It is Hard to Infer Causality from Secondary Data Took Core Marketing Did Not Get Desired Marketing Internship Term 1 Got Desired Marketing Internship 76% Term 3 51% 49% 24%

Evaluating Sources of Secondary Data §If you can’t find the source of a number, don’t use it. Look for further data. §Always give sources when writing a report. §Applies for Focus Group write-ups too §Be skeptical.

Be Skeptical MBA’s May Be A Marketing Liability… “A master of Business Administration degree is not only worthless, it can work against a marketer, according to a survey of marketing executives from 32 consumer-products companies by consulting firm Ken Coogan & Partners. . . Marketing executives from 18 underperforming companies – which had sales grow 7% less than their categories on average in the last two years ended August 2005 – were twice as likely to have been recruited out of MBA programs than marketing executives from out-performing companies, which averaged growth 6. 2% faster than their categories over the two years. ” Source: Ad. Age. com, March 21, 2006 Mktg. Executive had an MBA Mktg. Executive did not have an MBA Overperformers (n = 9) 55. 5% 44. 5% Underperformers (n = 18) 88. 9% 11. 1%

Today’s Agenda § § § Announcements Southwestern Conquistador Beer Case Secondary data quality Measure types Hypothesis Testing and Chi-Square

Measure Types §Nominal: Unordered Categories §Male=1; Female = 2; §Ordinal: Ordered Categories, intervals can’t be assumed to be equal. §I-95 is east of I-85; I-80 is north of I-40; Preference data §Interval: Equally spaced categories, 0 is arbitrary and units arbitrary. § Fahrenheit temperature – each degree is equal §Ratio: Equally spaced categories, 0 on scale means 0 of underlying quantity. § $ , Age

Meaningful Statistics & Permissible Transformations

The Interval/Ordinal Distinction §The mean is a meaningless statistic when a variable is ordinal or nominal. §That is because different permissible transformations lead to different conclusions §Example on next slide: Male and female speed to finish quiz (lower # means faster finish) §Measure 1 implies males faster, but measure 2 implies females faster. §In contrast, median is meaningful for ordinal data, because different permissible transformations lead to same conclusion §Median female faster than median male in measure 1, measure 2, or any permissible transform

Means and Medians with Ordinal Data Gender Measure 1 Measure 2 Means M 1 1 Measure 1 M 2 2 M=5. 4 < F=5. 6 F 3 3 Measure 2 F 4 4 M=65. 4 > F=25. 6 F 5 5 F 6 6 Medians M 7 107 Measure 1 M 8 108 M=7 > F=5 M 9 109 Measure 2 F 10 110 M=107 > F=5

Ratio Scales & Index Numbers

Today’s Agenda § § § Announcements Southwestern Conquistador Beer Case Backward Market Research Secondary data quality Measure types Hypothesis Testing and Chi-Square

MBA Acceptance Data A. Raw Frequencies B. Cell Percentages

C. Row Percentages D. Column Percentages

Rule of Thumb §If a potential causal interpretation exists, make numbers add up to 100% at each level of the causal factor. §Above: it is possible that gender (row) causes or influences acceptance (column), but not that acceptance influences gender. Hence, row percentages (format C) would be desirable.

Hypothesis: What you believe the relationship is between the measures. Theory Empirical Evidence Beliefs Experience Here: Believe that acceptance is related to gender Null Hypothesis: Acceptance is not related to gender Logic of hypothesis testing: Negative Inference The null hypothesis will be rejected by showing that a given observation would be quite improbable, if the hypothesis was true. Want to see if we can reject the null.

Steps in Hypothesis Testing 1. State the hypothesis in Null and Alternative Form – Ho: There is no relationship between gender and MBA acceptance – Ha 1: Gender and Acceptance are related (2 -sided) – Ha 2: Fewer Women are Accepted (1 -sided) 2. Choose a test statistic 3. Construct a decision rule

Chi-Square Test §Used for nominal data, to compare the observed frequency of responses to what would be “expected” under some specific null hypothesis. §Two types of tests §Contingency (or Relationship) – tests if the variables are independent – i. e. , no significant relationship exists between the two variables §Goodness of fit test – Compare whether the data sampled is proportionate to some standard
*(c-1) degrees of freedom Observed number in cell i number of")
Chi-Square Test With (r-1)*(c-1) degrees of freedom Observed number in cell i number of cells Expected number in cell i under independence number of rows number of columns = Column Proportion * Row Proportion * total number observed

MBA Acceptance Data Contingency A. Observed Frequencies C. B. Cell Percentages Expected Frequencies Accept Reject M . 111*. 556*1800=111. 889*. 556*1800=890 F . 111*. 444*1800= 89 . 889*. 444*1800=710
*(c-1) degrees of freedom =(140 -111)2/111 + (860 -890)2/890 + (60")
Chi-Square Test With (r-1)*(c-1) degrees of freedom =(140 -111)2/111 + (860 -890)2/890 + (60 -89)2/89 + (740 -710)2/710 = 19. 30 So? 3. Construct a decision rule

Decision Rule 1. Significance Level Probability of rejecting the Null Hypothesis, when it is true 2. Degrees of freedom - number of unconstrained data used in calculating a test statistic - for Chi Square it is (r-1)*(c-1), so here that would be 1. When the number of cells is larger, we need a larger test statistic to reject the null. 3. Two-tailed or One-tailed test – Significance tables are (unless otherwise specified) two tailed tables. Chi-Sq is on pg 517 Ha 1: Gender and Acceptance are related (2 -sided) Critical Value = 3. 84 Ha 2: Fewer Women are Accepted (1 -sided) Critical Value = 2. 71 4. Decision Rule: Reject the Ho if calculated Chi-sq value (19. 3) > 5. the test critical value (3. 84) for Ha 1 or (2. 71) for Ha 2

Chi-Square Table

Chi-Square Test §Used for nominal data, to compare the observed frequency of responses to what would be “expected” under some specific null hypothesis. §Two types of tests §Contingency (or Relationship) – tests if the variables are independent – i. e, no significant relationship exists §Goodness of fit test – Compare whether the data sampled is proportionate to some standard

Goodness of fit – Chi-Square Ho: Car Color Preferences have not shifted Ha: Car color Preferences have shifted Data Red 680 Green 520 Black 675 White 625 Total(n) 2500 Historic Distribution Expected # = Prob*n 30% 25% 20% Do we observe what we expected? 750 625 500
 degrees of freedom =(680 -750)2/750 + (520 -625)2/625 + (675")
Chi-Square Test With (k-1) degrees of freedom =(680 -750)2/750 + (520 -625)2/625 + (675 -625)2/625 + (625 -500)2/500 = 59. 42 So? 3. Construct a decision rule

Decision Rule 1. Significance Level Probability of rejecting the Null Hypothesis, when it is true 2. Degrees of freedom - number of unconstrained data used in calculating a test statistic - for Chi Square it is (k-1), so here that would be 3. When the number of cells is larger, we need a larger test statistic to reject the null. 3. Two-tailed or One-tailed test – Significance tables are (unless otherwise specified) two tailed tables. Chi-Sq is on pg 517 Ha: Preference have changed (2 -sided) Critical Value = 7. 81 4. 5. Decision Rule: Reject the Ho if calculated Chi-sq value (59. 42) > the test critical value (7. 81).

Chi-Square Table

Recap §Finding & Evaluating Secondary Data §Measure Types §permissible transformations §Meaningful statistics §Index #s §Crosstabs §Casting right direction §Chi-square statistic §Contingency Test §Goodness of Fit Test
- Slides: 54