Sources of Productivity Growth Micro dynamics and macro


 1")


 19952005 EU US VA%")


 real value added Kit ICT capital service Kn")


- Slides: 24
Sources of Productivity Growth Micro dynamics and macro outcomes Eric Bartelsman* Sep. 17, 2008 Warsaw, Poland *Vrije Universiteit Amsterdam, Tinbergen Institute, and IZA; .
Long-run Productivity Growth Commodity Time to Productivity earn 1885 earn 2000 multiple (hours) 1 -speed 260 7. 2 36. 1 bicycle Office Chair 24 2. 0 12. 0 Hair Brush 16 2. 0 8. 0 Silver Spoon 26 34. 0 0. 8 Source: Brad De. Long, 1991 -2000
Economic Growth GDP = Hours worked X GDP/hour l Economic growth is weighted sum of: l l Growth in labor input l Growth in labor productivity l l l Growth capital/labor ratio Growth in ‘total factor productivity’, or TFP Innovation as ultimate source of TFP l Manna from heaven or intentional creation
Inquiry into sources of productivity growth l For whom is such academic research useful? l Curiosity l Economic policy l Business sector
Productivity Research l Research methods traditionally have been macroeconomic l Growth models l l Solow: exogenous technology Romer: R&D (Human capital) as driver l Growth empirics l l Cross-country evidence Multi-industry panel data l Growth Accounting (EU-KLEMS)
Value added per hour EU relative to US (source: EU Klems, market sector, EU 15)
Results from EUKLEMS Nat. Acct. based Growth Accounting dataset • Based on seminal work by Jorgenson Accounting framework for attributing productivity growth to factors of production Framework to aid in integration of National Accounts (see Jorgenson and Landefeld 2005). • attempt to attribute all growth in output to factors under control of firms In recent years much growth is not accounted for (TFP growth) Differences in growth performance between US and EU visible, but not ‘understandable’ Particularly, the differences in the impact of ICT remain ‘a mystery’
Results from EUKLEMS Source: Timmer, O’Mahony, and van Ark (2007) 19952005 EU US VA% --Kict --TFP Market Ele. Com 2. 1 3. 8 . 4. 8 1. 0 2. 8 3. 7 10. 5 . 6. 8 1. 7 8. 7 Mfgx. Elc 1. 2 1. 7 1. 8 . 2 2. 2 DISTR Fin. Bus 2. 6 3. 5 . 3. 9 1. 5 -1. 0 4. 1 4. 3 . 5. 7 2. 1. 4
Results from EUKLEMS What we have not learned • Why is contribution from IT capital lower in EU Or… Why is ICT investment lower • Why is growth in ‘Elecom’ so much lower Or… Why is ‘Elecom’ sector small, especially in fast growing parts • Why is unexplained growth so high? Why is TFP growth so much lower in EU Or… Why is TFP growth especially low in ICT intensive sectors • What, if anything, is the role of policy Or… If policy affects firms and market interactions, what can industry data tell us about policy
Average productivity vs aggregate productivity Aggregate productivity depends not only on firm-level productivity distribution…
Average productivity vs aggregate productivity But also on firm-size distribution
Businesses produce, not countries or industries l l l Heterogeneity in productivity at the firm-level within sectors or countires A country may have a ‘long tail’ problem: Or, a lack of ‘excellent’ firms: long tail country 1 • Sectoral productivity may not be a useful policy indicator country 2 Global frontier
Why analysis of firm-level dynamics may help answer questions • Heterogeneous agents at micro level Diversity in firm-level strategies • Market selection Sales and input growth, conditional on productivity and economic ‘environment’ • Combination of firm-level productivity impact and market share evolution gives total impact on industry productivity
Sources of productivity growth Pushing out the frontier l Increasing productivity below the frontier l l Diffusion of technology l Reallocating resources from low to high productivity firms
Example: How to raise productivity ‘below the frontier’ l Diffusion of existing technology l Human capital l Competitive pressure l Framework conditions l Reallocation of resources from less to more productive firms l Frictions hamper efficient allocation l Policy affects frictions in: l Product markets, labor market, entry/exit
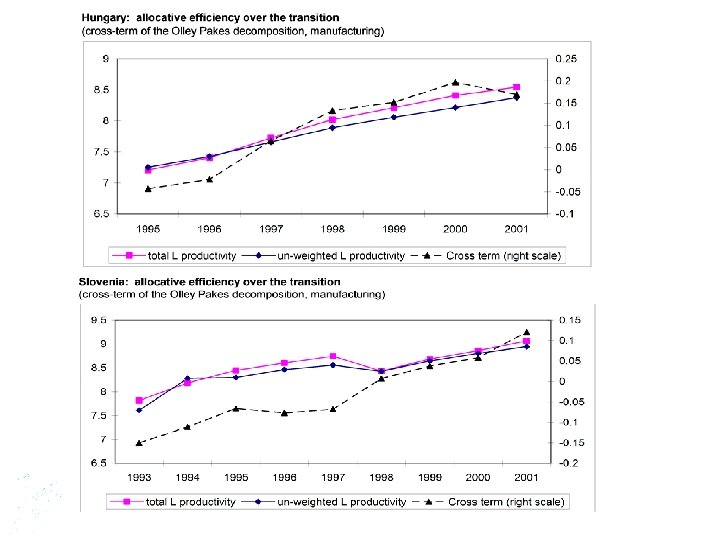
Reallocation and productivity l l Frictions impede reallocation to most productive firms Frictions affect ‘selection’ of firms l Who will enter, who will exit l ‘Olley-Pakes cross-term’ measures the effect
Example: ICT Adoption • Carrot and Stick: Profits to be gained if succesful (taking into account market share gains) Competitive pressure: Market share/profit losses when others adopt successfully • Costs and benefits: Readiness: skilled workers, high wages, complementary inputs Profits from being successful and scaling up business
Broadband Adoption and Impact v (log) real value added Kit ICT capital service Kn Non-IT capital service Hrs hours w Average wage Cap%it ICT-capital as share of cap. Hi. Skl High skilled worker share DSL% Broadband penetration Churn Interquartile range of firmlevel growth rate distribution
Broadband Adoption and Impact a 1 a 2 a 3 a 4 b 1 b 2 b 3 b 4 Variable ICTindicator: Kn DSL% 1. 24. 90 Internet% 1. 20 1. 05 . 35 . 27 . 34 . 27 Kit Hrs w(-1) Cap%it Hi. Skl Churn dummies D. F. -. 07. 72. 24. 31. 18. 30 c, t 659 . 05. 68. 02. 20. 38. 15 i, t 646 -. 08. 72. 30. 32. 19. 28 c, t 649 . 05. 68. 01. 17. 33. 14 i, t 646
Impact of Policy on ICT and Productivity • Firms have capabilities and desire to ‘try’ new ways of meeting market demand Since mid-1990 s, this experimentation is often through ICT • Firms’ desire to experiment depend on carrot and stick Leveraging of successful investment through scale increase is an enormous carrot • Policy affects resource reallocation And thus indirectly firm’s choice for innovation strategy
Impact of Labor Market Policy • Based on results from Bartelsman, Perotti, and Scarpetta (2008), Employment Protection Legislation (EPL), reduces productivity in ‘frontier’ industries • Based on results from Bartelsman, Gautier, and de Wind (forthcoming), EPL reduces share of employment in ‘frontier’ industries • ‘Frontier’ is a bit tautological: it is a sector where payoff to successful experimentation is highest relative to follower It is a sector where the succesful firms are relatively furthest from followers It is sector with most experimentation
Conclusions l l Productivity growth has its deep origins in the development of new ideas Firms make decisions on whether to innovate, to utilize existing technology, or just ‘muddle along’ Firms’ decisions depend on policy environment and market interactions Policy may impact firm’s decisions directly, but also through selection mechanism