SOMKmeans MATLAB 6 1 SPSS 11 01 SOM

群聚分析操作介紹 -以SOM和K-means為例 使用 具: MATLAB 6. 1 SPSS 11. 01 SOM and K-means example

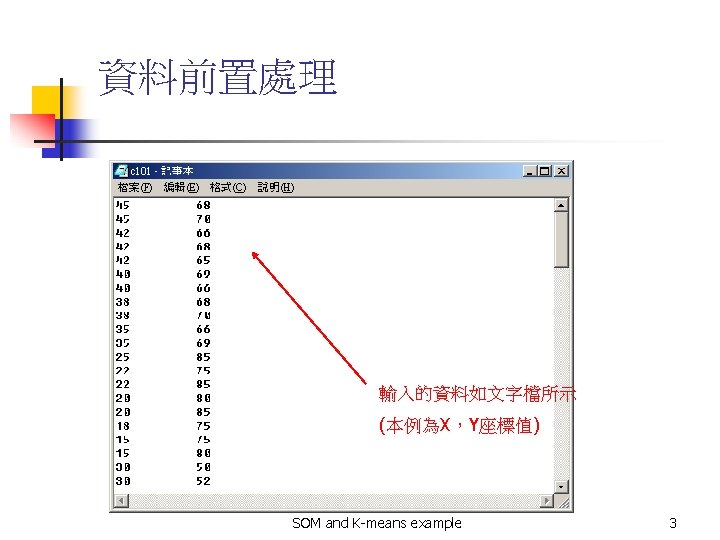
SOM操作步驟 n n 資料前置處理 Matlab操作 SOM and K-means example 2
 於c 101. txt所在位置, 將其匯入 SOM and K-means example 5")
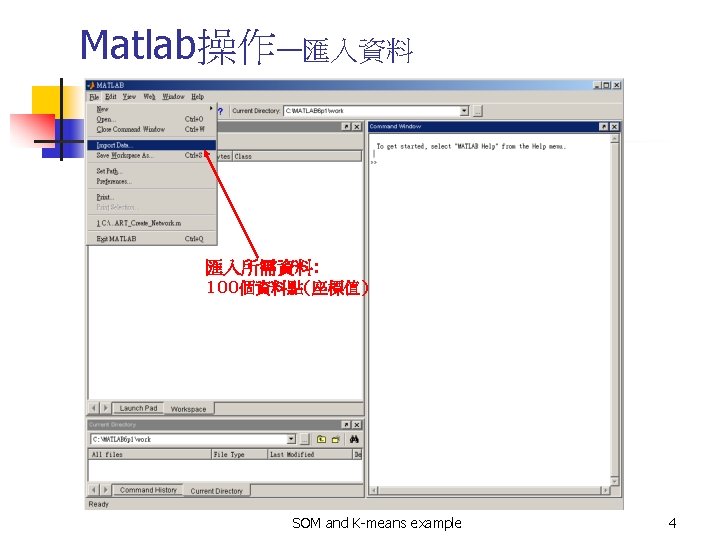
Matlab操作—匯入資料(續) 於c 101. txt所在位置, 將其匯入 SOM and K-means example 5
 選擇“Next” SOM and K-means example 6")
Matlab操作—匯入資料(續) 選擇“Next” SOM and K-means example 6
 選擇“Finish” SOM and K-means example 7")
Matlab操作—匯入資料(續) 選擇“Finish” SOM and K-means example 7


 將ans設為Input型式 SOM and K-means example 11")
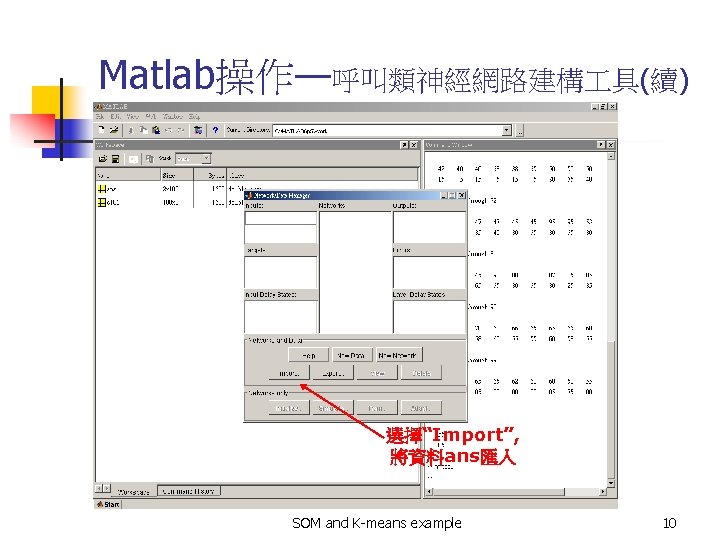
Matlab操作—呼叫類神經網路建構 具(續) 將ans設為Input型式 SOM and K-means example 11
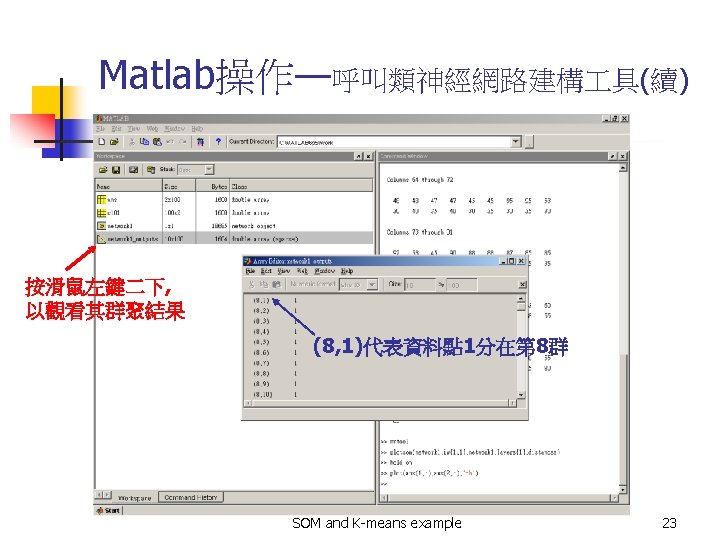
 選擇Clustering所需的 input pattern SOM and K-means example 18")
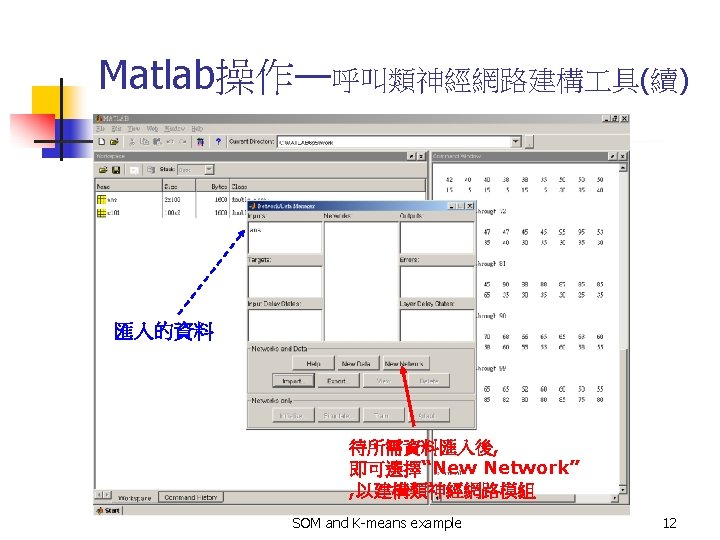
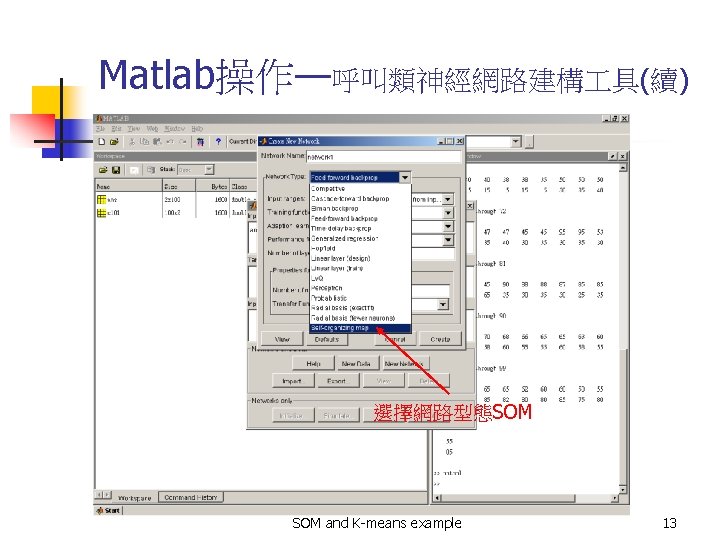
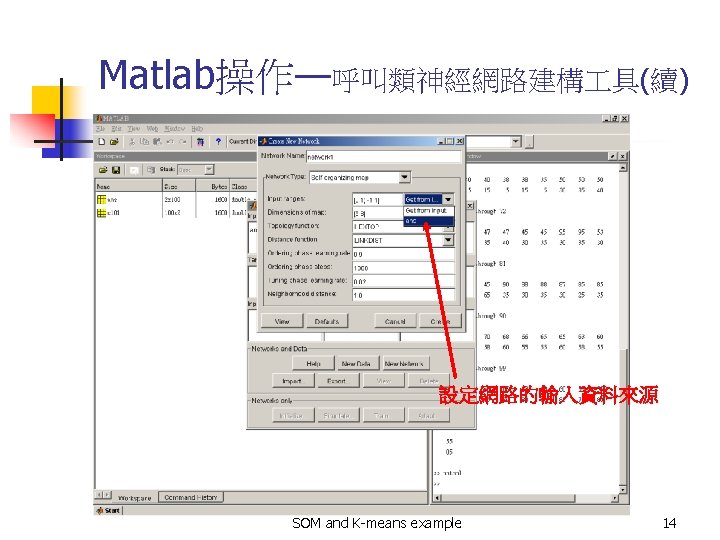
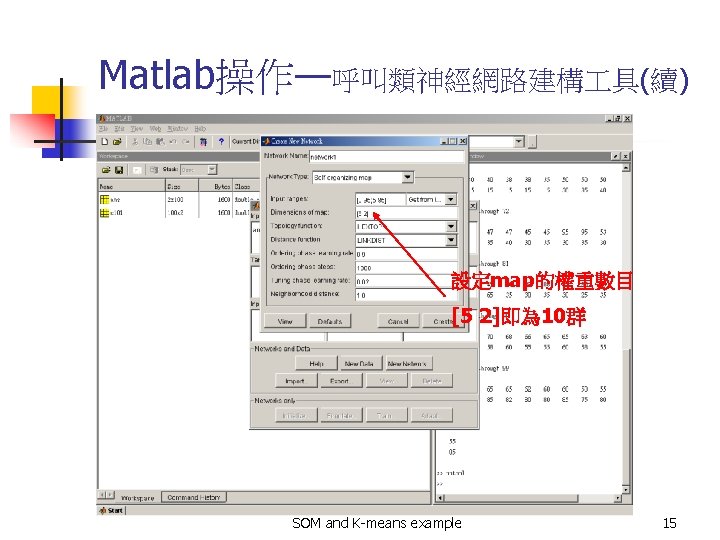
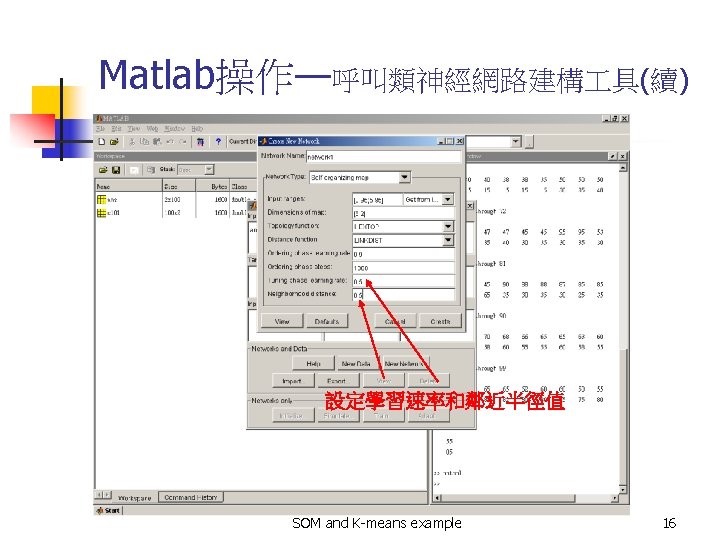
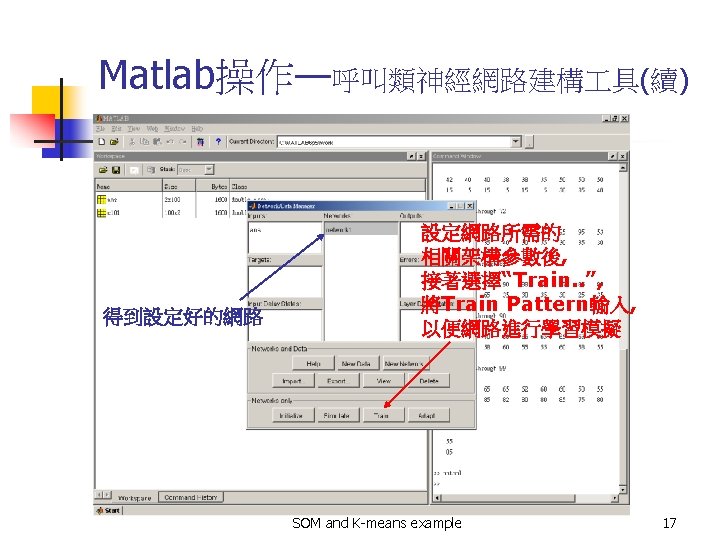
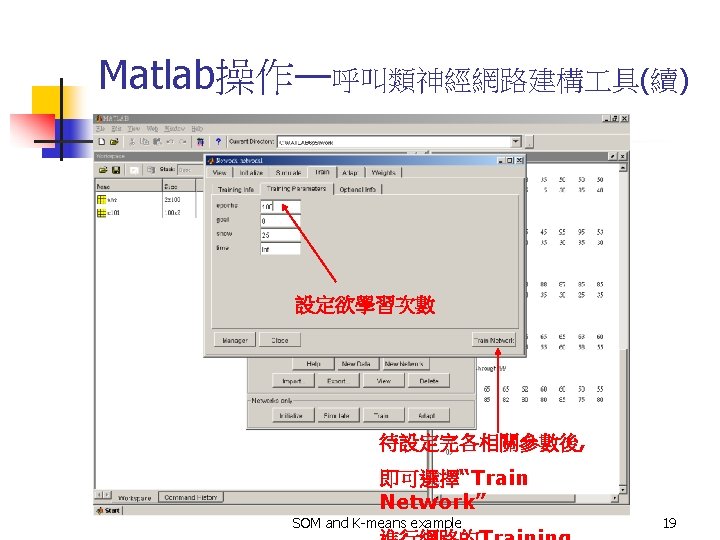
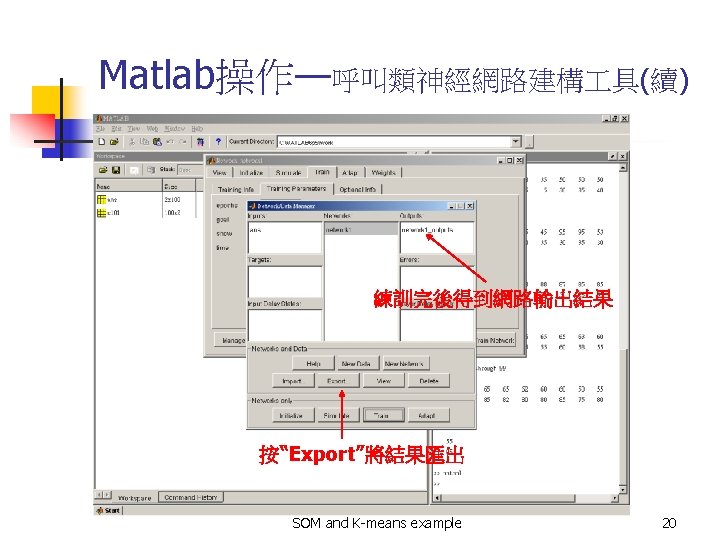
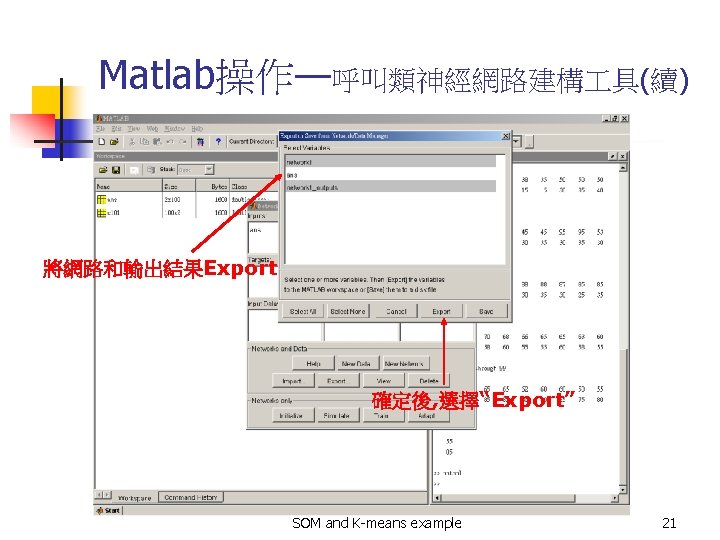
Matlab操作—呼叫類神經網路建構 具(續) 選擇Clustering所需的 input pattern SOM and K-means example 18

K-means操作步驟 n n 資料的輸入 SPSS操作 SOM and K-means example 24

SPSS操作-資料的輸入 開啟SPSS後,選擇“Type in data” 選備建立資料 SOM and K-means example 25
 切換至“variable view” 鍵入所需變數名稱 SOM and K-means example 26")
SPSS操作-資料的輸入(續) 切換至“variable view” 鍵入所需變數名稱 SOM and K-means example 26
 切換回Data View輸入資料 SOM and K-means example 27")
SPSS操作-資料的輸入(續) 切換回Data View輸入資料 SOM and K-means example 27

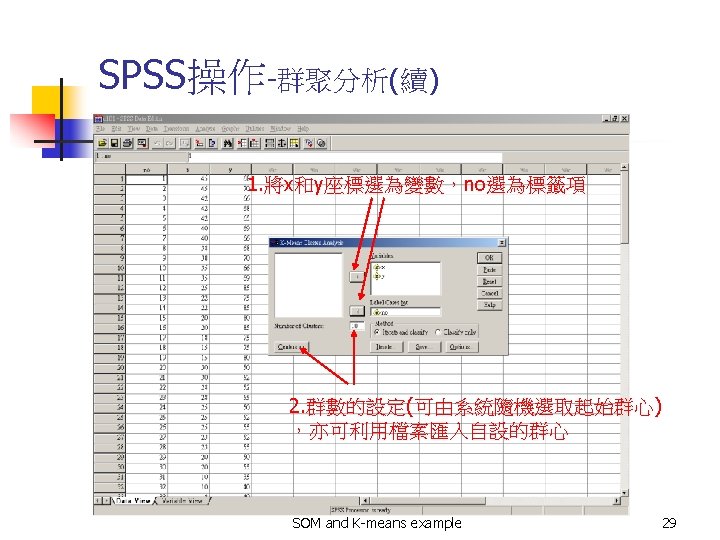
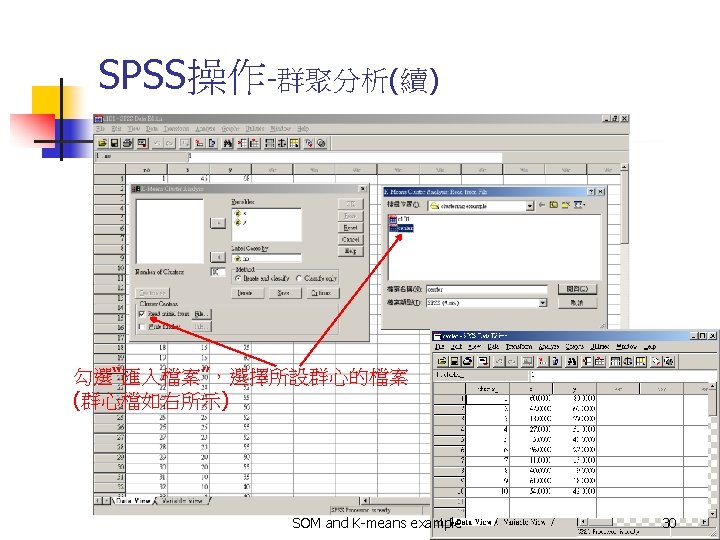
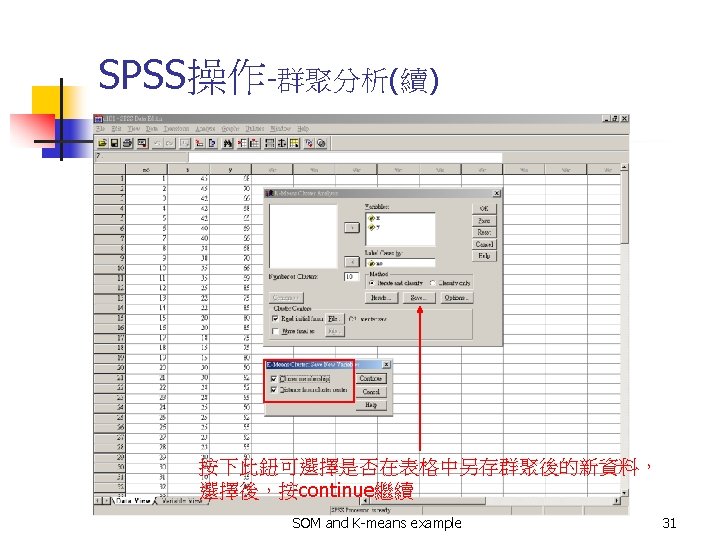
SPSS操作-群聚分析 選擇群聚分析 具下的“K-means Cluster” SOM and K-means example 28


SPSS操作-輸出報表資訊 SOM and K-means example 33

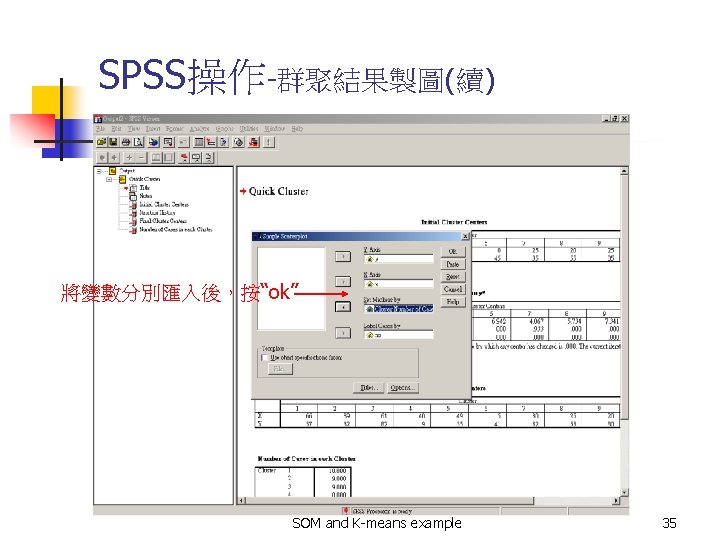
SPSS操作-群聚結果製圖 1. 選擇“scatter plot”散佈圖 2. 選擇“Simple”後按“Define” SOM and K-means example 34
 SOM and K-means example 36")
SPSS操作-群聚結果製圖(續) SOM and K-means example 36
- Slides: 36