Some useful Debug Commands for ClearSpeed Software Development
Some useful Debug Commands for Clear-Speed Software Development Kit --Chap 4 and some commands from chap. 7 -Sagar Panchariya
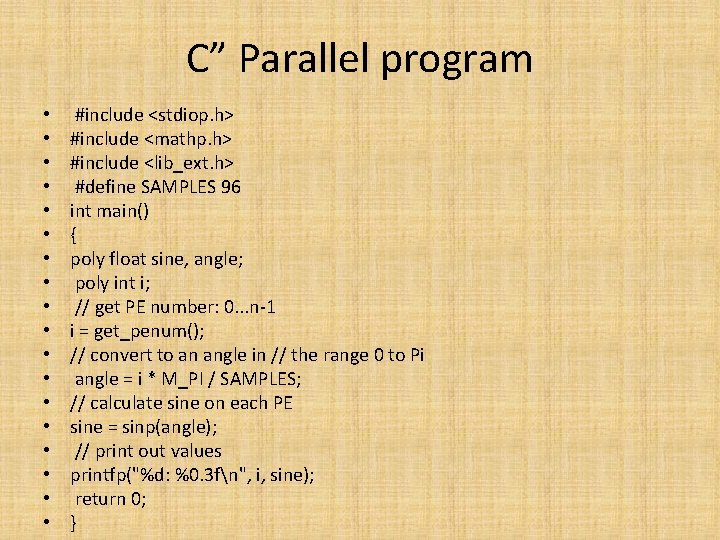
C” Parallel program • • • • • #include <stdiop. h> #include <mathp. h> #include <lib_ext. h> #define SAMPLES 96 int main() { poly float sine, angle; poly int i; // get PE number: 0. . . n-1 i = get_penum(); // convert to an angle in // the range 0 to Pi angle = i * M_PI / SAMPLES; // calculate sine on each PE sine = sinp(angle); // print out values printfp("%d: %0. 3 fn", i, sine); return 0; }
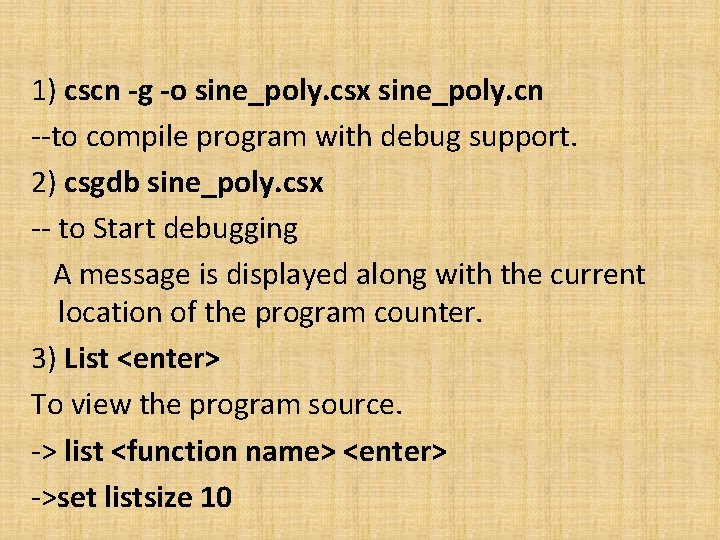
1) cscn -g -o sine_poly. csx sine_poly. cn --to compile program with debug support. 2) csgdb sine_poly. csx -- to Start debugging A message is displayed along with the current location of the program counter. 3) List <enter> To view the program source. -> list <function name> <enter> ->set listsize 10
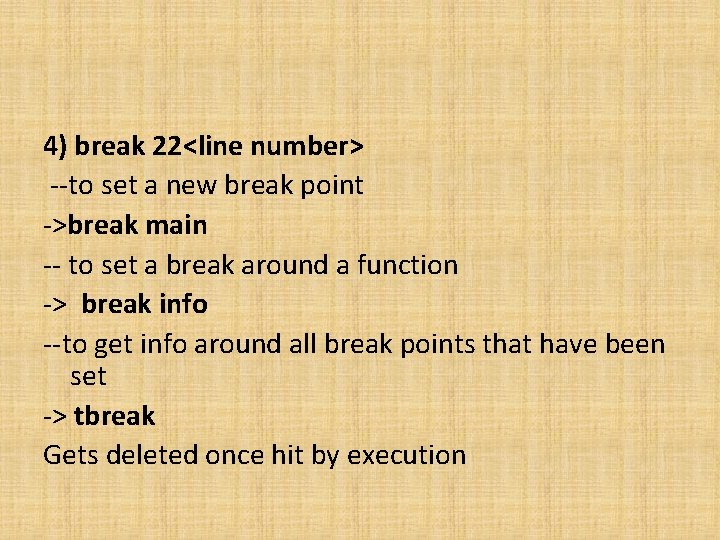
4) break 22<line number> --to set a new break point ->break main -- to set a break around a function -> break info --to get info around all break points that have been set -> tbreak Gets deleted once hit by execution
• 5) run -- start running the program till the break point is reached. 6) print <variablename> (mono or poly) To view the state of all variables when the break point is reached. -> print /d <variablename> --to print integer value of the variable -->set print elements <number> 7) Where Find the current location of the program counter while debugging. 8) Whatis <variablename> gives the data type of the variable name used 9) delete <breakpointnumber>
10) Next -- take the program counter to the next line of execution 11) continue Run till the end of the program is reached. Beside there are commands to step through functions and print values by memory reference in chapter 7 which are not covered in these slides.
- Slides: 6