
SOLUCIA INC USING ACTUARIAL TECHNIQUES TO SOLVE THE






- Slides: 38
SOLUCIA, INC. USING ACTUARIAL TECHNIQUES TO SOLVE THE ROI PUZZLE May 7, 2007 DM COLLOQUIUM
AGENDA 1. 2. SOLUCIA, INC. 3. 4. 5. 6. 7. “Standard” Methodology – a refresher. Power of Population Methods. Healthcare Cost Trend. Benefit Adjustment. Risk Adjustment. Validation. Questions?
Introductions • SOLUCIA, INC. • • • Ian Duncan, FSA, MAAA. President, Solucia Inc. 30 years of health actuarial experience, including Pw. C Management Consulting. Former General Manager of a small DM company – actually implemented program and managed nurses. Our practice focuses on care management financial issues (“the economics of care management”). We also offer care management automation software and predictive modeling solutions. Clients include several large Blues and health insurers, TPAs and care management companies. Recently completed a three-year study of care management evaluation and outcomes, funded by the Society of Actuaries. 3
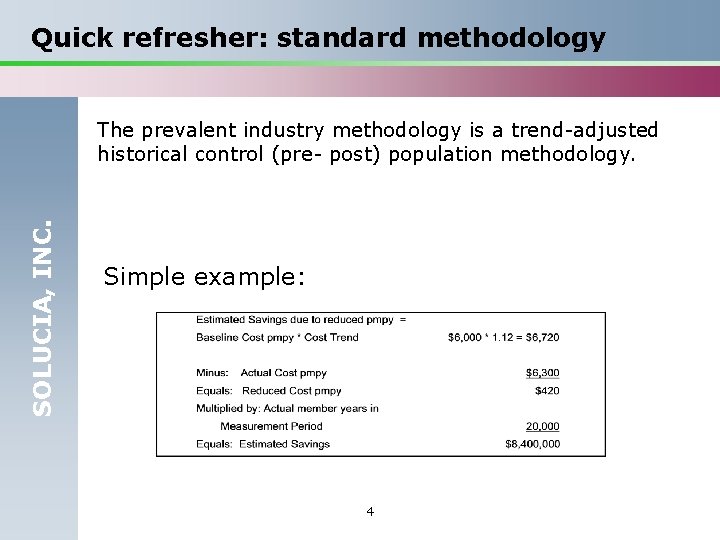
Quick refresher: standard methodology SOLUCIA, INC. The prevalent industry methodology is a trend-adjusted historical control (pre- post) population methodology. Simple example: 4
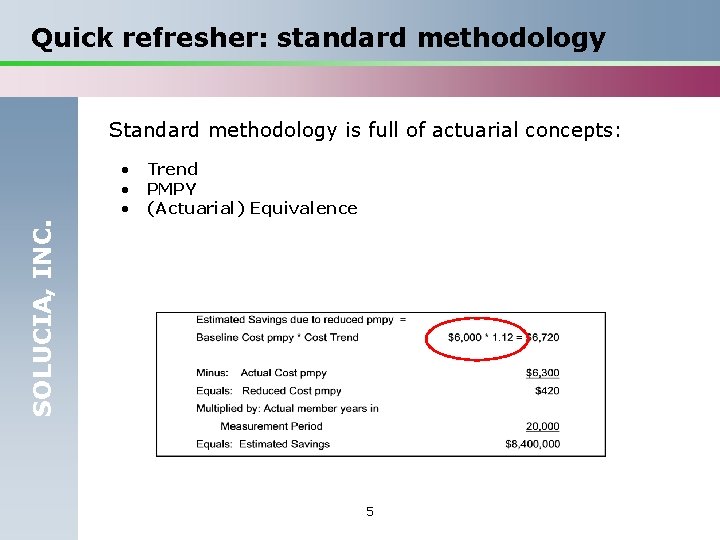
Quick refresher: standard methodology Standard methodology is full of actuarial concepts: SOLUCIA, INC. • Trend • PMPY • (Actuarial) Equivalence 5
Population Methods SOLUCIA, INC. Why this method? Advantages • Objective definitions of populations; • Population Method; avoids worst features of regression to the mean and selection bias; • Practical; • Gets to an answer (without costing more than the program). Disadvantages • Needs some adjustment (trend; benefits; risk); • Sensitive to assumptions, timing; • Year 2/3 problems. 6
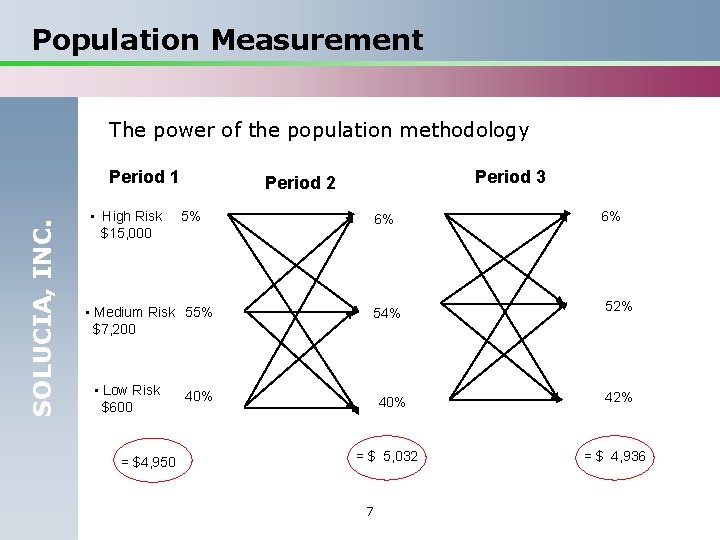
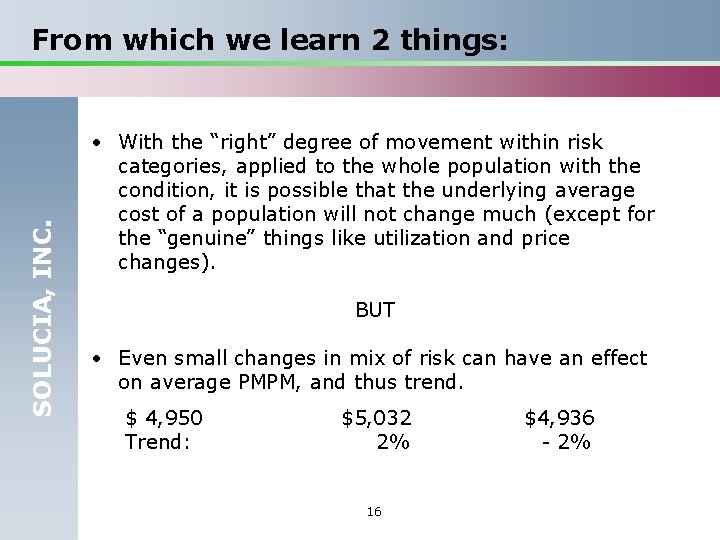
Population Measurement The power of the population methodology SOLUCIA, INC. Period 1 • High Risk $15, 000 5% • Medium Risk 55% $7, 200 • Low Risk $600 = $4, 950 Period 3 Period 2 6% 54% 40% = $ 5, 032 7 6% 52% 42% = $ 4, 936
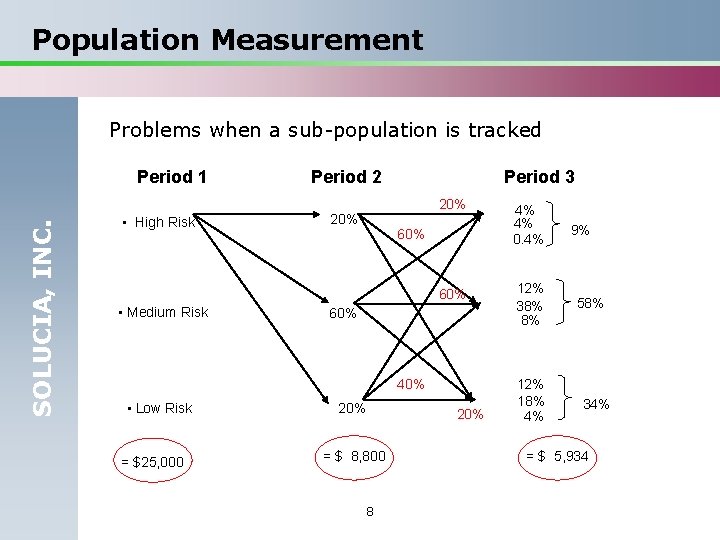
Population Measurement Problems when a sub-population is tracked SOLUCIA, INC. Period 1 • High Risk Period 2 Period 3 20% 60% • Medium Risk 60% 40% • Low Risk = $25, 000 20% = $ 8, 800 8 20% 4% 4% 0. 4% 12% 38% 8% 12% 18% 4% 9% 58% 34% = $ 5, 934
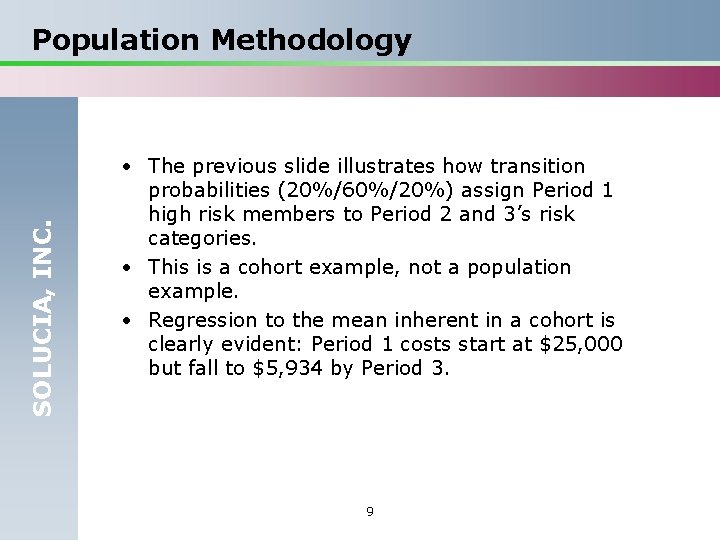
SOLUCIA, INC. Population Methodology • The previous slide illustrates how transition probabilities (20%/60%/20%) assign Period 1 high risk members to Period 2 and 3’s risk categories. • This is a cohort example, not a population example. • Regression to the mean inherent in a cohort is clearly evident: Period 1 costs start at $25, 000 but fall to $5, 934 by Period 3. 9
SOLUCIA, INC. Let’s look at 3 actuarial concepts • Trend Adjustment • Benefit Adjustment • Risk Adjustment 10
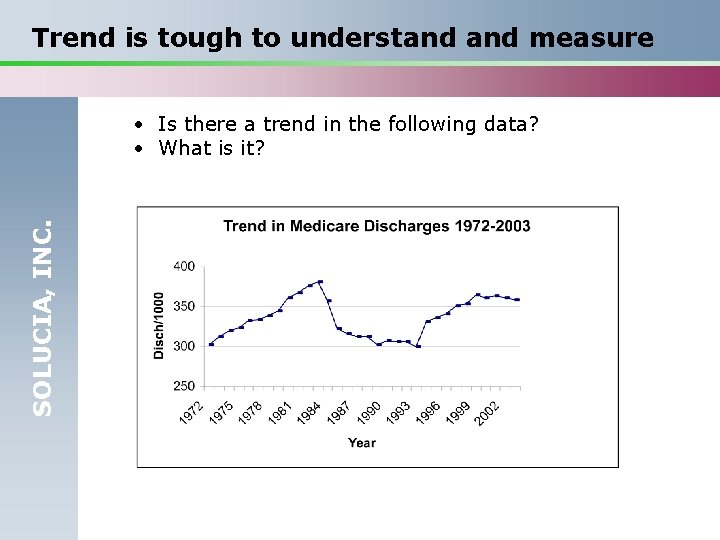
Trend is tough to understand measure SOLUCIA, INC. • Is there a trend in the following data? • What is it?
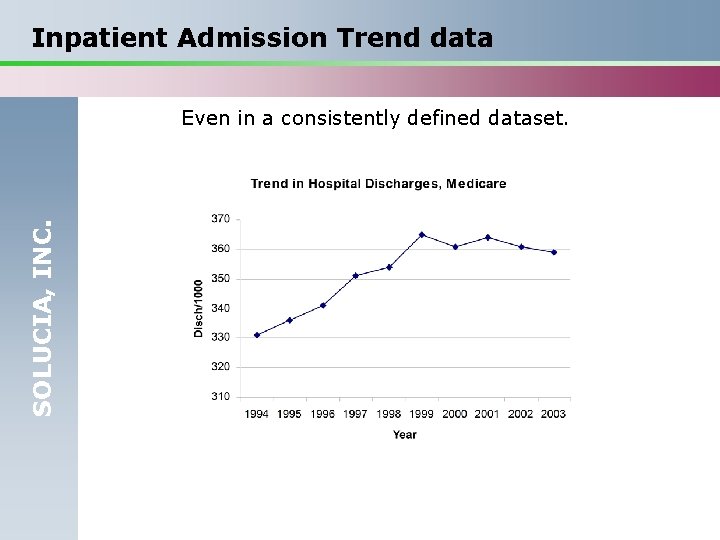
Inpatient Admission Trend data SOLUCIA, INC. Even in a consistently defined dataset.
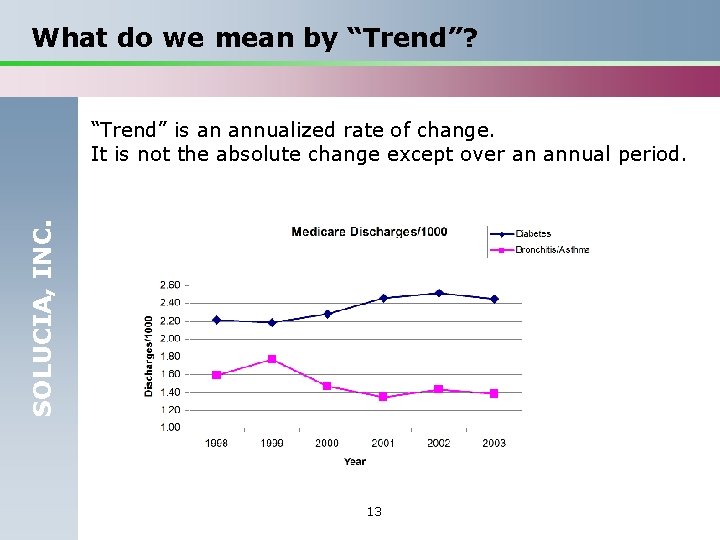
What do we mean by “Trend”? SOLUCIA, INC. “Trend” is an annualized rate of change. It is not the absolute change except over an annual period. 13
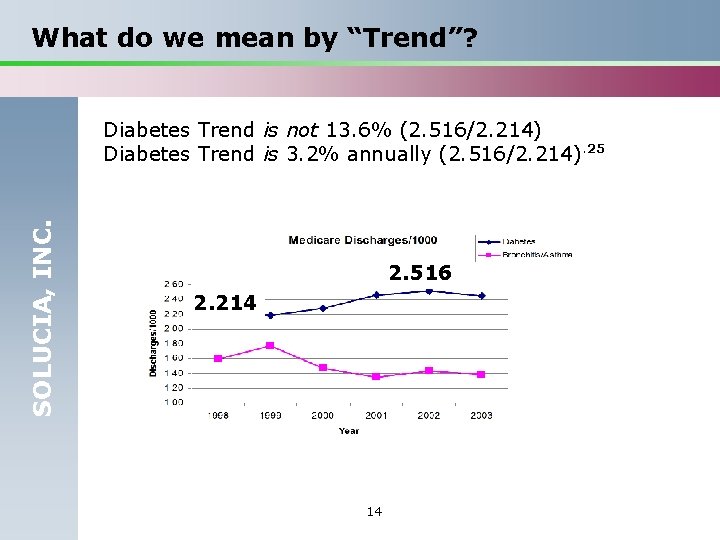
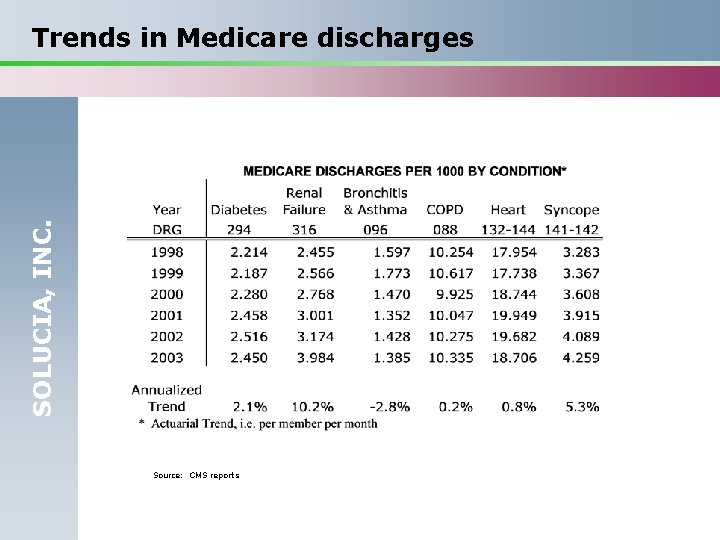
What do we mean by “Trend”? SOLUCIA, INC. Diabetes Trend is not 13. 6% (2. 516/2. 214) Diabetes Trend is 3. 2% annually (2. 516/2. 214). 25 2. 516 2. 214 14
What do we mean by “Trend”? SOLUCIA, INC. The previous slide shows, at least with respect to Diabetes, that a trend adjustment for utilization (increase in the number of admissions that would have occurred, absent the program) is appropriate. This is not always true, as the asthma case shows (trend is -2. 8% annually). 15
SOLUCIA, INC. From which we learn 2 things: • With the “right” degree of movement within risk categories, applied to the whole population with the condition, it is possible that the underlying average cost of a population will not change much (except for the “genuine” things like utilization and price changes). BUT • Even small changes in mix of risk can have an effect on average PMPM, and thus trend. $ 4, 950 Trend: $5, 032 2% 16 $4, 936 - 2%
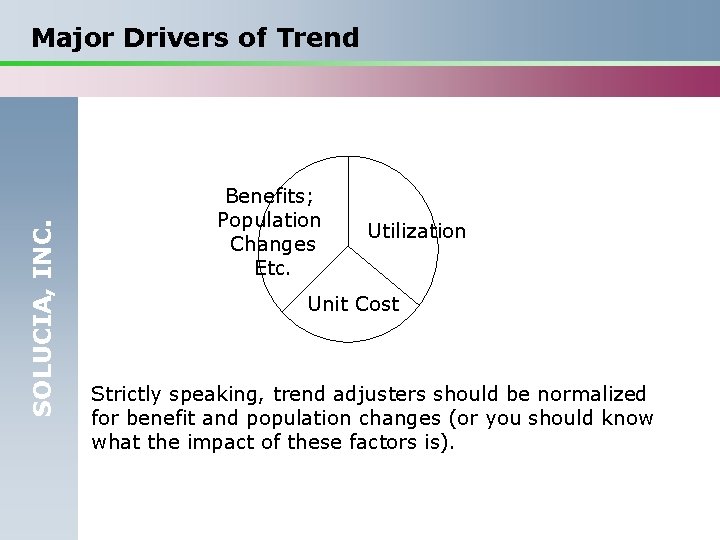
SOLUCIA, INC. Major Drivers of Trend Benefits; Population Changes Etc. Utilization Unit Cost Strictly speaking, trend adjusters should be normalized for benefit and population changes (or you should know what the impact of these factors is).
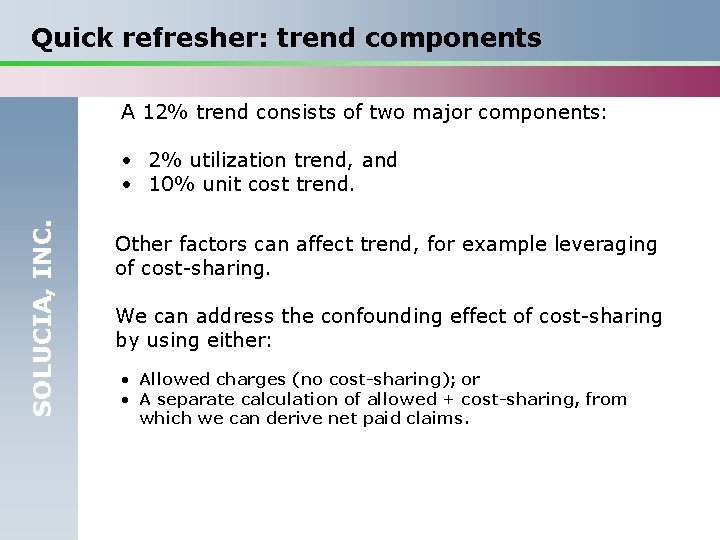
Quick refresher: trend components A 12% trend consists of two major components: SOLUCIA, INC. • 2% utilization trend, and • 10% unit cost trend. Other factors can affect trend, for example leveraging of cost-sharing. We can address the confounding effect of cost-sharing by using either: • Allowed charges (no cost-sharing); or • A separate calculation of allowed + cost-sharing, from which we can derive net paid claims.
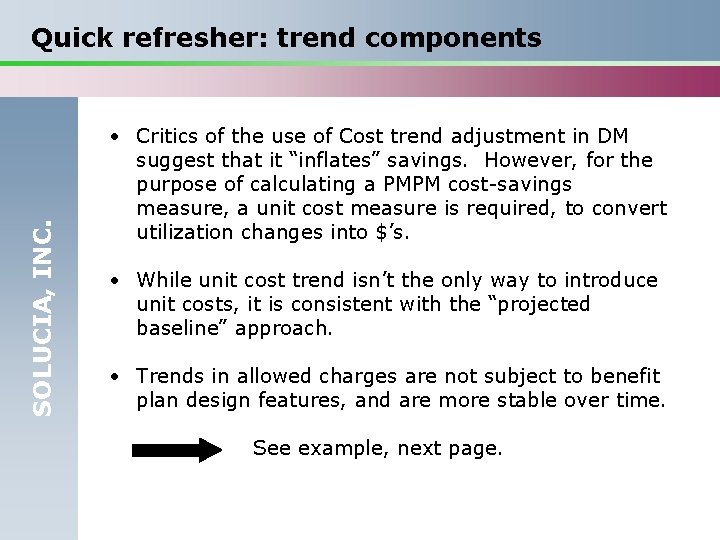
SOLUCIA, INC. Quick refresher: trend components • Critics of the use of Cost trend adjustment in DM suggest that it “inflates” savings. However, for the purpose of calculating a PMPM cost-savings measure, a unit cost measure is required, to convert utilization changes into $’s. • While unit cost trend isn’t the only way to introduce unit costs, it is consistent with the “projected baseline” approach. • Trends in allowed charges are not subject to benefit plan design features, and are more stable over time. See example, next page.
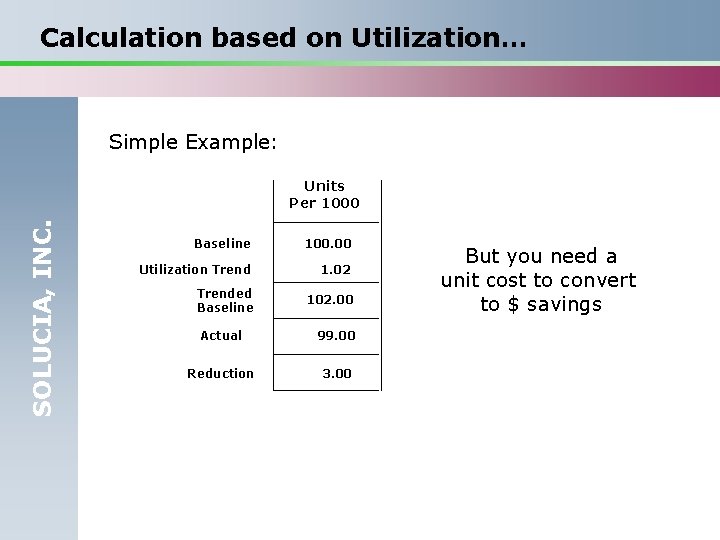
Calculation based on Utilization… Simple Example: SOLUCIA, INC. Units Per 1000 Baseline 100. 00 Utilization Trend 1. 02 Trended Baseline 102. 00 Actual 99. 00 Reduction 3. 00 But you need a unit cost to convert to $ savings
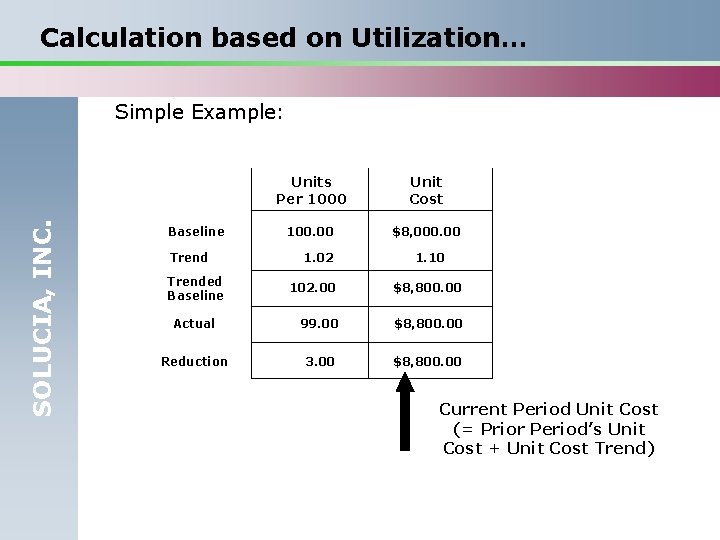
Calculation based on Utilization… SOLUCIA, INC. Simple Example: Baseline Trended Baseline Units Per 1000 Unit Cost 100. 00 $8, 000. 00 1. 02 1. 10 102. 00 $8, 800. 00 Actual 99. 00 $8, 800. 00 Reduction 3. 00 $8, 800. 00 Current Period Unit Cost (= Prior Period’s Unit Cost + Unit Cost Trend)
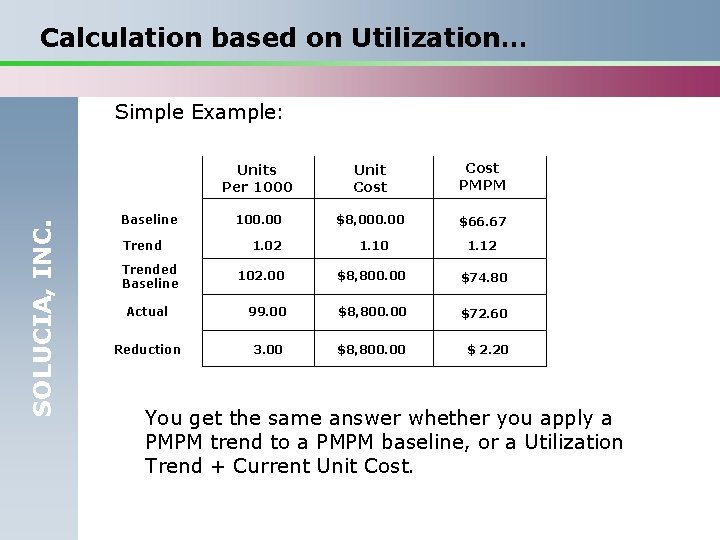
Calculation based on Utilization… SOLUCIA, INC. Simple Example: Units Per 1000 Unit Cost PMPM 100. 00 $8, 000. 00 $66. 67 1. 10 1. 12 102. 00 $8, 800. 00 $74. 80 Actual 99. 00 $8, 800. 00 $72. 60 Reduction 3. 00 $8, 800. 00 $ 2. 20 Baseline Trended Baseline 1. 02 You get the same answer whether you apply a PMPM trend to a PMPM baseline, or a Utilization Trend + Current Unit Cost.
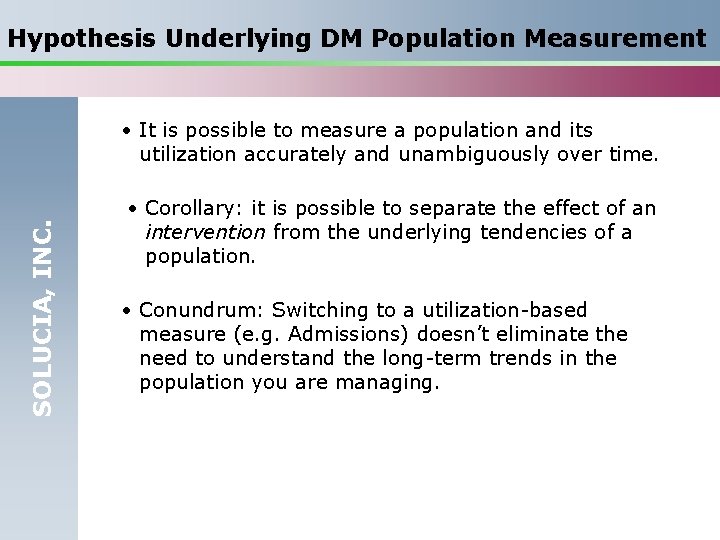
Hypothesis Underlying DM Population Measurement SOLUCIA, INC. • It is possible to measure a population and its utilization accurately and unambiguously over time. • Corollary: it is possible to separate the effect of an intervention from the underlying tendencies of a population. • Conundrum: Switching to a utilization-based measure (e. g. Admissions) doesn’t eliminate the need to understand the long-term trends in the population you are managing.
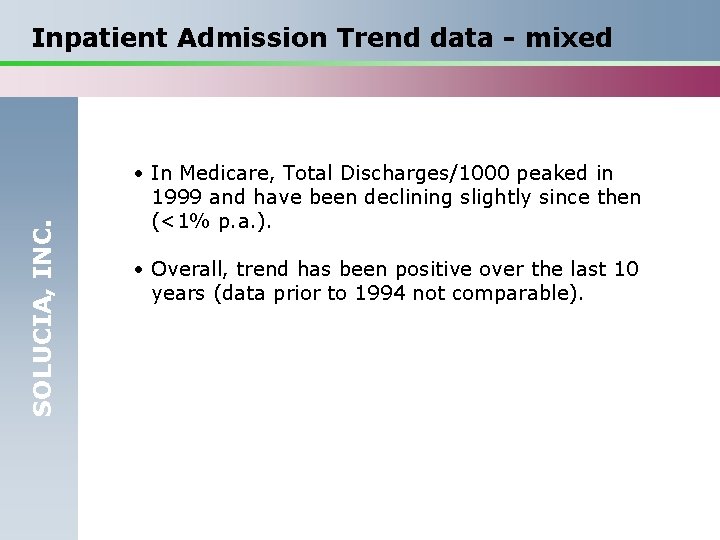
SOLUCIA, INC. Inpatient Admission Trend data - mixed • In Medicare, Total Discharges/1000 peaked in 1999 and have been declining slightly since then (<1% p. a. ). • Overall, trend has been positive over the last 10 years (data prior to 1994 not comparable).
SOLUCIA, INC. Trends in Medicare discharges Source: CMS reports
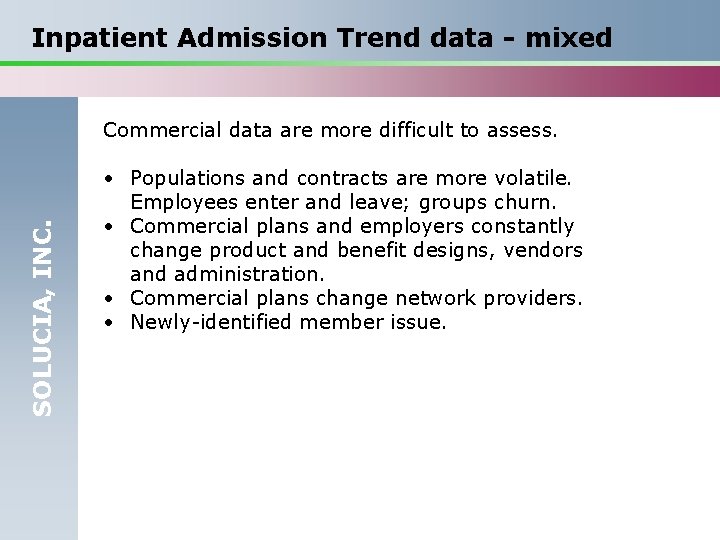
Inpatient Admission Trend data - mixed SOLUCIA, INC. Commercial data are more difficult to assess. • Populations and contracts are more volatile. Employees enter and leave; groups churn. • Commercial plans and employers constantly change product and benefit designs, vendors and administration. • Commercial plans change network providers. • Newly-identified member issue.
SOLUCIA, INC. What about Chronic Trends?
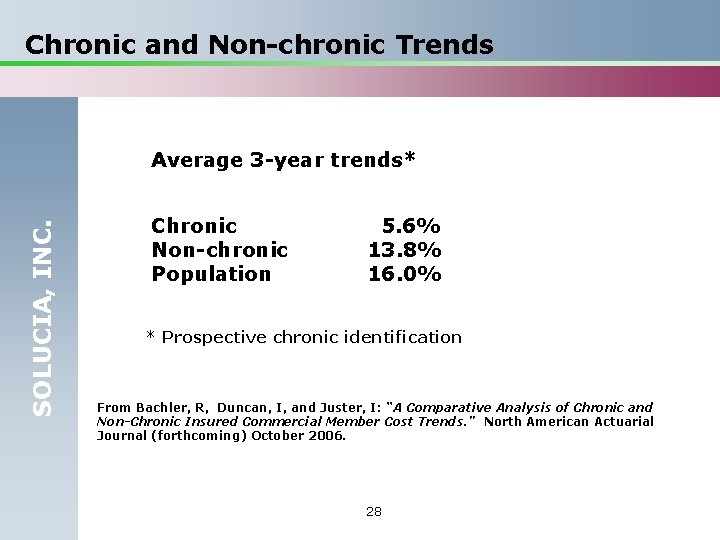
Chronic and Non-chronic Trends SOLUCIA, INC. Average 3 -year trends* Chronic Non-chronic Population 5. 6% 13. 8% 16. 0% * Prospective chronic identification From Bachler, R, Duncan, I, and Juster, I: “A Comparative Analysis of Chronic and Non-Chronic Insured Commercial Member Cost Trends. ” North American Actuarial Journal (forthcoming) October 2006. 28
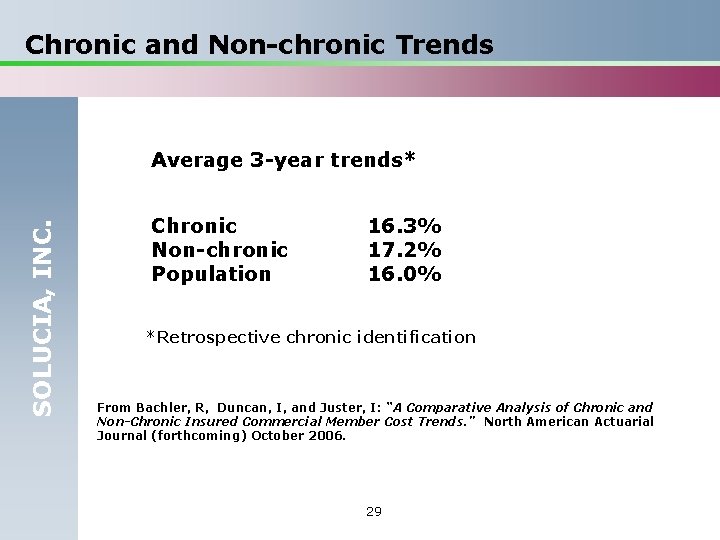
Chronic and Non-chronic Trends SOLUCIA, INC. Average 3 -year trends* Chronic Non-chronic Population 16. 3% 17. 2% 16. 0% *Retrospective chronic identification From Bachler, R, Duncan, I, and Juster, I: “A Comparative Analysis of Chronic and Non-Chronic Insured Commercial Member Cost Trends. ” North American Actuarial Journal (forthcoming) October 2006. 29
SOLUCIA, INC. Chronic and Non-chronic Trends Our findings (NAAJ paper) included the presence of “migration bias” that means that non-chronic (or overall) trend isn’t a very good proxy for unmanaged chronic trend.
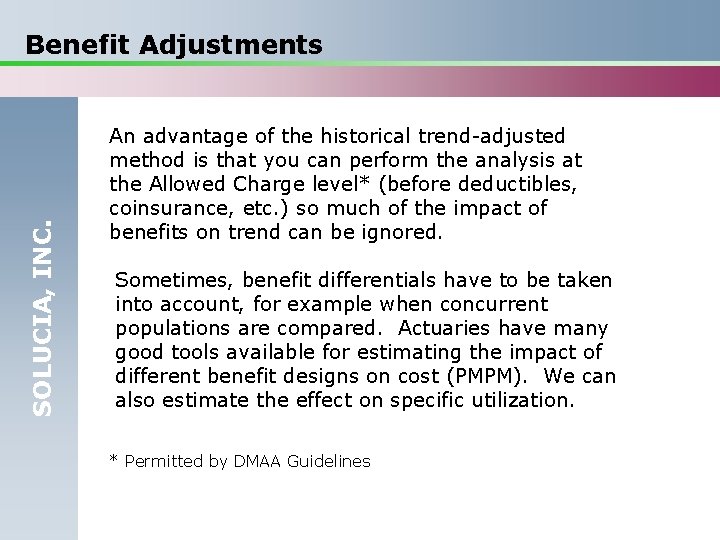
SOLUCIA, INC. Benefit Adjustments An advantage of the historical trend-adjusted method is that you can perform the analysis at the Allowed Charge level* (before deductibles, coinsurance, etc. ) so much of the impact of benefits on trend can be ignored. Sometimes, benefit differentials have to be taken into account, for example when concurrent populations are compared. Actuaries have many good tools available for estimating the impact of different benefit designs on cost (PMPM). We can also estimate the effect on specific utilization. * Permitted by DMAA Guidelines
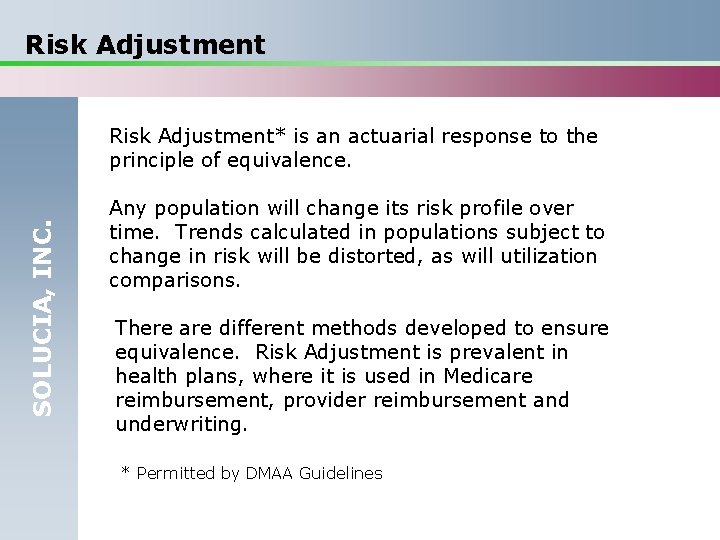
Risk Adjustment SOLUCIA, INC. Risk Adjustment* is an actuarial response to the principle of equivalence. Any population will change its risk profile over time. Trends calculated in populations subject to change in risk will be distorted, as will utilization comparisons. There are different methods developed to ensure equivalence. Risk Adjustment is prevalent in health plans, where it is used in Medicare reimbursement, provider reimbursement and underwriting. * Permitted by DMAA Guidelines
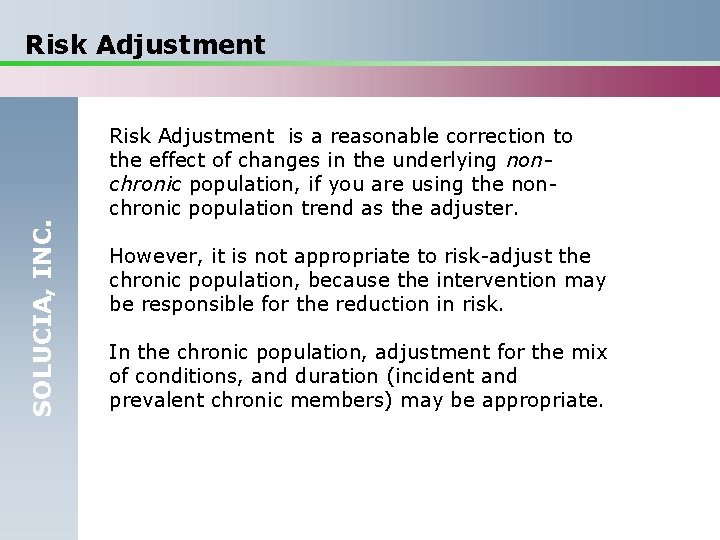
SOLUCIA, INC. Risk Adjustment is a reasonable correction to the effect of changes in the underlying nonchronic population, if you are using the nonchronic population trend as the adjuster. However, it is not appropriate to risk-adjust the chronic population, because the intervention may be responsible for the reduction in risk. In the chronic population, adjustment for the mix of conditions, and duration (incident and prevalent chronic members) may be appropriate.
Validation SOLUCIA, INC. It is a good idea to validate any dollar savings estimates, because there needs to be a demonstrable source of any dollar savings. Primarily, savings should be expected from inpatient admissions. Using whole population admissions for primary chronic conditions only may introduce a reconciliation problem, however.
Validation SOLUCIA, INC. In a Commercial population, the number of members actually managed, and their associated admissions, is small. Because the affected admissions is small, the number is also at risk of being affected by exogenous factors.
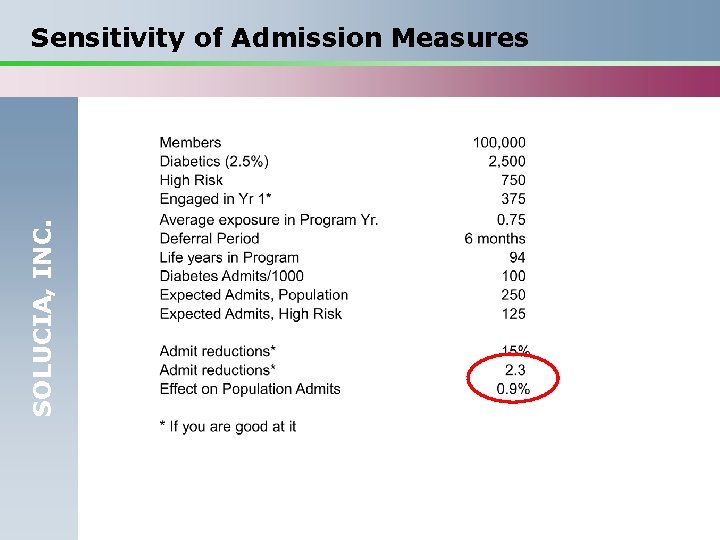
SOLUCIA, INC. Sensitivity of Admission Measures
Sensitivity of Admission Measures SOLUCIA, INC. • You only need 2 claims to be coded differently to change the outcome from success to failure. • What happens if 30 high-risk Diabetics develop a heart condition (and are classified under “heart”)? • What happens if a large new employer group is added? If the employer group does not offer your drug coverage? • What happens if the geographic concentration changes (since utilization is influenced by geographic treatment variations)? P. S. : It only takes 30 new High Risk Diabetics to be added to the pool to add 2 more admissions.
SOLUCIA, INC. Thank you for your time and attention! Ian Duncan, FSA MAAA Solucia Inc. 1477 Park Street, Suite 316 Hartford, CT 06106 860 -951 -4200 iduncan@soluciaconsulting. com