SOLUBILITY GRAPHS READING AND INTERPRETING SOLUBILITY Ability of

SOLUBILITY GRAPHS READING AND INTERPRETING…

SOLUBILITY • Ability of one substance to dissolve into another at a given temperature and pressure. • Amount of solute that will dissolve in a given amount of solvent to produce a saturated solution at a given temperature. – The solubility of salt (Na. Cl) in 100 m. L of water at room temperature is 36 g. • Solubility of a solid solute depends on the nature of the solute and solvent and the temperature of your solvent.

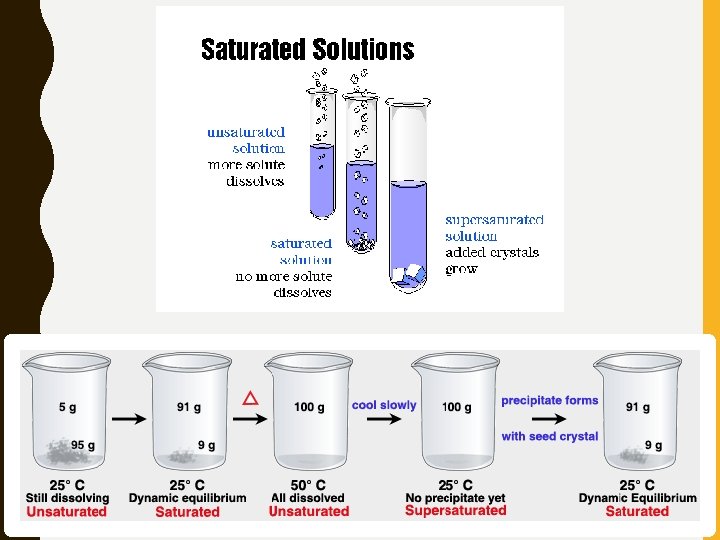
• Saturated – Solvent has dissolved as much solute as it can at a certain temperature • Cannot dissolve any more solute • Unsaturated – Solvent contains less solute than a saturated solution • Able to dissolve more solute • Supersaturated – Contains more solute than it can theoretically hold • Definitely cannot dissolve any more solute

SOLUBILITY GRAPH • The curve shows the # of grams of solute in a saturated solution containing 100 m. L or 100 g of water at a certain temperature.

Solubility Graph • Curve = saturated solution • Below the line = unsaturated solution • Above the line = supersaturated solution

Solubility Graph • Solutes whose curves move upward with increased temperature are typically solids because the solubility of solids increases with increased temperature.

Solubility Graph • Solutes whose curves move downward with increased temperature are typically gases because the solubility of gases decreases with increased temperature.

Solubility Graph • How many grams of KCl can be dissolved in 100 g of water at 50° C? • 40 grams

Solubility Graph • How many grams of NH 4 Cl can be dissolved in 100 g of water at 90° C? • 70 grams

Solubility Graph
- Slides: 11