Solubility Curves Solubility vs Temperature for Solids 140

Solubility Curves

Solubility vs. Temperature for Solids 140 KI 130 Solubility Table • shows the dependence of solubility on temperature Solubility (grams of solute/100 g H 2 O) 120 Na. NO 3 110 gases solids 100 KNO 3 90 80 HCl NH 4 Cl NH 3 KCl 70 60 50 40 30 Na. Cl 20 10 KCl. O 3 SO 2 0 10 20 30 40 50 60 70 80 90 100

How to use a solubility graph? • IDENTIFY A SUBSTANCE ( given the solubility in g/100 cm 3 of water and the temperature) • Look for the intersection of the solubility and temperature.

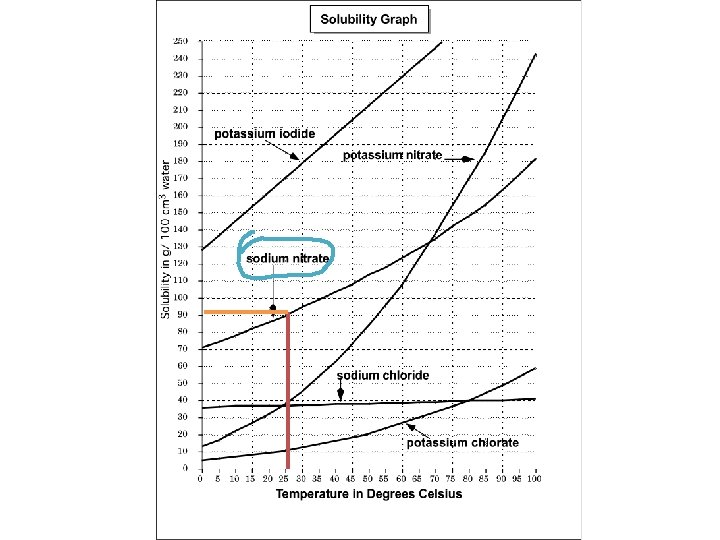
Example: What substance has a 3 solubility of 90 g/100 cm of water at a temperature of 25ºC ?

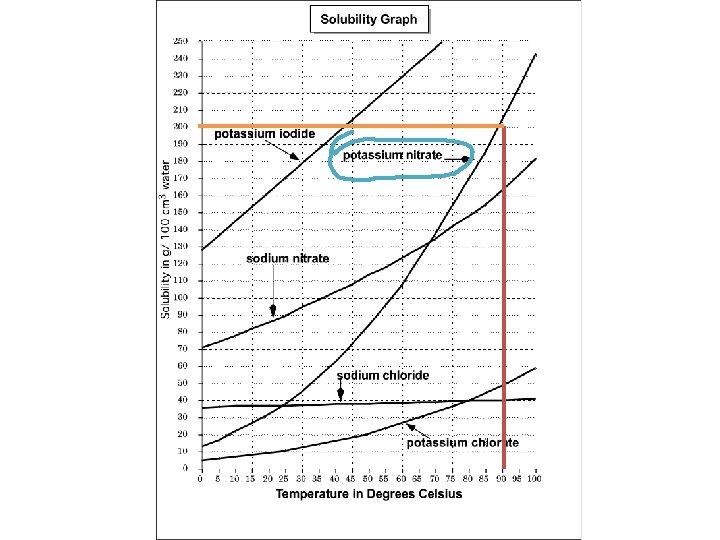
Example: What substance has a 3 solubility of 200 g/100 cm of water at a temperature of 90ºC ?

Another way to use the Solubility graph • Look for the temperature or solubility • Locate the solubility curve needed and see for a given temperature, which solubility it lines up with and visa versa.

• What is the solubility of potassium nitrate at 80ºC ?

At what temperature will sodium nitrate have a solubility of 95 g/100 cm 3 ?

At what temperature will potassium iodide have a solubility of 230 g/100 cm 3 ?

• A solubility curve is a plot of solubility versus temperature. • The line represents a saturated solution. • Points below the line represent unsaturated solutions. • Points above the line represent a supersaturated solution.

Recall: Unsaturated solutions • Solutions that are not yet saturated • i. e. the solvent can still dissolve a further amount of solute. Saturated solutions • Solutions in which additional solute cannot dissolve and excess solute will precipitate. • Maximum amount of dissolved solute at a given temperature and pressure.

Supersaturated solutions: • Sometimes, under special circumstances, a solvent can dissolve more than its maximum amount • This can be achieved by heating a solution, saturating it at a higher temperature, then allowing it to cool • Unstable solutions, any disturbance will usually cause rapid precipitation of the excess solute

Classify as unsaturated, or supersaturated. Solubility vs. Temperature for Solids 140 KI 130 80 g Na. NO 3 @ 30 o. C 45 g KCl @ 60 o. C 50 g NH 3 @ 10 o. C 70 g NH 4 Cl @ 70 o. C =unsaturated =supersaturated Solubility (grams of solute/100 g H 2 O) 120 Per 100 g H 2 O Na. NO 3 110 gases solids 100 KNO 3 90 80 HCl NH 4 Cl NH 3 KCl 70 60 50 40 30 Na. Cl 20 10 KCl. O 3 SO 2 0 10 20 30 40 50 60 70 80 90 100

Solubility Curve for Gases
- Slides: 16