SOLID WASTE EWASTE EWASTE SOLID WASTE STORAGE COLLECTION


hydrogen sulfide,")


 SANITARY LANDFILL Methane flare Groundwater monitoring well Intermediate (daily)")


 * Browns categories * Greens categories")


 plant materials such")


 is an")


- Slides: 67
SOLID WASTE
E-WASTE
E-WASTE
SOLID WASTE: STORAGE, COLLECTION AND DISPOSAL Lecture Outline • • • Solid Waste Act Definitions Solid Waste Disposal Act Sources, types and quantities Environmental Health Problems related to solid waste Methods of Treatment • • • Landfills Incineration Open dumping/ land or sea Composting Grinding and adding to sewage Recycling • Integrated Waste management
SOLID WASTE DISPOSAL ACT • In 1965, The Act was signed by the Congress in recognition of the seriousness of the threat of solid waste to the environment and human health.
SUMMARY OF THE SOLID WASTE ACT • To improve disposal technology • To improve management practices • To support research to new approach for handling solid waste • To support training programs • Federal assistance to achieve these goals.
SOLID WASTE • It is defined as : any useless, unwanted or discarded material. This include: gases such as air pollutants, Liquids : sewage, and solids : refuse.
DEFINITIONS Biodegradable material Is waste material capable of being broken down, usually by bacteria, into basic elements. Most organic wastes are biodegradable. Garbage Is putrescible solid waste including animal and vegetable waste resulting from handling, storage, sale, preparation, cooking, or serving of foods.
DEFINITIONS Industrial waste Is solid waste generated by manufacturing or industrial process. Source reduction Is refers to reducing the amount of waste generated that must eventually by discarded, including minimizing volume of products, and extending the useful life products
DEFINITIONS Leachate Is a liquid resulting from precipitation percolating through landfills containing water, decomposed waste, and bacteria. Municipal Solid Waste It includes non hazardous waste generated in households, commercial establishments, Institutions; it excludes industrial process wastes, agricultural wastes, mining wastes, and sewage sludge.
DEFINITIONS Recycling Is a resource recovery method involving the collection and treatment of waste product for use in manufacturing of the same or another produce. Refuse Is all putrescible (biodegradable) or nonputrescible waste material that is discarded or rejected, including but not limited to, garbage, rubbish, incinerator residue, street cleanings, and dead animals.
SOURCES OF SOLID WASTE 51% 40% 6% Agriculture Mineral Waste 3% Industrial Municipal
SOURCES OF SOLID WASTE • Agriculture 51%: from farms, ranches, this includes: animal manure, pruning trees, residue from harvesting. • Mineral Waste 40% : Includes Rubble, mining , demolishing waste. • Industrial 6%: • Municipal 3%: tires, paper rags, kitchen, yard , cans.
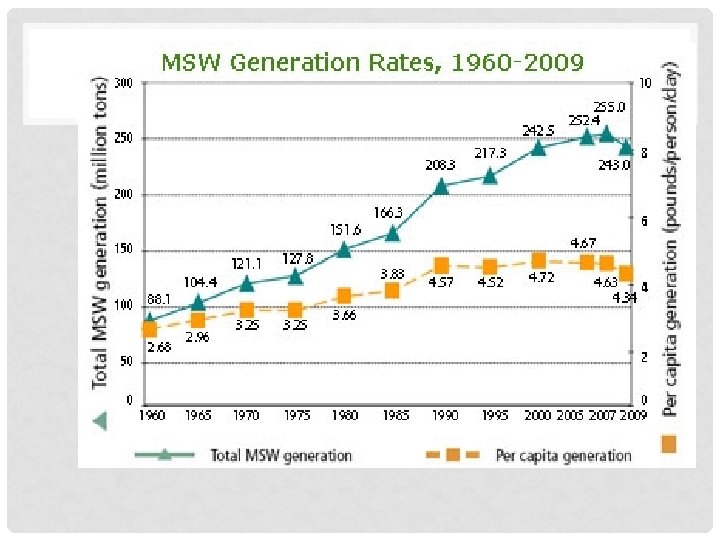
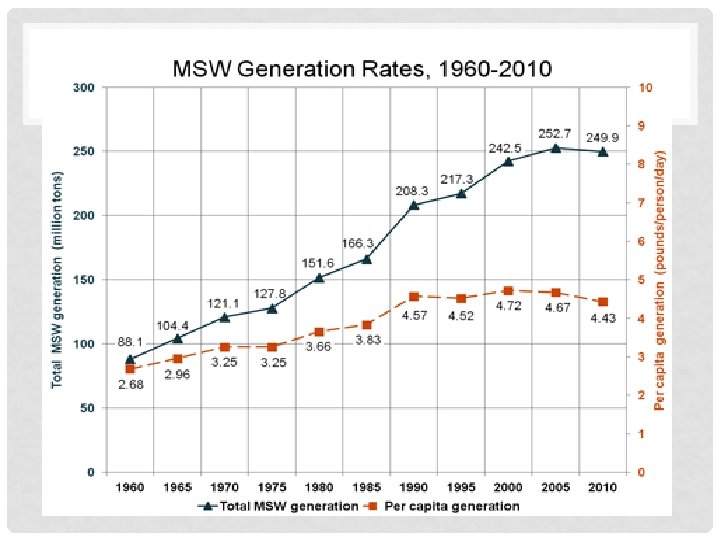
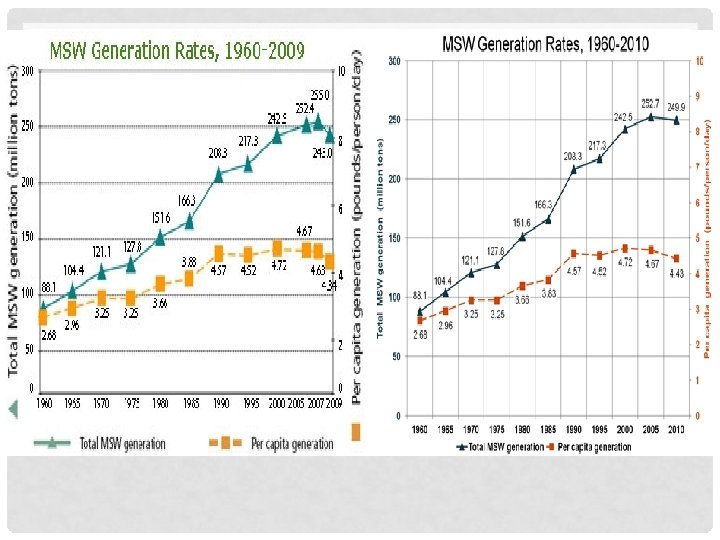
EPA REPORT ON SOLID WASTE /2010 1 • The U. S. Environmental Protection Agency (EPA) has collected and reported data on the generation and disposal of waste in the United States for more than 30 years. • We use this information to measure the success of waste reduction and recycling programs across the country. These facts and figures are current through calendar year 2010.
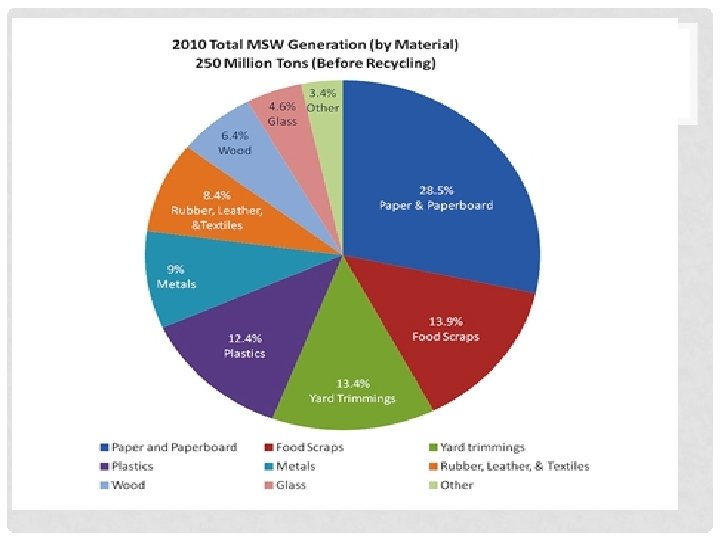
EPA SOLID WASTE /2010 • In 2010, Americans generated about 250 million tons of trash, and recycled and composted over 85 million tons of this material, equivalent to a 34. 1% recycling rate. On average, we recycled and composted 1. 51 pounds out of our individual waste generation of 4. 43 pounds person per day.
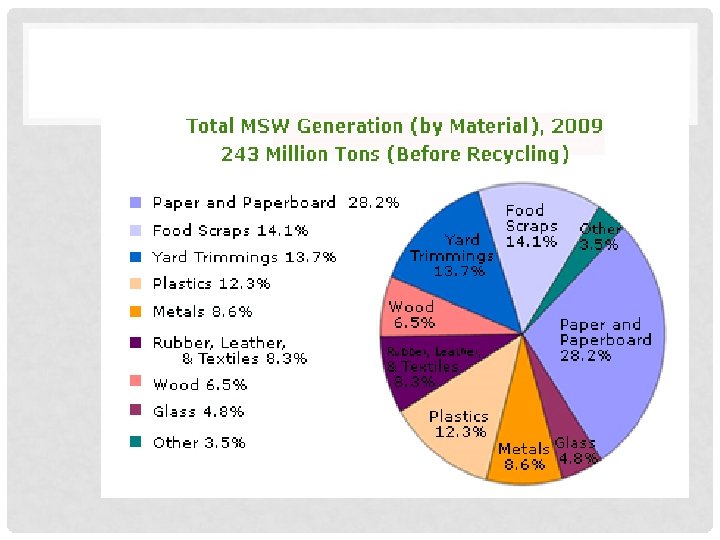
TYPES OF WASTE plastic 12% food 14% others 10% wood, rubber, textile 14% metal 11% yard waste 9% Paper 30%
EP
• EPA 2009
ENVIRONMENTAL HEALTH PROBLEMS RELATED SOLID WASTE • Chemical Hazards: pesticides, toxic fumes, gases)hydrogen sulfide, methane). • Direct contact, broken glass, pathological waste(salvaging) • Air, water, soil pollution • Breeding places for insects, rodents
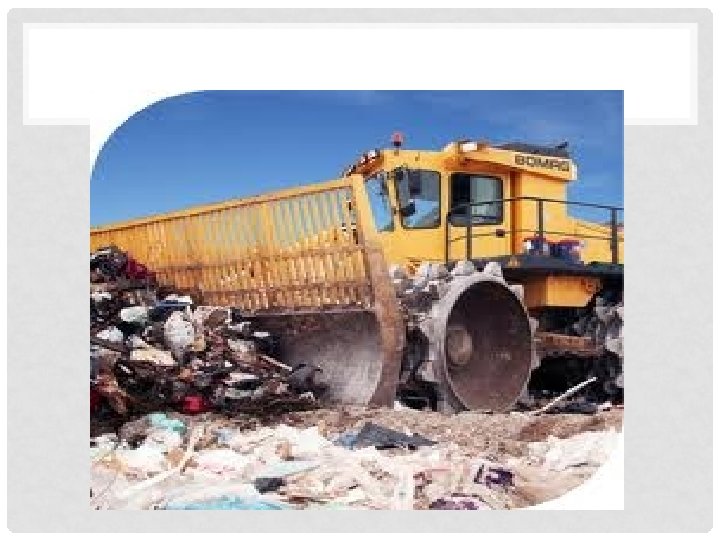
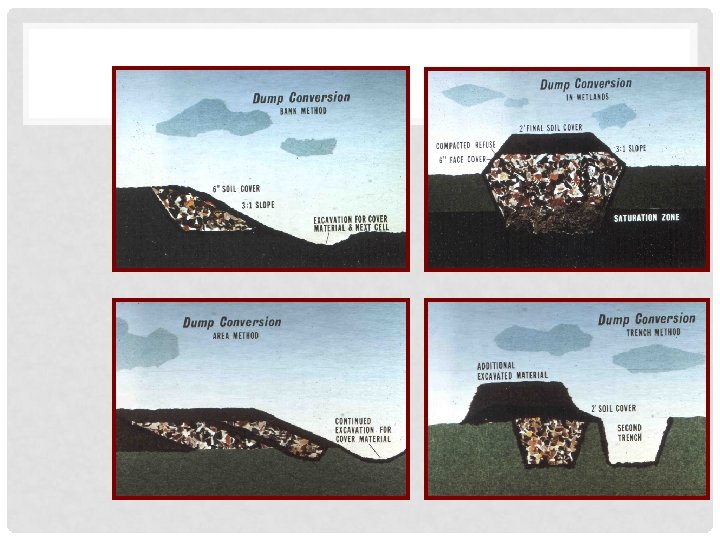
TREATMENT AND DISPOSAL OF SOLID WASTES I. Sanitary Landfill Is a method of disposing of refuse on land without creating nuisances or hazards to public health or safety. Careful preparation of the fill area, including the use of clay and/or synthetic liners and control of water drainage are required to ensure proper landfilling.
I- SANITARY LANDFILL n It is the most economical if land is available at reasonable price, low capital investment n It accepts all types of solid waste n Land reclamation n Moderate operating cost
I- SANITARY LANDFILL • Disadvantages: • Requires top daily cover which might be costly • Water and air pollution, breeding places for vectors of disease if improperly managed
ITopsoil and vegetation (final cap) SANITARY LANDFILL Methane flare Groundwater monitoring well Intermediate (daily) cover MSW Filter material MSW Drainage material for Leachate collection system Synthetic liner Compacted soil (Upper composite liner) Drainage material Leachate Collection pipe Synthetic liner Compacted soil (Bottom composite liner) Natural soil foundation
I- SANITARY LANDFILL
I- SANITARY LANDFILL
II. INCINERATION Is a controlled combustion process for burning solid, liquid, or gaseous combustible waste to gases and residue containing little or no combustible material when properly carried out. • High-temperature incineration is carried out at 3000 0 F to 3400 0 F (1649 to 1871 0 C).
II. INCINERATION n Advantages n can be very efficient n decrease waste volume n can be located close to residential areas, safe transportation cost n source of energy such as steam
II. INCINERATION • Disadvantages : • Air pollution • Ashes might be considered hazardous waste due to high contents of metals • High capital investment • Expensive to operate and maintain
II. INCINERATION
III. OPEN DUMPING The open dump is all too common and need no explanation. It is never satisfactory. Refuse is generally spread over a large area, providing a source of food and harborage of rats, flies.
III. OPEN DUMPING n It is Illegal n Optimum for breeding rats, insects, n Accessible to birds, wild animals, n Fires, air and water pollution
IV. COMPOSTING Is the controlled biological decomposition of organic solid waste under aerobic (in the presence of oxygen) conditions. Organic waste material are transformed in to soil amendments as humus or mulch.
IV. COMPOSTING NEEDS Air Water Food (Organic materials) * Browns categories * Greens categories
IV. COMPOSTING WHAT TO COMPOST Grass/lawn clipping Hay Kitchen wastes Leaves Manure Straw Weeds and other garden wastes Wood chips and sawdust
IV. COMPOSTING Browns categories : • Are dry and dead plant material such as straw, dry brown weeds, autumn leaves and wood chips or sawdust. • Need to be moistened before they are put into a compost system.
IV. COMPOSTING Greens categories : • Are fresh (and often green) plant materials such as green weeds from the garden, kitchen fruit and vegetable scraps, green leaves, coffee grounds and tea bags, fresh horse manure, etc. • Have more nitrogen than browns. A good mix of browns and greens is the best nutritional balance for microbes.
IV. COMPOSTING WHAT NOT TO COMPOST Chemically-treated wood products Human wastes Meat, bones, and fatty food wastes Pet wastes
IV. COMPOSTING SYSTEMS One Bin Systems Two Bin and Three Bin Systems Rotating or Tumbling Systems Sheet or Trench Systems Commercially Available Bin Systems
V. GRINDING AND ADDING TO SEWAGE Is an acceptable method of garbage “disposal”. It is recommended from a convenience and public health standpoint, but the disposal of other refuse remains to be handled. It adds to the BOD load (50% more)of sewage treatment plants
VI. HOG FEEDING Garbage is fed to hogs, careful supervision is necessary. Disadvantages : Can spread many diseases to man when uncooked garbage is fed to hogs, such as trichinosis, hog cholera, food-andmouth diseases.
VII - PYROLYSIS As applied to solid wastes (metal and glass removed) is an experimental thermo chemical process for the conversion of complex organic solids, in the absence of added oxygen, to water, combustible gases, tarry liquids
VIII. DUMPING AT SEA The dumping of garbage and other refuse at sea is prohibited in United States. When dumping at sea permitted, all garbage and other refuse is dumped into large garbage scows or barges.
OPEN DUMP/NATIONAL GEOGRAPHIC
SALVAGING/ NATIONAL GEOGRAPHIC
FLOATING TRASH/NATIONAL GEOGRAPHIC
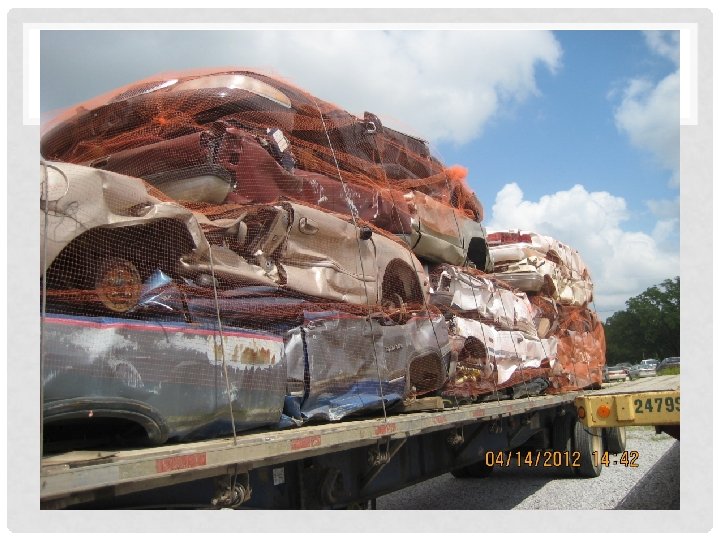
IX. RECYCLING Is a resource recovery method involving the collection and treatment a waste product for use as raw material in the manufacture of the same or another produce.
E-WASTE
E-WASTE • Waste from used electrical and electronic equipment – commonly known as e-waste or WEEE – is one of the fastest growing solid waste streams around the world today • World Wide: • 2007 60 million tons • 2015 >500 million toms of which 113 will be recycled
EPA: MOST OF E-WASTE IS TRASHED
E-WASTE
AMOUNTS GENERATED • EPA estimates that, in 2009, US consumers and businesses discarded televisions, computers, cell phones and hard copy peripherals (including printers, scanners, faxes) totaling 2. 37 million tons. • Approximately 25 percent of these electronics were collected for recycling, with the remainder disposed of primarily in landfills, where the precious metals cannot be recovered.
E- WASTE Harm to human Health • Open air burning • Acid baths • Toxic material contaminating water, air , food and soil, • These practices can expose workers to high levels of contaminants such as lead, mercury, cadmium and arsenic, which can lead to irreversible health effects, including cancers, miscarriages, neurological damage.
E-WASTE
RECYCLING RATES
MSW RECYCLING RATES, 1960 -2009 This line graph depicts waste recycling rates in the U. S. from 1960 to 2009, in both percentage and tons. • In 1960, the recycling rate was 6. 4%, and 5. 6 million tons of materials were recycled. • In 1965, the recycling rate was 6. 2%, and 6. 5 million tons of materials were recycled. • In 1970, the recycling rate was 6. 6%, and 8. 0 million tons of materials were recycled. • In 1975, the recycling rate was 7. 3%, and 9. 3 million tons of materials were recycled. • In 1980, the recycling rate was 9. 6%, and 14. 5 million tons of materials were recycled.
MSW RECYCLING RATES, 1960 -2009 • In 1985, the recycling rate was 10. 1%, and 16. 7 million tons of materials were recycled. • In 1990, the recycling rate was 16. 0%, and 33. 2 million tons of materials were recycled. • In 1995, the recycling rate was 25. 7%, and 55. 8 million tons of materials were recycled. • In 2000, the recycling rate was 28. 6%, and 69. 5 million tons of materials were recycled. • In 2005, the recycling rate was 31. 6% and 79. 9 million tons of materials were recycled. • In 2007, the recycling rate was 33. 3% and 84. 8 million tons of materials were recycled. • In 2009, the recycling rate was 33. 8% and 82. 0 million tons of materials were recycled.
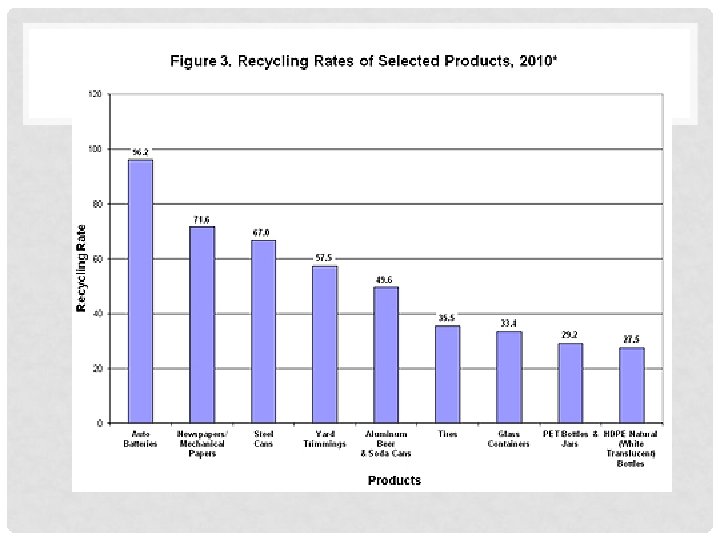
MSW RECYCLING RATES, 1960 -2009 • Recycling Rates of Selected Materials, 2009 • This bar graph depicts the recycling rates of selected materials in 2008. The recycling rates are as follows: • • Auto Batteries: 95. 7% Office Type Papers: 74. 2% Steel Cans: 66. 0% Yard Trimmings: 59. 9% Aluminum Beer and Soft Drink Cans: 50. 7% Tires: 35. 3% Glass Containers: 31. 1%
INTEGRATED WASTE MANAGEMENT REDUCE RECYCLE INCINERATE LANDFILL