Solar Radiation Source Hertzprung Russel Diagram Solar structure


- Slides: 21
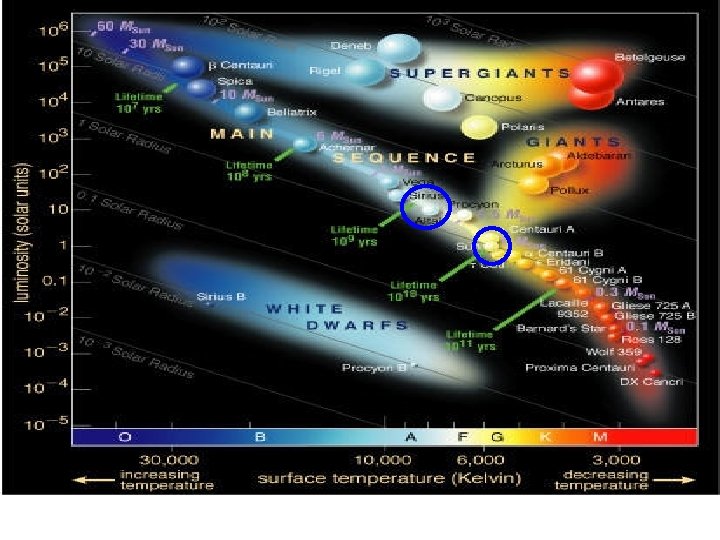
Solar Radiation • Source – – Hertzprung Russel Diagram Solar structure Sunspots Solar spectrum 1 • Interaction with Earth’s atmosphere – Solar spectrum – Atmospheric Impact – Aurora
Solar Radiation Sun - typical main sequence dwarf star Ro = 6. 95 x 105 km, Mo = 2 x 1030 kg 71% H, 26. 5% He, 2. 5% heavier metals Mean earth sun distance 1. 496 x 108 km Core out to 0. 25 Ro Temperature ~ 107 K Hot enough to cause fusion of H in to He provides energy for the sun. Energy transfer by radiation, temperature ~ 106 K, ~0. 7 Ro Final ~0. 3 Ro energy transfer by convection violent small scale (103 km) mixing process granulation Photosphere ~ 1000 km thick, dominant source of solar radiation - relatively continuous emission determines sun's blackbody temperature, 5800 K. Sunspots here. Chromosphere - 5000 - 10, 000 km thick, temperature ~ 105 - 106 K. Radiation from emission lines from H, He, Ca. Corona - region above chromosphere, extending out for several solar diameters, temperature ~ 106 K. Prominences, Solar flares appear here. Origin of solar wind. Most solar energy in the continuum is from nonquantized electronic transitions (free - free, bound - free transitions)
Sunspots • Properties – Dark regions in photosphere with diameters of 103 – 105 km, ~3000 K, cooler than photosphere by nearly 50%. – Never cover more than 0. 2% of solar surface and persist ~ a week. – Number 1 to > 50 in 11 year cycle minimum to minimum. • Causes – Variations in magnetic activity from interactions between convection, solar rotation, and magnetic field. – Have magnetic fields up to 4000 Gauss. – Polarity in sunspot pairs reverses every solar cycle so complete sunspot cycle is sometimes said to be 22 years.
Sunspots • Associated disturbances – Faculae: Enhanced photospheric emission surrounding sunspots precede and follow sunspots. – Plages of Flocculi: Bright areas in chromosphere, precede and follow sunspots, occasionally brighten to solar flares. – Solar flares - intense (minutes to hours) eruptive phenomena, accompanied by rapid enhancement of emission of ionizing radiation, EUV (Extreme UV) and X-rays, cause terrestrial magnetic disturbances and radio fadeouts. – Prominences - filament like protuberance extending from chromosphere, photospheric eruptions causing large stable clouds of gas in upper part of chromosphere. More occur at solar maximum. – Corona is more irregular at sunspot maximum. – Measurable solar variability is limited to < 240 nm. At larger wavelengths the variations are less than instrumental uncertainty.
http: //blog. ltc. arizona. edu/azmasternaturalist/Sunspot%20 cycle. JPG http: //www. pmodwrc. ch/tsi/composite/pics/org_comp 2_d 41_62_1009. png
http: //solarscience. msfc. nasa. gov/images/ssn_predict_l. gif
http: //solarscience. msfc. nasa. gov/ima ges/ssn_predict_l. gif Measurable solar variability is limited to < 240 nm. At larger wavelengths the variations are less than instrumental uncertainty.
Solar spectrum • • • X-rays, < 1 nm. Variations of > 1000 observed 0. 1 - 0. 8 nm over a solar cycle or during solar flares. Extreme UV measurements, SOHO Below 140 nm emission from chromosphere and corona dominant. Lyman alpha, 120 nm, carries more energy than rest of spectra < 100 nm during quiet sun periods. As increases from 120 to 300 nm the solar radiance source moves from chromosphere to photosphere, and solar variations diminish to undetectability. Fraunhoffer lines a cold gas between a source and observer will absorb radiation ( > 200 nm). A hot gas will emit radiation ( < 200 nm).
Fraunhoffer Lines Fe Na O 2 H – Balmer series • First observed by Wollatson (1802). Fraunhoffer independently discovered them in 1814 and studied them thoroughly. • The continuous emission of photosphere is interrupted by selective absorption and re-emission in upper photosphere. Seen in visible and IR spectra only as absorption lines. Lines at < 185 nm appear in emission. • Fraunhoffer mapped over 570 lines. Later these lines were associated with atoms/molecules in the upper solar atmosphere.
Atmospheric absorption of solar radiation • Only photons corresponding to changes in discrete energy states are absorbed absorption appears as a series of discrete lines, or absorption bands. • Atmospheric molecules are characterized by discrete – Electronic transitions, ionization, disassociation • Relatively high energies, several e. V <= UV, few transitions in the visible. • These transitions induce photochemistry. • Less than 1% of solar photons at <= UV. – Vibrational and rotational energy states. • Lower energy so appear for >= IR. • Primary impacts on thermal structure of the atmosphere, so important for meterorology, and for radiative heat balance.
Solar radiation photochemistry, < 4 m • Photochemical consequences – X-rays ionization of oxygen/nitrogen, D region thermosphere. – 122 nm, Lyman α, absorbed by O 2 in mesosphere. – 100 -175 nm, Schumann-Runge continuum, absorption by O 2 in mesosphere. – 175 -200 nm, Schumann-Runge bands, absorption by O 2 in mesosphere. – 200 -242 nm, Herzberg continuum, absorption by O 2 in stratsophere. – 242 -310 nm O 3 Hartley band, absorption by O 3 in stratosphere leading to formation of O(1 d). – 310 -400 nm, O 3 Huggins bands, absorption by O 3 in stratosphere/troposphere leading to formation of O(3 P). – Penetration of solar radiation into the earth's atmosphere depends on atmospheric composition and absorption bands.
Solar radiation thermal impacts, < 4 m • Thermal consequences – Thermosphere and upper mesosphere: absorption of UV by O 2, O, N 2, and N. – Lower mesosphere and stratosphere: absorption of UV by O 3. As ozone diminishes IR radiation from CO 2 causes cooling to the mesopause. The presence of ozone in the stratosphere forms the tropopause, where the convectively forced layer of the atmosphere stops. • Absorbed energy is converted to thermal energy through chemical reactions in the presence of a third body. When photodissasociated O atoms recombine to O 2 and O 3, the excess energy is carried away by a third body as kinetic energy, or temperature increase. • This heating by absorption is balanced by cooling through IR emission from CO 2 (15 m), O 3 (9. 6 m), and H 2 O (80 m). – Troposphere, temperature controlled more by thermodynamics and dynamics than by radiation.
Primary atmospheric molecules involved in absorption of radiation • Atmospheric molecules are characterized by discrete rotational and vibrational energy states in addition to the electronic transitions. • Transitions – Electronic – Ionization, dissasociation – UV some visible. – Vibrational – IR, far IR – Rotational – far IR, microwave • The lower energy states significantly impact terrestrial radiation, which peaks in the IR. Bohren and Clothiaux, 2006
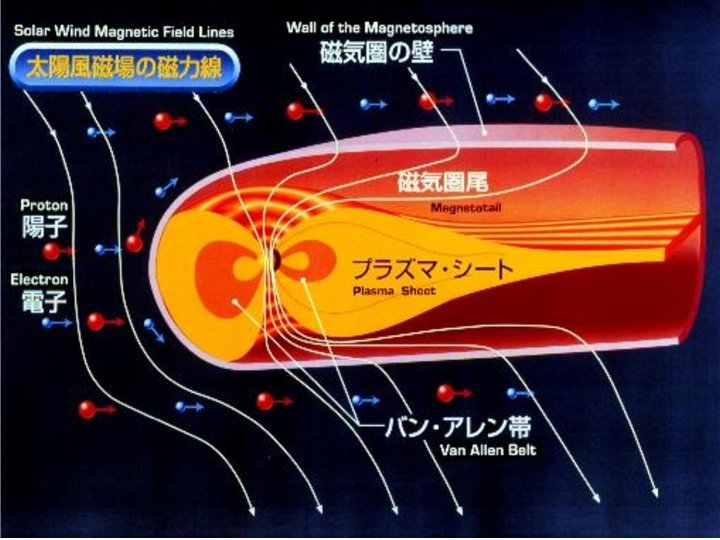
Aurora • Caused by interaction of solar wind with oxygen and nitrogen in thermosphere.
Solar Wind Animation Courtesy: http: //www. douglas-davis. com/energy. htm
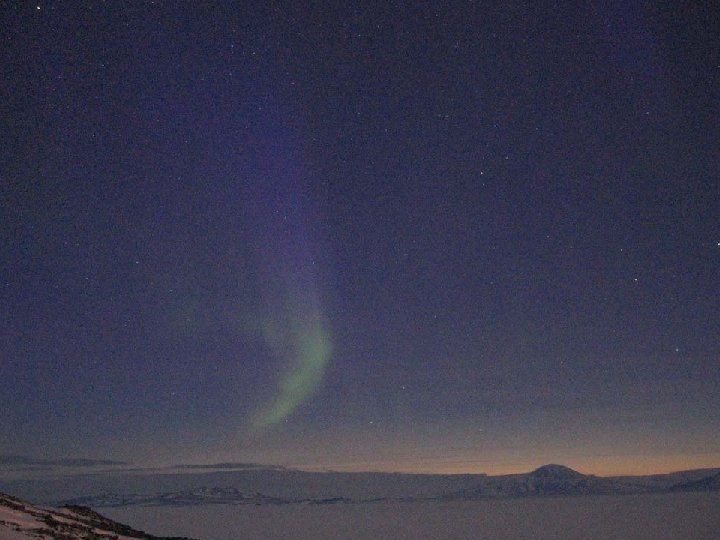
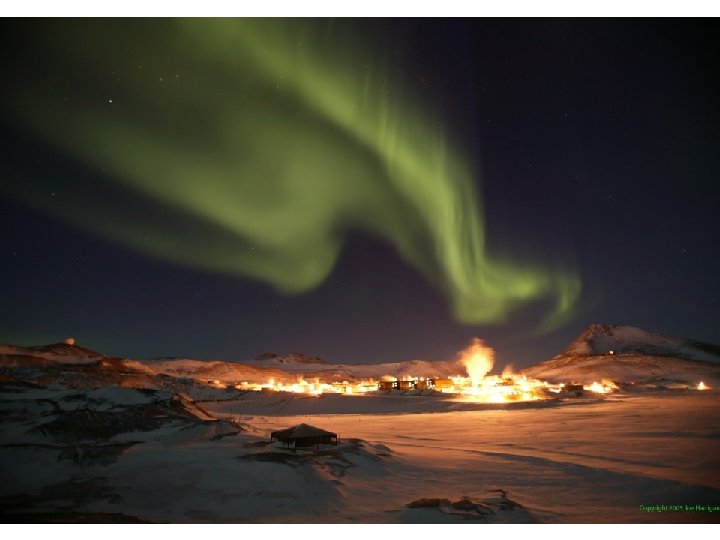
Aurora near Aurora far – Hut Point Aurora all sky comet
Aurora • Caused by interaction of solar wind with oxygen and nitrogen in thermosphere. • Color indicates level of electronic excitation. – Green (most common) or brownish red – Oxygen returning to ground state. – Red – Nitrogen returning to ground state. – Blue – Nitrogen regaining an electron after ionization. • Auroral pictures – aurora near, aurora far – Hut Point, aurora all sky,