Solar Luminosity How Bright the star Twinkles Hotter

Solar Luminosity- How Bright the star Twinkles • Hotter temperature = more light flux • Increases in Luminosity seems to be linked to sunspot activity (sunspots are a little dimmer counter intuitive, but brighter spots make up for dimmer spots) Sunspot activity: cycles every 11 years or so… Total luminosity of sun is ~. 036% higher in 1996 than in 1986 could suggest that each sunspot cycle results in higher total irradiance Each cycle has little effect, but over centuries… it adds up especially on the time scales that are being talked about Geological Timescale – Since sun formed ~4. 6 Billion years ago, luminosity has increased ~30%, but in the past million years, the change has been less than 3%. – Raises questions: 25% decrease in luminosity= oceans freeze. . “Contemporary Time Scale” In 1645 -1705 lack of sunspot activity = “little ice age” temp drop of ~1 deg C • • • Eric Roy http: //www. xs 4 all. nl/~carlkop/solar. html (Columbia Prof)

Black Body Radiation 5000 3000 2000 1000 500 300

Wikipedia. org

Flux from a “black body” S= k. T 4 , k=5. 67 x 10 -8 watts/m 2 K 4 (Wien’s law) 6000 K Sun 279 K 1370 Watts/m 2 1. 5 x 10¹¹ m EARTH 342 Watts/m 2 6378 km = r
 = 2. 9 x 10⁶/T 278")
max (nm) = 2. 9 x 10⁶/T 278

Tavg. = 288 K !! http: //www. ipcc. ch/

http: //www. ipcc. ch/

http: //www. ipcc. ch/

World Carbon Dioxide Emissions • • • North America: 27. 2% Central and South America: 4. 1% Europe (including all Russia): 27. 7% Middle East (petroleum producing nations): 4. 7% Africa: 3. 8% Asia and Oceania: 32. 5% www. eia. doe. gov/iea/carbon. html www. volker-quaschuning. de

Keeling, C. D. and T. P. Whorf. 2005. Atmospheric CO 2 records from sites in the SIO air sampling network. In Trends: A Compendium of Data on Global Change. Carbon Dioxide Information Analysis Center, Oak Ridge National Laboratory, U. S. Department of Energy, Oak Ridge, Tenn. , U. S. A.

http: //www. ipcc. ch/

The Role of Water Vapor and Clouds on Climate Water Vapor : The main heat-trapping gas in the lower atmosphere Clouds : Formed when water vapor in the air condenses ~ Clouds cool Earth by reflecting incident sunlight into space ~ Clouds warm Earth by absorbing the heat released from the ground and reradiating this heat back down to the planet The mean distribution of total atmospheric water vapor above the Earth’s surface (1992). http: //okfirst. ocs. ou. edu/train/meteorology/Energy. Budget 2. html http: //www. agu. org/sci_soc/mockler. html

Albedo Effect - reflectance of incident sunlight by clouds, ice, snow, and light colored surfaces - strongly correlated to the color of the surface - feedback effects 31% of light reflected Back into space Ice/Snow
 – – – Wetlands 150 Other")
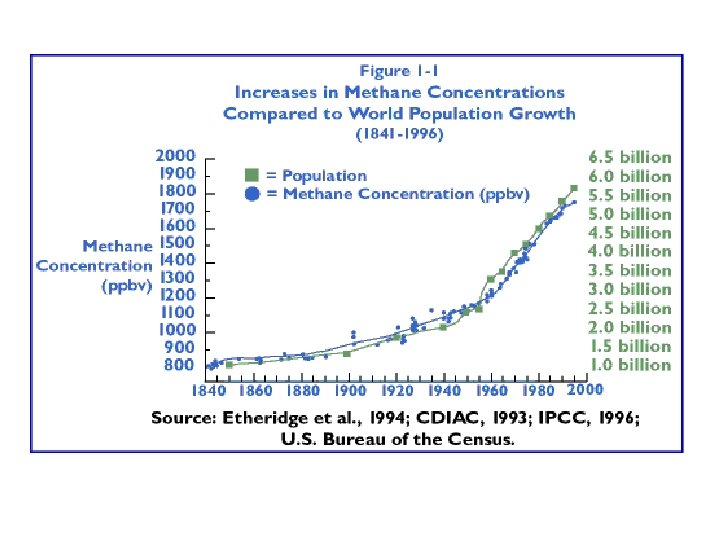
• Methane Sources and Sinks Sources (Mt/year) – – – Wetlands 150 Other Sources Oceans, lakes 35 Cattle 120 Rice Paddies 95 Other Sources 150 Natural Gas Leaks? ? ? Rice Paddies • Sinks – CH 4 + OH ----> CH 3 + H 2 O Wetlands Oceans, lakes Cattle • Sources > Sinks resulting in about a 1 -2% annual increase

http: //www. ipcc. ch/

Methane Clathrites • • • What are Methane Clathrites – Methane Hydrates in ice. – Contains high concentration of C-12 55 Million years ago and the PETM. Methane-burp theory – Escape and formation of CO 2 • Evidence • What caused it? Why does it have a big impact? – Positive feedback loop. How was it reversed? www. newsfromrussia. com Sources Schiermeier, Quirin. 2003. The mechanisms that helped bring down temperatures in the past are still active today. Nature. Vol 423. Pages 681 -682.

Methane Hydrates It is estimated that the energy locked up in methane hydrate deposits is more than twice the global reserves of all conventional gas, oil, and coal deposits combined. In order to form and remain stable, methane hydrates need some very specific conditions to be met. If the conditions are not met, the hydrate will dissociate into water and methane gas. The three factors what control stability are an adequate supply of water and methane, suitable temperature and pressure, geochemical conditions, suitable temperatures and pressures, and geochemical conditions. A hydrate will form if 70% of the cavities within the hydrate lattice are filled. Obviously water is always abundant, as it saturates most of the sediment on earth. Methane formation occurs in two ways. Biogenic methane is a by product of bacterial ingestion and is also produced in swamps, landfills, and rice paddies. Thermogenic methane is produced by the combination of heat, pressure, and time on a buried organic material. Both forms of methane are trapped in the sea floor and the gas will combine with water to form the hydrate. There a few geochemical processes that restrict or increase stability and formation of a hydrate. A high salinity will restrict the formation of methane hydrate. The presence of natural gasses like carbon dioxide, hydrogen sulfide, and larger hydrocarbons, will increase the stability of hydrates. Matt Aschaffenburg http: //www. llnl. gov/str/Durham. html http: //www. ornl. gov/info/reporter/no 16/methane. htm

http: //www. ipcc. ch/

http: //www. ipcc. ch/
 Methane (CH 4) Nitrous oxide (N 2 O) Hydrofluorocarbon")
Gas Carbon dioxide (CO 2) Methane (CH 4) Nitrous oxide (N 2 O) Hydrofluorocarbon HFC-32 HFC-41 HFC-43 -10 mee HFC-125 HFC-134 a HFC-143 a HFC-152 a GWP 1 21 310 11, 700 650 1, 300 2, 800 1, 000 1, 300 3, 800 140

Global Circulation • Warm air olds more moisure than cold air, and moist air retains heat longer than dry air. • The sun warms air at the equator, as the air gets warmer it rises, spreads out, and cools (adiabatic cooling) • This cooled air then goes poleward and drops at 30° • Air warms as it drops, so it picks up moisture, deserts occur at 30° • Equatorial air is replaced by winds coming in from the 30°s (tradewinds) • Wind moves poleward along the earths surface between 30 and 60 • Coriolis Force causes the “westerlies” • Water has a higher specific heat than air • Air coming off the water in Northern areas(California, • England) will be warmer than the land, so as it goes over the land cools it drops moisture. • During the summer, the land may be warmer than the water, so the air picks up moisture as it moves over the land creating wet winters and dry summers.

Overall patterns
 Historical and predicted integrated CO 2 production and resultant atmospheric CO 2 concentration")
1) Historical and predicted integrated CO 2 production and resultant atmospheric CO 2 concentration assuming no interaction with the ocean.

CO 2 SOLUBILITY IN THE WORLD’S OCEANS Gas He Ne N 2 O 2 Ar Kr Xe Rn CO 2 N 2 O Molecular Weight (g/mol) 4 20 28 32 40 84 131 222 44 44 Diffusion Coefficient (x 10^-5 cm 2/sec) Sx. D (gas) 0˚C 24˚C Sx. D (O 2) 2. 0 1. 4 1. 1 1. 2 0. 8 0. 7 1. 0 4. 0 2. 8 2. 1 2. 3 1. 5 1. 4 1. 9 2. 0 0. 54 0. 45 1. 00 0. 72 1. 2 2. 5 4. 8 23 18 Molecular diffusion rates of various gases in seawater (35% salinity) Broecker, W. S. , Peng, T. -H. Tracers in the Sea. New York: Eldigio Press, 1982.

http: //www. ssec. wisc. edu/data/sst/latest_sst. gif http: //oceanworld. tamu. edu/resources/ocng_textbook/chapter 13_03. htm

Ocean circulation model • mixing time is 1000 years!

Predicted atmospheric CO 2 concentrations for four different ocean mixing scenarios. The current atmospheric CO 2 concentration is marked with an X.

http: //www. ipcc. ch/

http: //www. ipcc. ch/

FAQ 8. 1, Figure 1

Figure 10. 1

Figure 11. 11

Figure 11. 12

Figure 11. 13

FAQ 9. 2, Figure 1

Figure 10. 4

http: //www. ipcc. ch/

http: //www. ipcc. ch/

Figure 10. 12

Ocean Currents: By Tom Reznick • Forces Affecting Ocean Currents: – Wind – Solar Heating – Gravity – Coriolis Force • 12/13/2021 Effect of Current on Global Climate: – Ocean Current Warming • Heats High Northern Latitudes – Europe – Gulf Stream 41

Temperature of the Earth over Geologic Time Past 120 Years Methods for Determining Past Climates End of Little Ice Age Geochemical (18 O/16 O, Ca. CO 3) Sedimentary Rocks (evaporites, glacial deposits) Fossils (organisms that lived in limited climates) NASA, Goddard Institute for Space Studies http: //data. giss. nasa. gov/gistemp/graphs/Fig. A_lrg. gif Past 1, 000 Years http: //arjournals. annualreviews. org/doi/pdf/ 10. 1146/annurev. ea. 050177. 001535 Past 18, 000 Years Medieval Warming Holocene Max Medieval Warming Little Ice Age Australian Government, Bureau of Meteorology http: //www. bom. gov. au/info/climate/change/gallery/50. shtml GE 131 Lecture by Jennifer Shosa, Colby College Geology Department

Historical Evidence of Abrupt Climate Change • Throughout the past century, various models and hypothesis (many erroneous and chaos-theory oriented) • Scandinavian lakes and bogs. 14 C and biological evidence. Oscillation of temperatures 12, 000 years ago. Younger Dryas • Hans Suess. 1˚C/1000 years • O isotopes in ice. Saw tooth pattern. 90, 000 year glacial build up • Early ‘ 90’s-Greenland. 7˚C warming, 50 years. Evidence around globe. Younger Dryas confirmed. • Clatharates-particular era of warm. 55 million years ago • Intergalcial, 14˚C drop in 10 years. Lasted for 70 years. • Ice core-Vostok Antarctica; currently in an unusually sustained period of warmth. CO 2 and greenhouse production? http: //www. aip. org/history/climate/rapid. htm#a_Bryson

Abrupt Climate Change Ice core evidence of abrupt climate change http: //www. pnas. org/cgi/content/full/97/4/1331? ijkey=Jifxl. JJn. HUR 2 Q

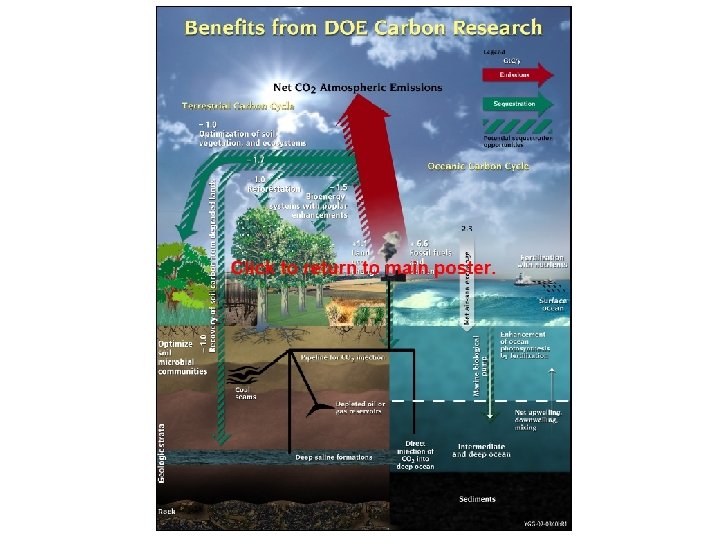
Climate Engineering • Change radiative flux • Increase outgoing solar radiation via CO 2 reduction • Decrease absorbed solar radiation • Albedo: aerosols, space-based technology • Carbon capture • Forests, oceans Sources: Matthews, B. 1996. A critical review of proposals, their scientific and political context, and possible impacts. Scienctists for Global Responsibilty. http: //www. chooseclimate. org Keith, D. W. 2000. Geoengineering the climate: History and prospect. Annual review of energy and the environment 25: 245 -284
- Slides: 46