Solar Indices and What they Mean to You


- Slides: 11
Solar Indices and What they Mean to You
March 11 th at 16: 22 UT
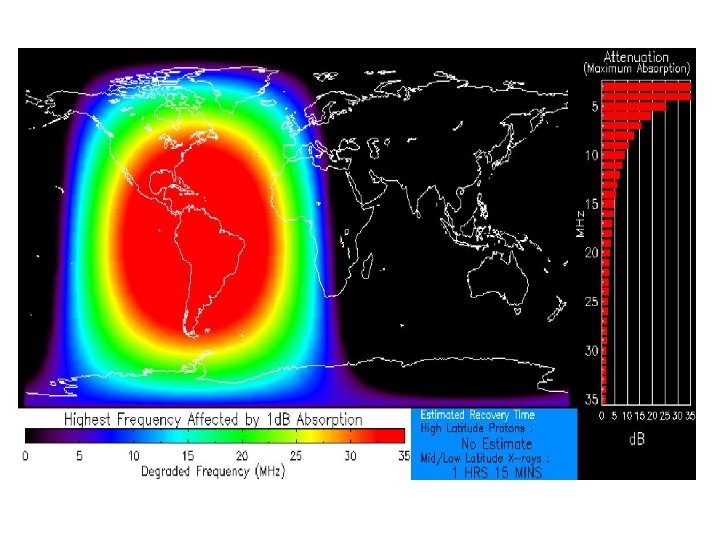
In New Mexico, amateur radio astronomer Thomas Ashcraft was observing the sun using a wideband spectrograph when the flare occured. The radio blackout was obvious at every frequency from 15 MHz to 26 MHz: "The X-flare scrambled the ionosphere thoroughly so that no decametric radio signals were supported in my part of the world, " says Ashcraft. "The ionosphere started to reform after about fifteen minutes when stations began to reappear. (The stuff visible during the blackout was my own observatory electricity. Nothing exterior. )"
Solar Indices Described Normally discussed indices: - A Index. - - Geomagnetic field measurements from stations around the world. Daily average level of 3 -hour geomagnetic activity reports from around the world. Usually 1 -100 scale (sometimes more in extreme solar events). - 3 -hour averages of quiet day max magnetometer horiz flux. 1 -9 scale (5+ indicates geomagnetic storm). Normally indicates noise below 10 MHz. - Emitted from sun’s upper chromosphere/lower corona) - Correlates with sunspot number and UV/visible irradiance. Higher number usually indicates higher MUF/usually affects freqs above 10 MHz. - - - K Index. Solar Flux (or 10. 7 cm/2800 MHz Solar Radio Flux). - Just above sunspot region (photosphere).
Solar Indices Described Normally discussed indices: - Geomagnetic Storms. - - - Earth’s magnetosphere disturbance from solar wind/CME interaction with magnetosphere. Aurora, disrupt GPS signals, satellite drag increase. Solar Flares. - Large solar energy outbursts caused by magnetic reconnection events after CMEs. - Imagine a BILLION ton solar burp. Think atomic blast. Enhance D layer absorption at lower freqs. “Usually” affect freqs below 10 MHz, “can” enhance higher freqs.
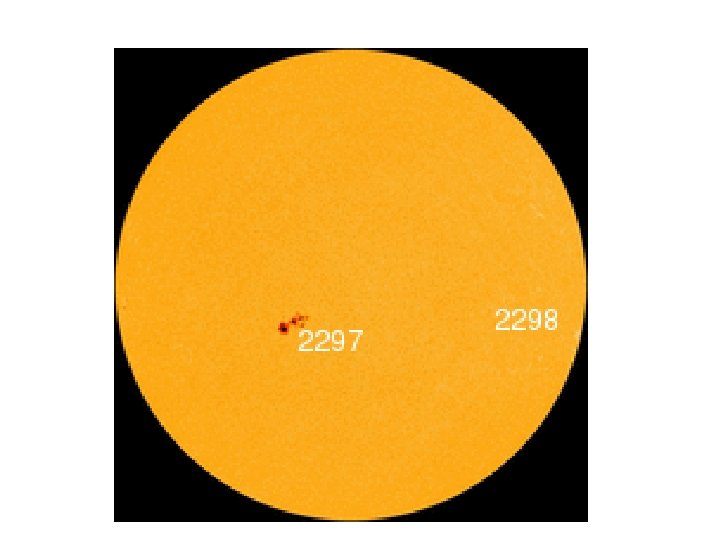
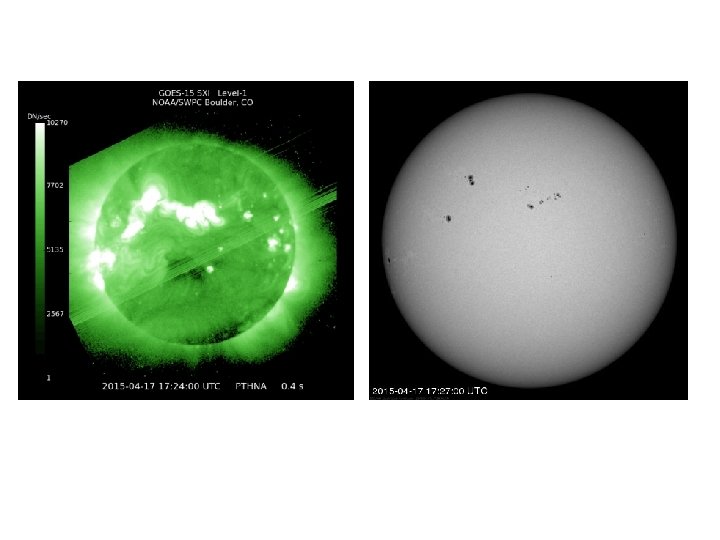
Solar Indices Described Normally discussed indices: - Sunspots. - - Cooler than surrounding solar surface (3700 K vs 6000 K). - Appear much brighter than surrounding areas in UV light. - View in UV/x-ray spectrum. Check reference links to see false color photos. Visibly dark due to intense magnetic fields preventing interior solar heat from rising. Magnetic fields form into loops, constrain plasma, heat it to over 1, 000 K. When these field lines change or snap can cause CMEs/flares.
More Info WWV at 18 Minutes past the hour. Should we just turn the radio off if all indicators are bad? - Absolutely not. - These are measurements and forecasts and are all interrelated. - Actual radio conditions can sometimes be much better than predicted from forecasts or actual measurements (and they can be worse). - Jump on the air and give it a try, you may even get a rare DX contact or hear stations you normally wouldn’t if you observe unusual solar conditions. - It’s Ham radio – HAVE FUN!
References http: //www. aoc. nrao. edu/~pharden/hobby/FDI M 81. pdf http: //www. swpc. noaa. gov/about-spaceweather http: //www. swpc. noaa. gov/communities/space -weather-enthusiasts http: //tf. nist. gov/stations/iform. html