
Soil Phosphorus Issues Miguel Cabrera and David Radcliffe
Soil Phosphorus Issues Miguel Cabrera and David Radcliffe Crop and Soil Sciences University of Georgia
Intended Outcomes • Understand how P affects water quality • Understand how P behaves in soil • Understand why manures present a special problem with P • Understand how to use the Phosphorus Index
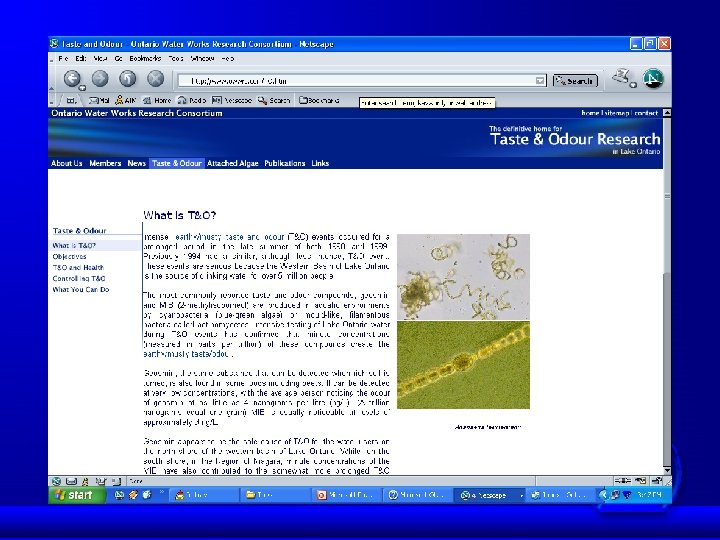
How P Affects Water Quality • High levels of nutrients cause accelerated eutrophication (algal blooms) • P controls eutrophication in fresh water • Lakes are more sensitive than streams • Eutrophication can increase: • aquatic weeds • algal growth • low oxygen levels, • fish kills, • bad-tasting water (geosmin)
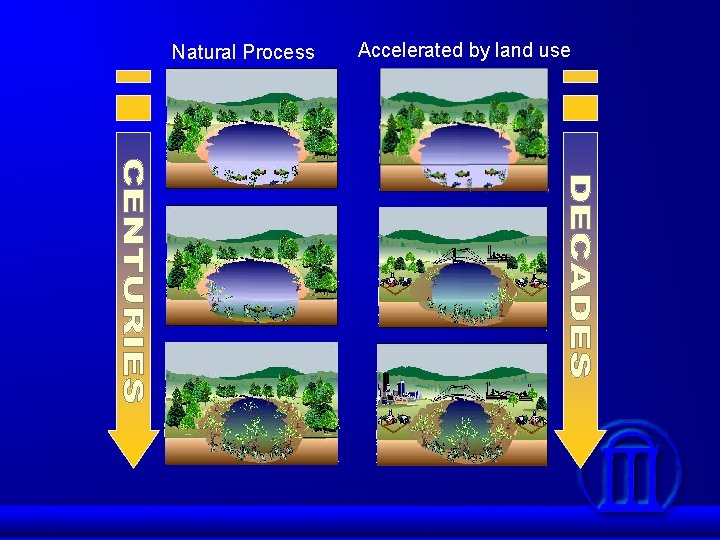
Natural Process Accelerated by land use
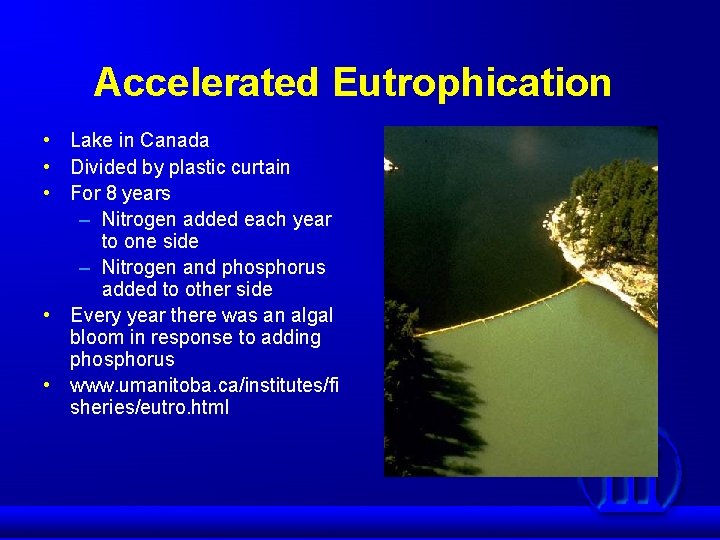
Accelerated Eutrophication • Lake in Canada • Divided by plastic curtain • For 8 years – Nitrogen added each year to one side – Nitrogen and phosphorus added to other side • Every year there was an algal bloom in response to adding phosphorus • www. umanitoba. ca/institutes/fi sheries/eutro. html
How P Affects Water Quality • High levels of nutrients cause accelerated eutrophication • P controls eutrophication in fresh water • Lakes are more sensitive than streams • Eutrophication can increase: • aquatic weeds • algal growth • low oxygen levels, • fish kills, • bad-tasting water (geosmin)
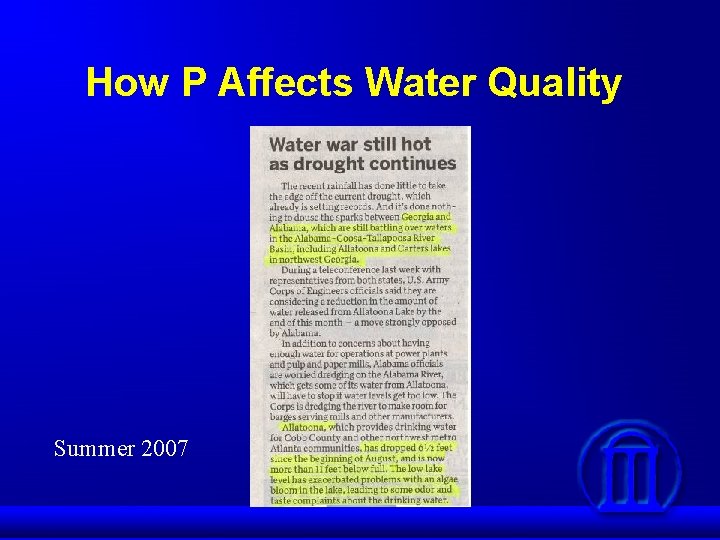
How P Affects Water Quality Summer 2007
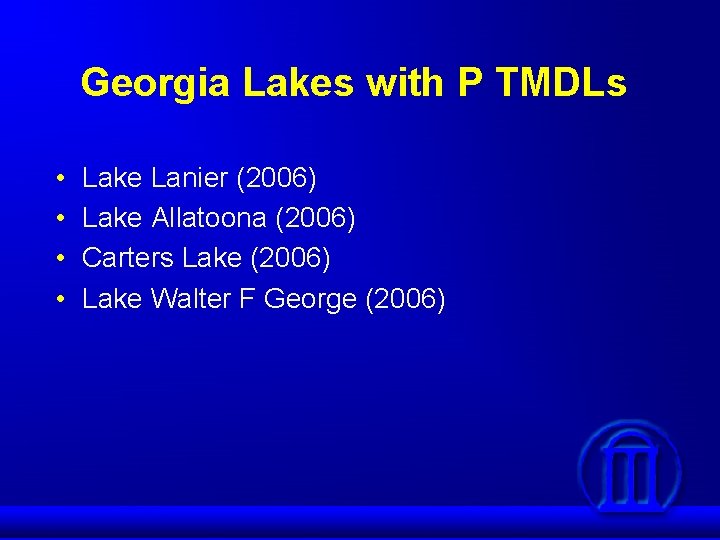
Georgia Lakes with P TMDLs • • Lake Lanier (2006) Lake Allatoona (2006) Carters Lake (2006) Lake Walter F George (2006)
Intended Outcomes • Understand how P affects water quality • Understand how P behaves in soil • Understand why manures present a special problem with P • Understand how to use the Phosphorus Index
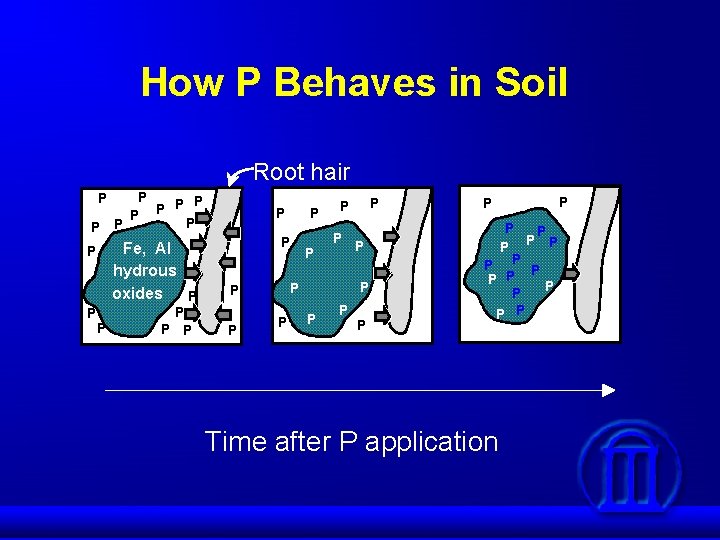
How P Behaves in Soil Root hair P P P P P Fe, Al hydrous oxides P P P P P P P P P P Time after P application
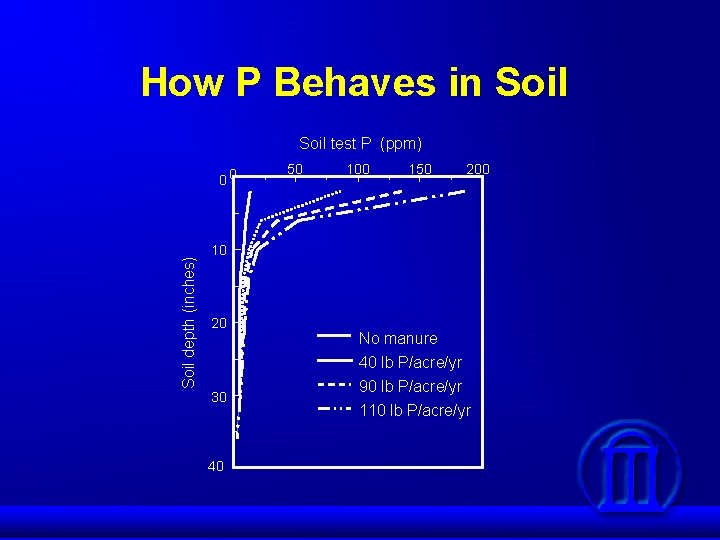
How P Behaves in Soil test P (ppm) Soil depth (inches) 00 50 100 150 200 10 20 30 40 No manure 40 lb P/acre/yr 90 lb P/acre/yr 110 lb P/acre/yr
Dissolved P in surface runoff (ppm) How P Behaves in Soil Surface runoff 220 175 Mehlich-3 soil P (ppm)
Intended Outcomes • Understand how P affects water quality • Understand how P behaves in soil • Understand why manures present a special problem with P • Understand how to use the Phosphorus Index
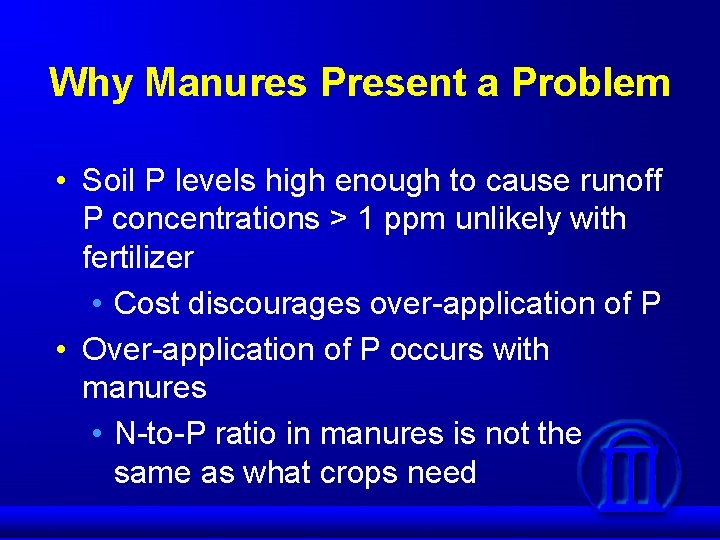
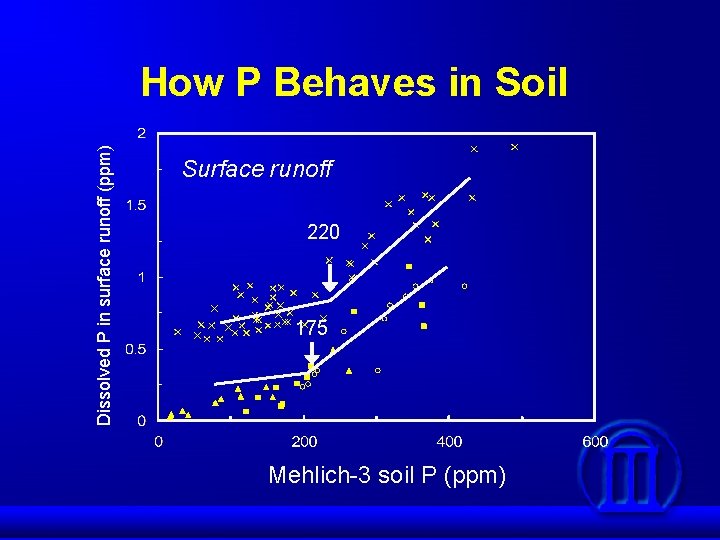
Why Manures Present a Problem • Soil P levels high enough to cause runoff P concentrations > 1 ppm unlikely with fertilizer • Cost discourages over-application of P • Over-application of P occurs with manures • N-to-P ratio in manures is not the same as what crops need
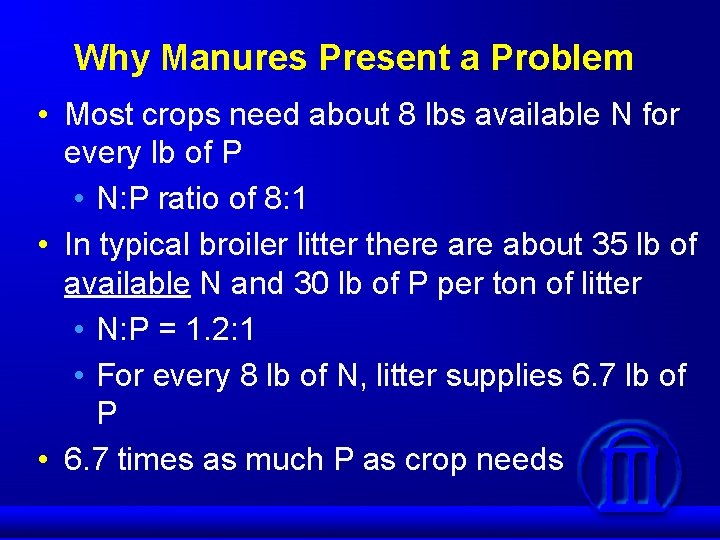
Why Manures Present a Problem • Most crops need about 8 lbs available N for every lb of P • N: P ratio of 8: 1 • In typical broiler litter there about 35 lb of available N and 30 lb of P per ton of litter • N: P = 1. 2: 1 • For every 8 lb of N, litter supplies 6. 7 lb of P • 6. 7 times as much P as crop needs
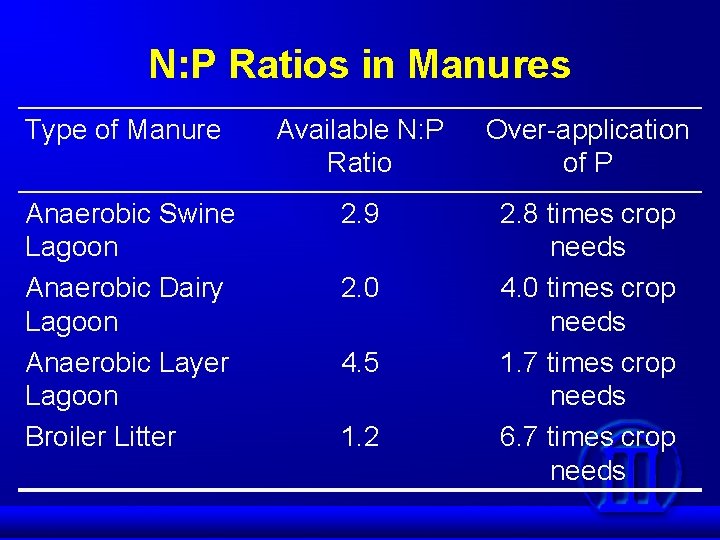
N: P Ratios in Manures Type of Manure Available N: P Ratio Over-application of P Anaerobic Swine Lagoon Anaerobic Dairy Lagoon Anaerobic Layer Lagoon Broiler Litter 2. 9 2. 8 times crop needs 4. 0 times crop needs 1. 7 times crop needs 6. 7 times crop needs 2. 0 4. 5 1. 2
Cycling of P: Before World War II
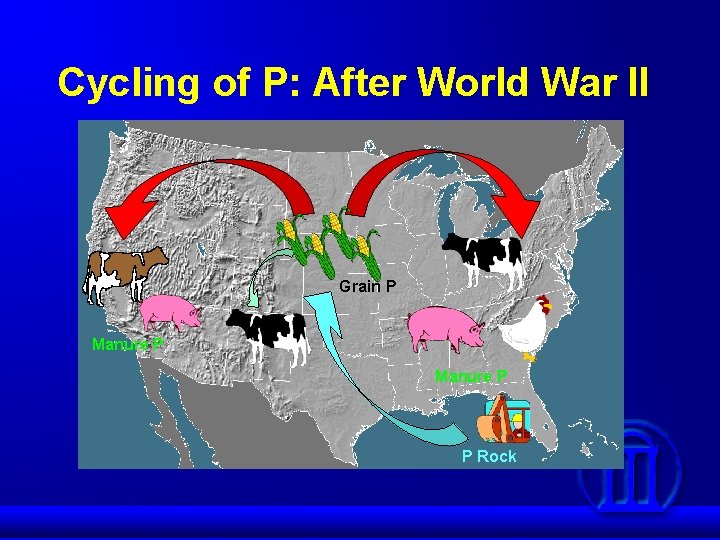
Cycling of P: After World War II Grain P Manure P P Rock
Regional Imbalance of P • Typical poultry ration contains 60% corn • Less than 10% of the corn used in Georgia poultry feed is produced in the state • Georgia imports 135 million bushels of corn per year • Nearly 8, 000 tons P imported each year
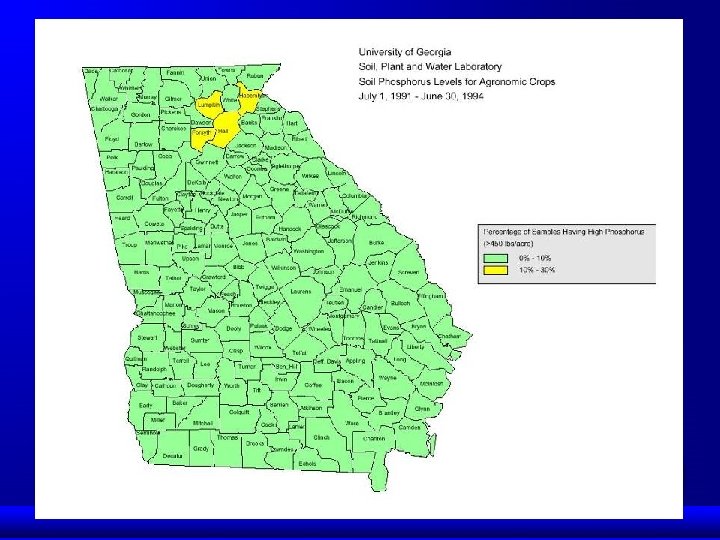
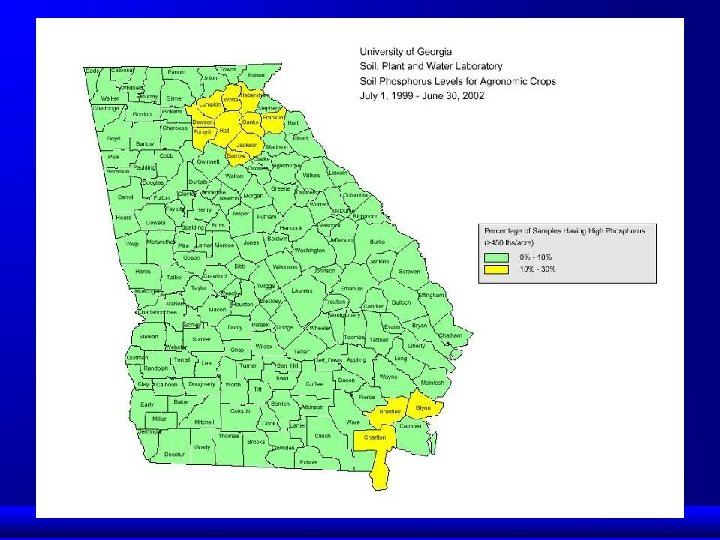
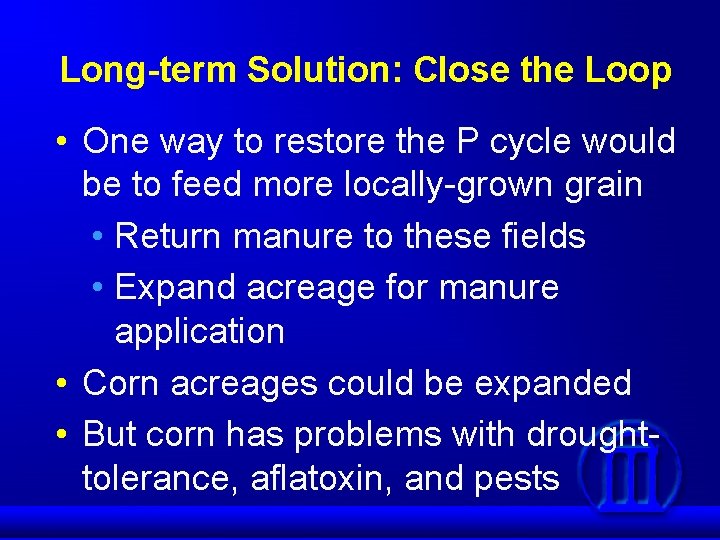
Long-term Solution: Close the Loop • One way to restore the P cycle would be to feed more locally-grown grain • Return manure to these fields • Expand acreage for manure application • Corn acreages could be expanded • But corn has problems with droughttolerance, aflatoxin, and pests
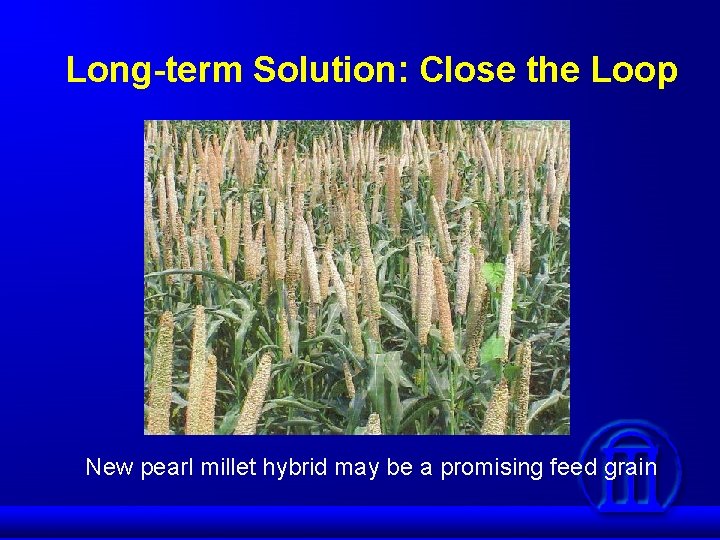
Long-term Solution: Close the Loop New pearl millet hybrid may be a promising feed grain
Long-term Solution: Close the Loop • New pearl millet hybrid is called “Tifgrain 102” • Can be used as a substitute for corn grain in poultry, cattle, swine, and dairy rations • Check with county agent about local markets • http: //pubs. caes. uga. edu/caespubs/pubcd/B 1 216. htm
Short-term Solution: BMP’s • • Alter feed ration to reduce P in manure Add alum to waste water Don’t apply manure when runoff is likely Incorporate or inject manures Avoid artificially drained fields Grass filters and stream-side buffers Use practices that reduce runoff and erosion
Objectives • Understand how P affects water quality • Understand how P behaves in soil • Understand why manures present a special problem with P • Understand how to use the Phosphorus Index

Soluble P Particulate P Soluble P
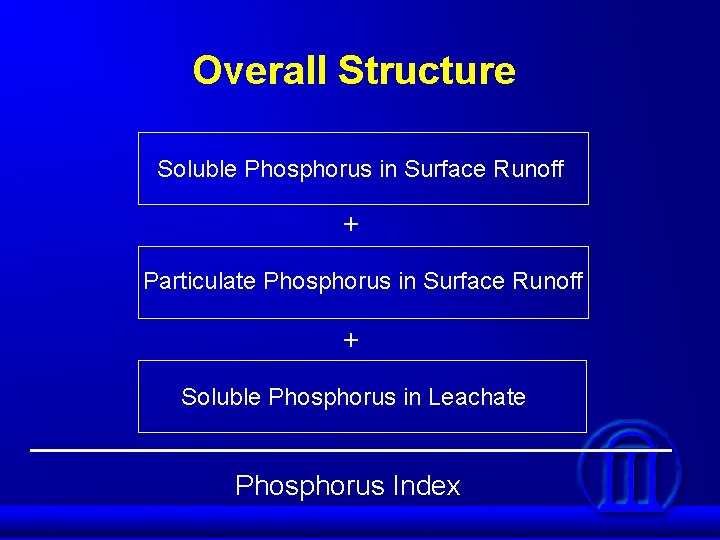
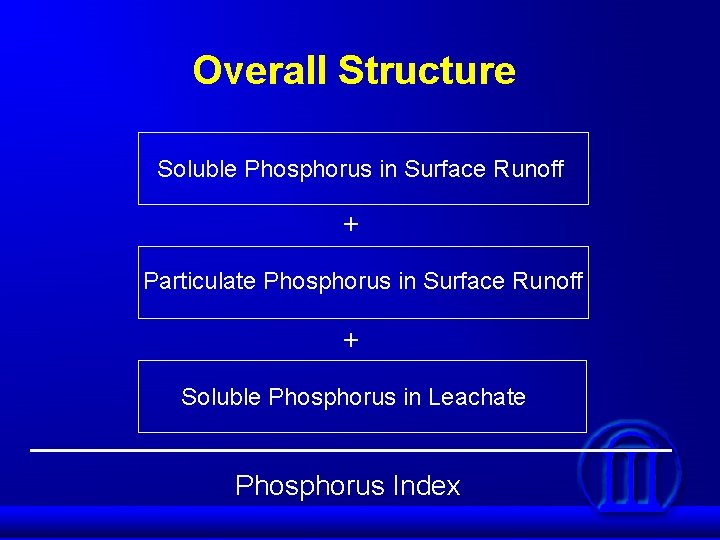
Overall Structure Soluble Phosphorus in Surface Runoff + Particulate Phosphorus in Surface Runoff + Soluble Phosphorus in Leachate Phosphorus Index
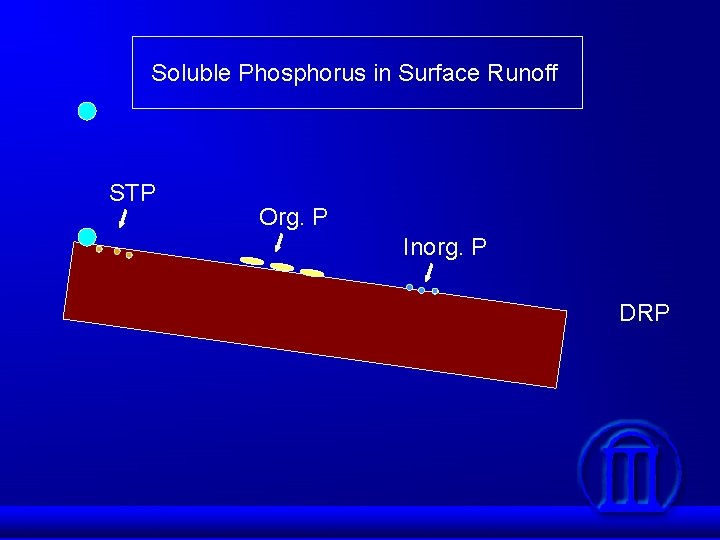
Soluble Phosphorus in Surface Runoff STP Org. P Inorg. P DRP
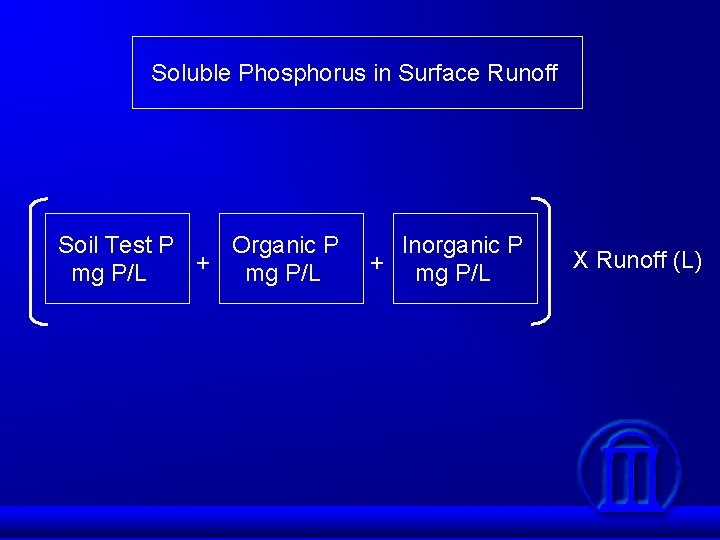
Soluble Phosphorus in Surface Runoff Soil Test P Organic P + mg P/L Inorganic P + mg P/L X Runoff (L)
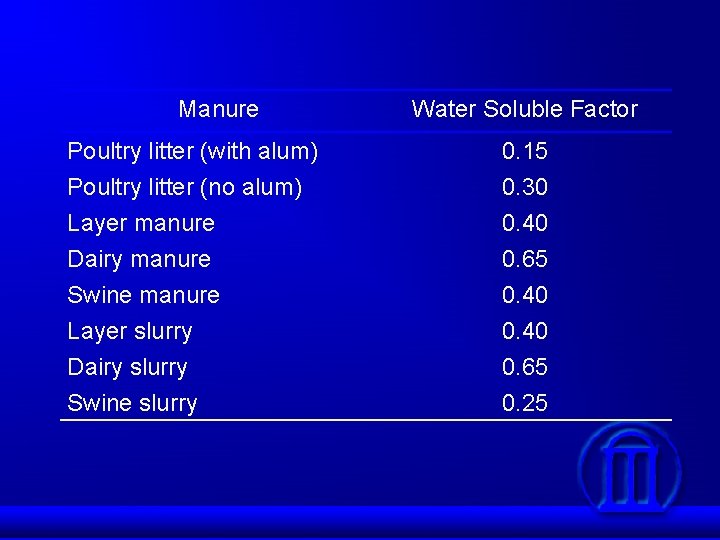
Manure Water Soluble Factor Poultry litter (with alum) Poultry litter (no alum) Layer manure 0. 15 0. 30 0. 40 Dairy manure Swine manure Layer slurry Dairy slurry Swine slurry 0. 65 0. 40 0. 65 0. 25
Yearly Runoff Estimation
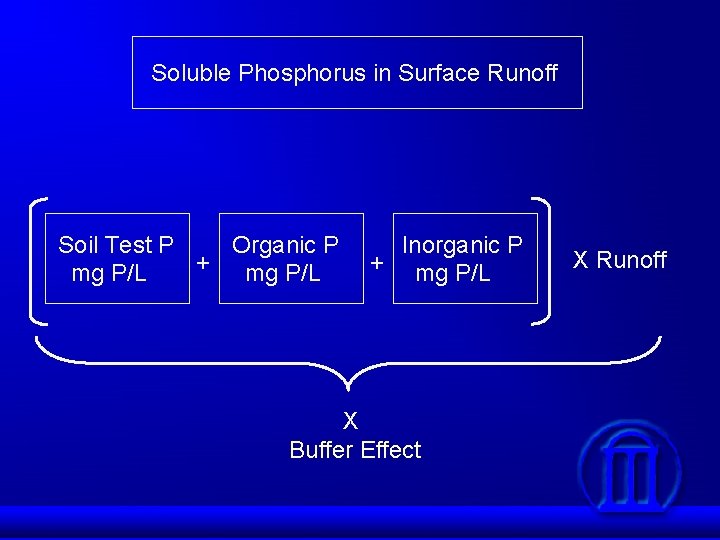
Soluble Phosphorus in Surface Runoff Soil Test P Organic P + mg P/L Inorganic P + mg P/L X Buffer Effect X Runoff
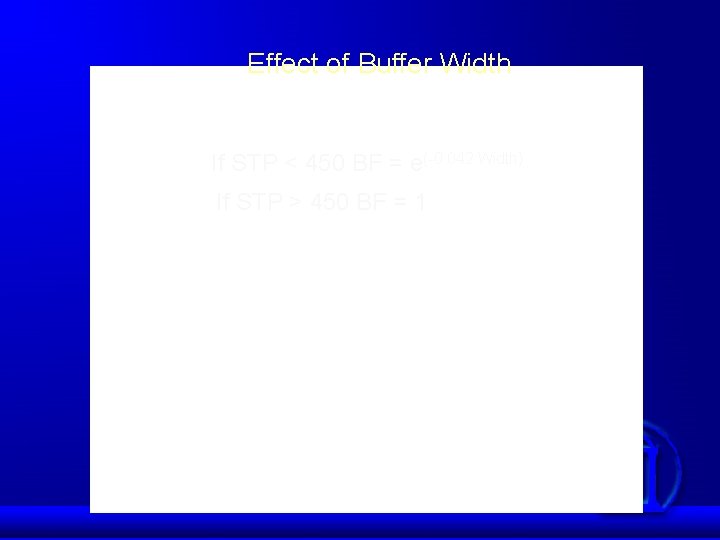
Effect of Buffer Width If STP < 450 BF = e(-0. 042 Width) If STP > 450 BF = 1
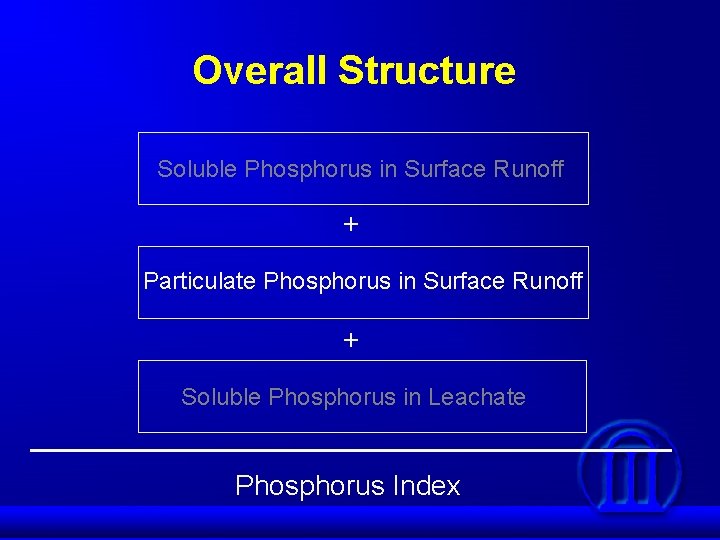
Overall Structure Soluble Phosphorus in Surface Runoff + Particulate Phosphorus in Surface Runoff + Soluble Phosphorus in Leachate Phosphorus Index
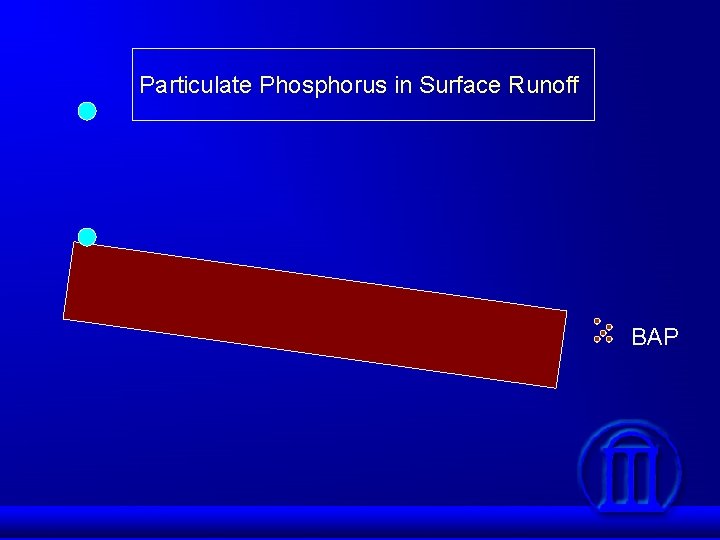
Particulate Phosphorus in Surface Runoff BAP
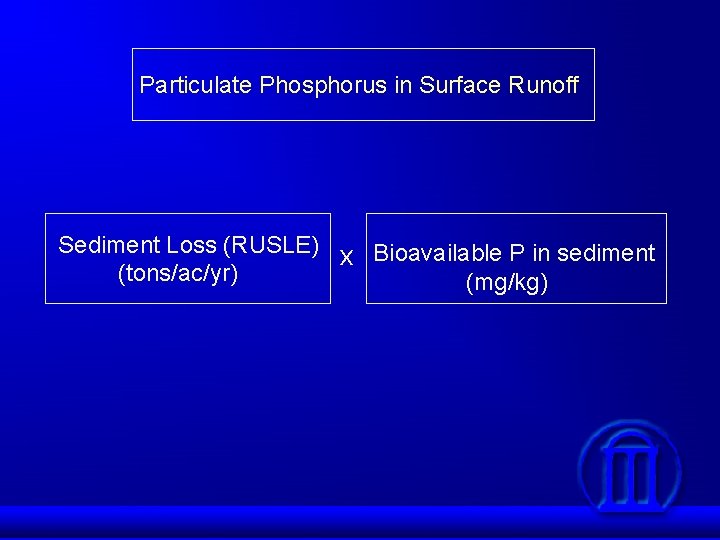
Particulate Phosphorus in Surface Runoff Sediment Loss (RUSLE) x Bioavailable P in sediment (tons/ac/yr) (mg/kg)
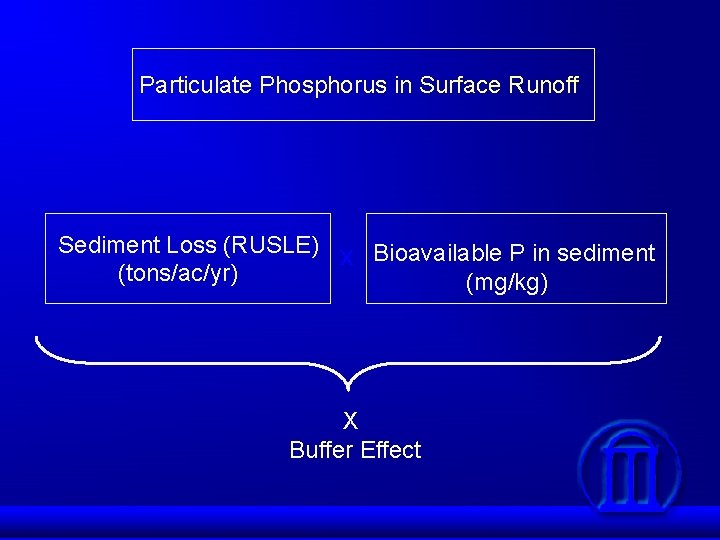
Particulate Phosphorus in Surface Runoff Sediment Loss (RUSLE) x Bioavailable P in sediment (tons/ac/yr) (mg/kg) X Buffer Effect
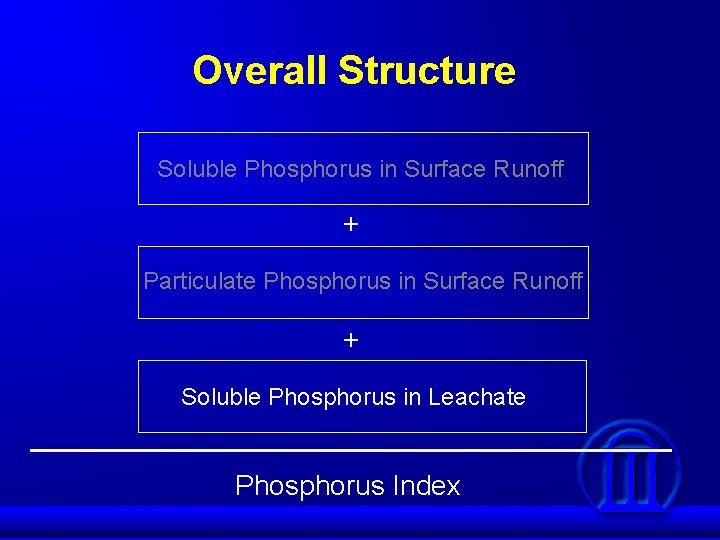
Overall Structure Soluble Phosphorus in Surface Runoff + Particulate Phosphorus in Surface Runoff + Soluble Phosphorus in Leachate Phosphorus Index
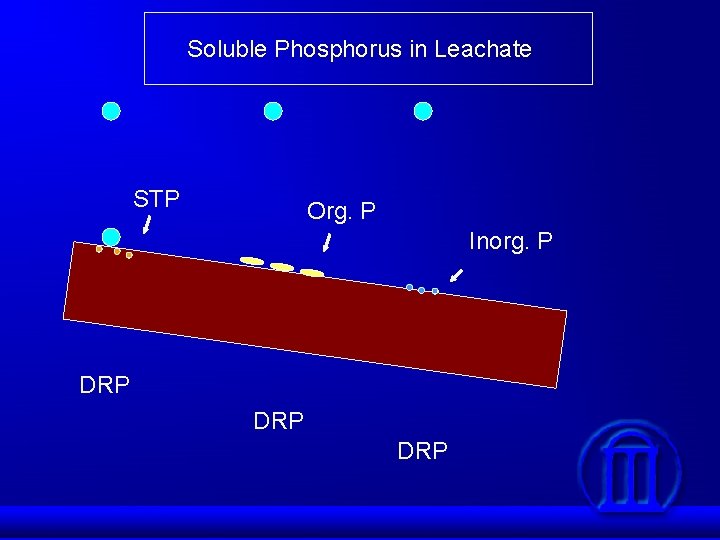
Soluble Phosphorus in Leachate STP Org. P Inorg. P DRP DRP
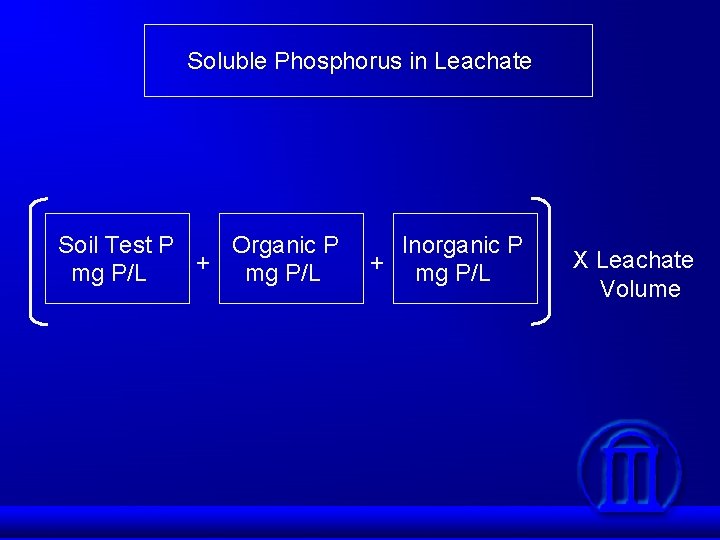
Soluble Phosphorus in Leachate Soil Test P Organic P + mg P/L Inorganic P + mg P/L X Leachate Volume
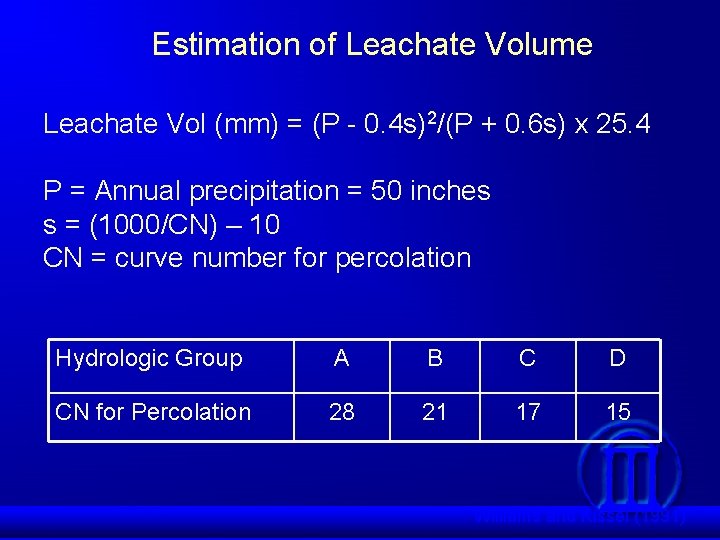
Estimation of Leachate Volume Leachate Vol (mm) = (P - 0. 4 s)2/(P + 0. 6 s) x 25. 4 P = Annual precipitation = 50 inches s = (1000/CN) – 10 CN = curve number for percolation Hydrologic Group A B C D CN for Percolation 28 21 17 15 Williams and Kissel (1991)
Volume of Yearly Leachate 1250 mm rain
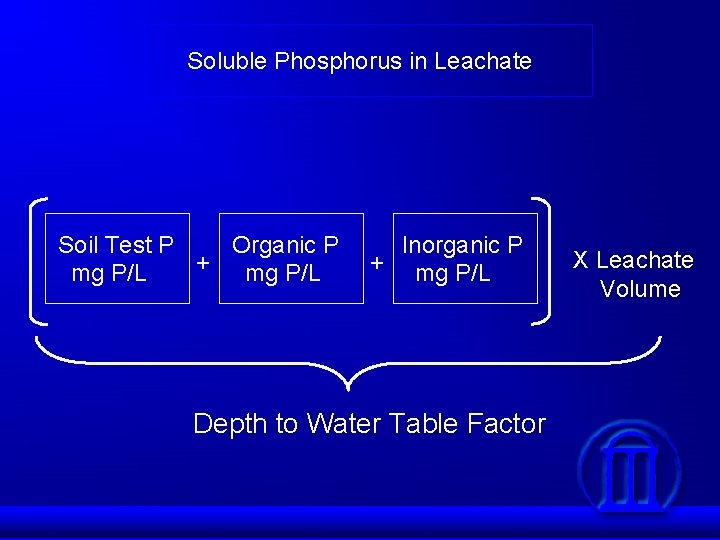
Soluble Phosphorus in Leachate Soil Test P Organic P + mg P/L Inorganic P + mg P/L Depth to Water Table Factor X Leachate Volume
Depth to Water Table Factor
Overall Structure Soluble Phosphorus in Surface Runoff + Particulate Phosphorus in Surface Runoff + Soluble Phosphorus in Leachate Phosphorus Index
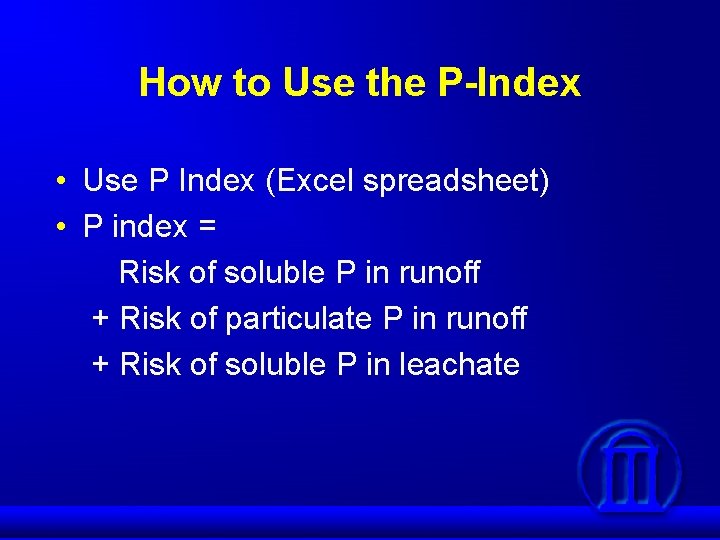
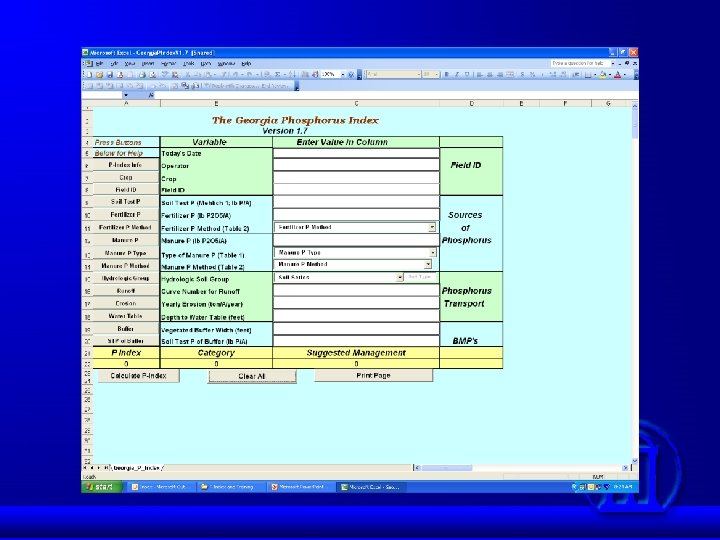
How to Use the P-Index • Use P Index (Excel spreadsheet) • P index = Risk of soluble P in runoff + Risk of particulate P in runoff + Risk of soluble P in leachate
Phosphorus Index Inputs • Phosphorus Sources • Phosphorus Transport • Best Mgmt. Practices (BMP’s)
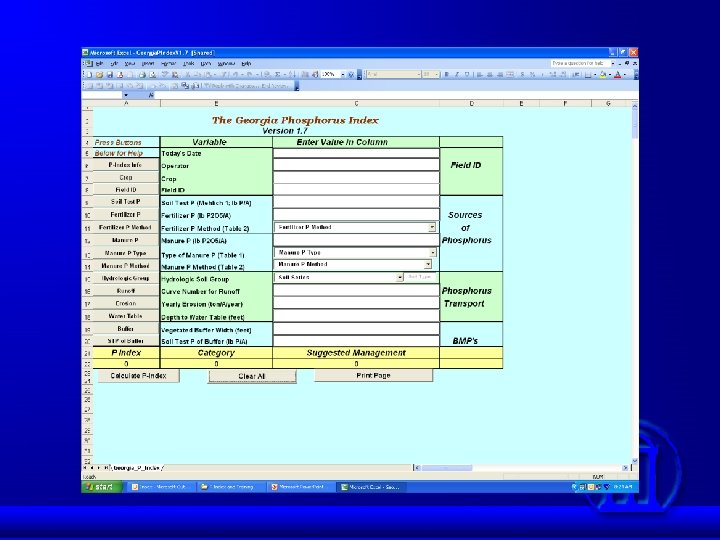
P Index Input: P Sources • Soil P (soil test P) • Fertilizer P • Manure P
P Index Inputs: Soil Test P • Lab analysis: Mehlich 1 – UGA Soil Test Lab uses this method • Other labs may use Mehlich 3 • The two methods give different numbers and there is no good way to convert Mehlich 3 to Mehlich 1 • Be sure your lab is using Mehlich 1 !
P Index Inputs: Manure P • Soil test lab analysis of dry and liquid manure will give P 2 O 5 in lbs – Dry manure: lb per ton – Liquid manure: lb per acre-in or lbs per 1, 000 gal • If you don’t use lab analysis, P 2 O 5 content must be calculated – Example 1: Apply 5 ton of poultry manure/acre – Assume 1. 5% P content for manure – 1. 5% x 2, 000 lb = 30 lb P per ton – 30 lb/ton x 5 ton/A x 2. 29 = 344 lb P 2 O 5 per acre – 2. 29 conversion factor for converting P to P 205
P Index Inputs Summary • Manure/Fertilizer information – Source, application method, and rate – From manure test reports: P 2 O 5 content • Soil information – From soil test reports: STP – From county soil survey map: soil series (hydrologic group) and depth to water table – From NRCS office: curve number and erosion rate – Curve number can also be obtained from TR-55 using soil series and management
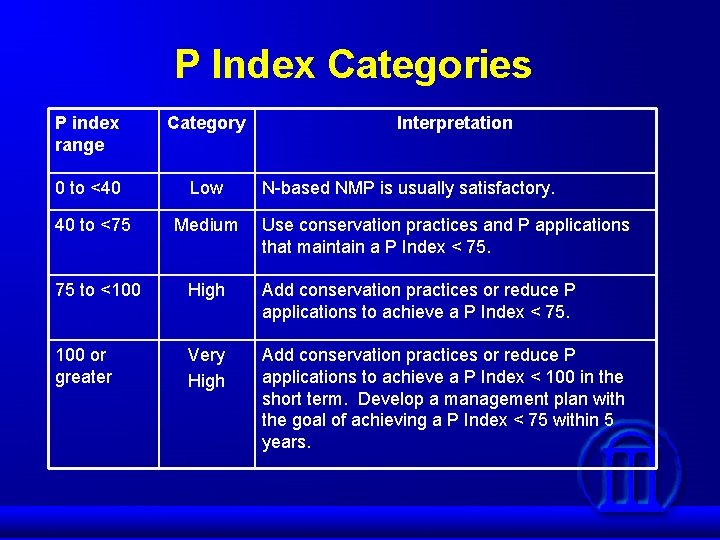
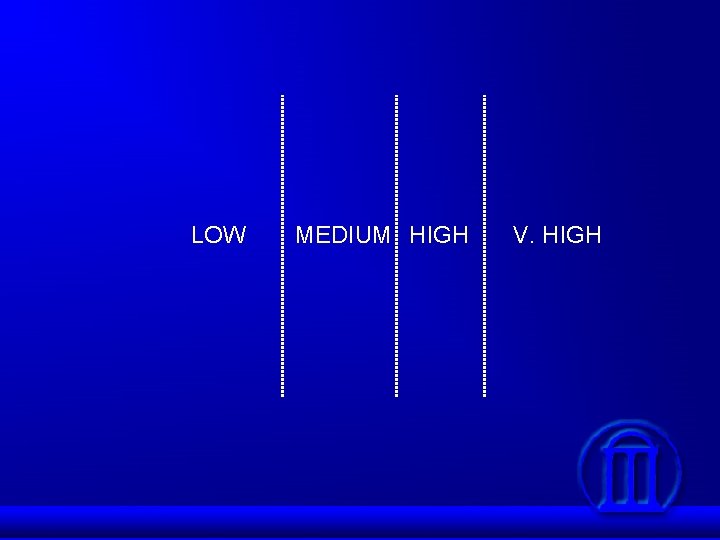
P Index Categories P index range Category Interpretation 0 to <40 Low 40 to <75 Medium 75 to <100 High Add conservation practices or reduce P applications to achieve a P Index < 75. 100 or greater Very High Add conservation practices or reduce P applications to achieve a P Index < 100 in the short term. Develop a management plan with the goal of achieving a P Index < 75 within 5 years. N-based NMP is usually satisfactory. Use conservation practices and P applications that maintain a P Index < 75.
LOW MEDIUM HIGH V. HIGH
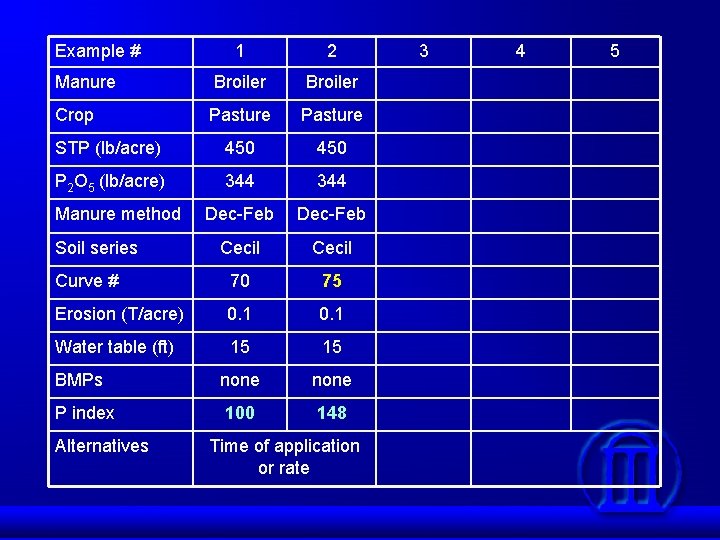
Example # 1 2 Manure Broiler Crop Pasture STP (lb/acre) 450 P 2 O 5 (lb/acre) 344 Dec-Feb Cecil Curve # 70 75 Erosion (T/acre) 0. 1 Water table (ft) 15 15 BMPs none P index 100 148 Manure method Soil series Alternatives Time of application or rate 3 4 5
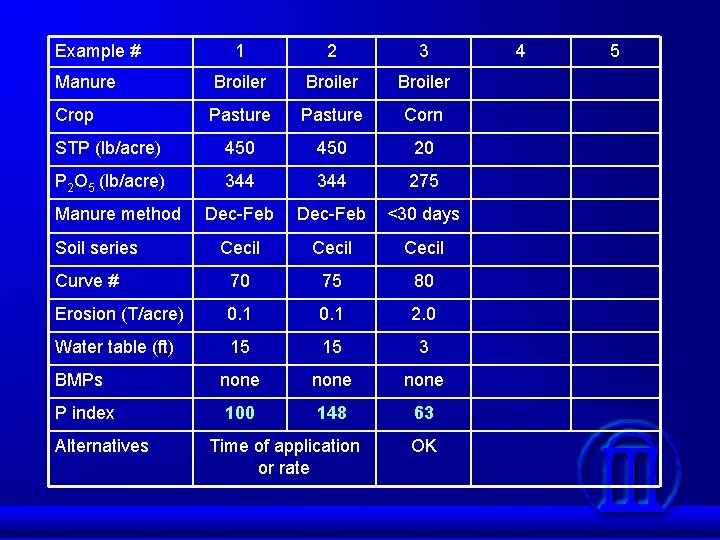
Example # 1 2 3 Manure Broiler Crop Pasture Corn STP (lb/acre) 450 20 P 2 O 5 (lb/acre) 344 275 Dec-Feb <30 days Cecil Curve # 70 75 80 Erosion (T/acre) 0. 1 2. 0 Water table (ft) 15 15 3 BMPs none P index 100 148 63 Manure method Soil series Alternatives Time of application or rate OK 4 5
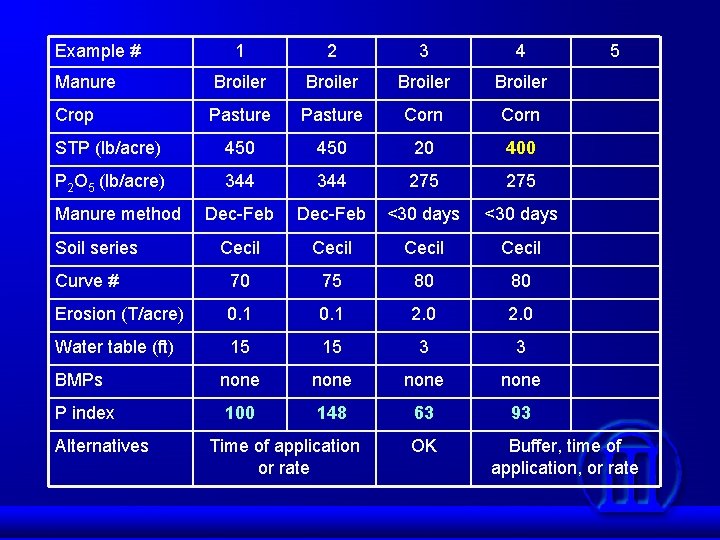
Example # 1 2 3 4 Manure Broiler Crop Pasture Corn STP (lb/acre) 450 20 400 P 2 O 5 (lb/acre) 344 275 Dec-Feb <30 days Cecil Curve # 70 75 80 80 Erosion (T/acre) 0. 1 2. 0 Water table (ft) 15 15 3 3 BMPs none P index 100 148 63 93 Manure method Soil series Alternatives Time of application or rate OK 5 Buffer, time of application, or rate
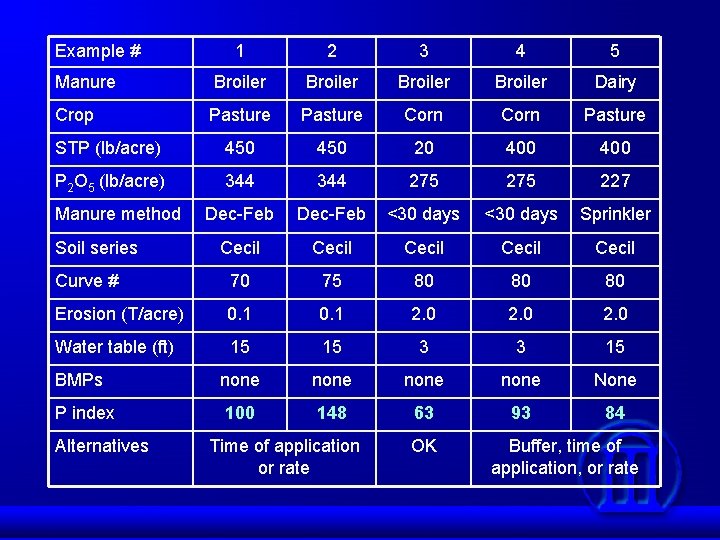
Example # 1 2 3 4 5 Manure Broiler Dairy Crop Pasture Corn Pasture STP (lb/acre) 450 20 400 P 2 O 5 (lb/acre) 344 275 227 Dec-Feb <30 days Sprinkler Cecil Cecil Curve # 70 75 80 80 80 Erosion (T/acre) 0. 1 2. 0 Water table (ft) 15 15 3 3 15 BMPs none None P index 100 148 63 93 84 Manure method Soil series Alternatives Time of application or rate OK Buffer, time of application, or rate
Summary • Excess P causes fresh water eutrophication • Build up of soil test P leads to P in runoff • Manures based on N supply too much P • P imported in corn and soybean for rations • Growing pearl millet may help close P loop • • P Index is used to assess risk of P loss Input: soil test P, fertilizer P, manure P Input: soil series, curve number, erosion loss BMP’s can be used to reduce P Index value
Reference Web Sites • AWARE – www. engr. uga. edu/service/extension/agp 2/ aware/newtools. php – P index calculator – Excel spreadsheet – P index documentation – pdf file • NRCS – http: //www. wsi. nrcs. usda. gov/products/W 2 Q/H&H/Tools_Models/Win. TR 55. html – TR 55 for determining curve #’s
- Slides: 63