Software Project Management Project planning Once a project


 Estimating the following attributes of the project: •")
 Scheduling manpower and other resources 3) Staff organization and staffing plans 4) Risk")


 1. Introduction (a) Objectives (b) Major Functions (c) Performance")
 4. Project Resources (a) People (b) Hardware and Software")


. • The effort estimation is expressed in units of person-months (PM). •")
")


 product for an organization having offices")


 is used to decompose a given")


 • The minimum time (MT) to complete the project is")
 is the total time that")

. The resources allocated")

 charts consist of a network")


- Slides: 54
Software Project Management
Project planning • Once a project is found to be feasible, software project managers undertake project planning. • Project planning is undertaken and completed even before any development activity starts.
Essential activities in Project Planning: 1) Estimating the following attributes of the project: • Project size: What will be problem complexity in terms of the effort and time required to develop the product? • Cost: How much is it going to cost to develop the project? • Duration: How long is it going to take to complete development? • Effort: How much effort would be required? Ø The effectiveness of the subsequent planning activities is based on the accuracy of these estimations.
2) Scheduling manpower and other resources 3) Staff organization and staffing plans 4) Risk identification, analysis, and abatement planning 5) Miscellaneous plans such as quality assurance plan, configuration management plan, etc.
Precedence ordering among project planning activities
Problem in Project Planning • Commitment to unrealistic time and resource estimates result in schedule slippage. • Schedule delays can cause customer dissatisfaction and adversely affect team morale. • However, project planning is a very challenging activity. Especially for large projects, it is very much difficult to make accurate plans. • A part of this difficulty is due to the fact that the proper parameters, scope of the project, project staff, etc. may change during the span of the project.
Solution: Sliding Window Planning • Planning a project over a number of stages protects managers from making big commitments too early. • This technique of staggered planning is known as Sliding Window Planning. • Starting with an initial plan, the project is planned more accurately in successive development stages. • After the completion of every phase, the project managers can plan each subsequent phase more accurately and with increasing levels of confidence.
Responsibilities of a software project manager • Overall responsibility of steering a project to success. • The job responsibility of a project manager ranges from invisible activities like building up team morale to highly visible customer presentations. • Activities can be broadly classified into project planning, and project monitoring and control activities. • It includes: project proposal writing, project cost estimation, scheduling, project staffing, software process tailoring, project monitoring and control, software configuration management, risk management, interfacing with clients, managerial report writing and presentations, etc.
Skills necessary for software project management Ø Theoretical knowledge of different project management techniques like cost estimation, risk management, configuration management Ø Good qualitative judgment and decision taking capabilities. Ø Good communication skills and the ability get work done.
Software Project Management Plan (SPMP) 1. Introduction (a) Objectives (b) Major Functions (c) Performance Issues (d) Management and Technical Constraints 2. Project Estimates (a) Historical Data Used (b) Estimation Techniques Used (c) Effort, Resource, Cost, and Project Duration Estimates 3. Schedule (a) Work Breakdown Structure (b) Task Network Representation (c) Gantt Chart Representation (d) PERT Chart Representation
Software Project Management Plan (SPMP) 4. Project Resources (a) People (b) Hardware and Software (c) Special Resources 5. Staff Organization (a) Team Structure (b) Management Reporting 6. Risk Management Plan (a) Risk Analysis (b) Risk Identification (c) Risk Estimation (d) Risk Abatement Procedures 7. Project Tracking and Control Plan 8. Miscellaneous Plans (a) Process Tailoring (b) Quality Assurance Plan (c) Configuration Management Plan
Project Estimation techniques • Empirical estimation techniques • Heuristic techniques • Analytical estimation techniques
Empirical Estimation Techniques • Based on making an educated guess of the project parameters. • Prior experience with development of similar products is helpful. • Although empirical estimation techniques are based on common sense, different activities involved in estimation have been formalized over the years. Two popular empirical estimation techniques are: 1) Expert judgment technique 2) Delphi cost estimation
Expert Judgment Technique • An expert makes an educated guess of the problem size after analyzing the problem thoroughly. • Estimates the cost of the different components (i. e. modules or subsystems) of the system and then combines them to arrive at the overall estimate. • However, this technique is subject to human errors and individual bias. • For example, he may be conversant with the database and user interface parts but may not be very knowledgeable about the computer communication part. • A more refined form of expert judgment is the estimation made by group of experts.
Delphi cost estimation • It overcomes some of the shortcomings of the expert judgment approach. • Delphi estimation is carried out by a team comprising of a group of experts and a coordinator. • No discussion among the estimators is allowed during the entire estimation process.
Delphi cost estimation • The coordinator provides each estimator with a copy of the SRS document and a form for recording his cost estimate. • Estimators complete their individual estimates anonymously and submit to the coordinator. • The coordinator prepares and distributes the summary of the responses of all the estimators, and includes any unusual rationale noted by any of the estimators. • Based on this summary, the estimators reestimate. • This process is iterated for several rounds.
Heuristic Techniques • It assumes that the relationships among the different project parameters can be modelled using suitable mathematical expressions. • Once the basic (independent) parameters are known, the other (dependent) parameters can be easily determined by substituting the value of the basic parameters in the mathematical expression. • Two classes: 1) single variable model and 2) multi variable model
Single variable estimation models • It provides a means to estimate the desired characteristics of a problem, using some previously estimated basic (independent) characteristic of the software product such as its size. Estimated Parameter = • e is the characteristic of the software which has already been estimated (independent variable) • c 1 and d 1 are constants determined using data collected from past projects (historical data).
Multivariable cost estimation model • Where e 1, e 2, … are the basic (independent) characteristics of the software already estimated, and c 1, c 2, d 1, d 2, … are constants. • Multivariable estimation models are expected to give more accurate estimates.
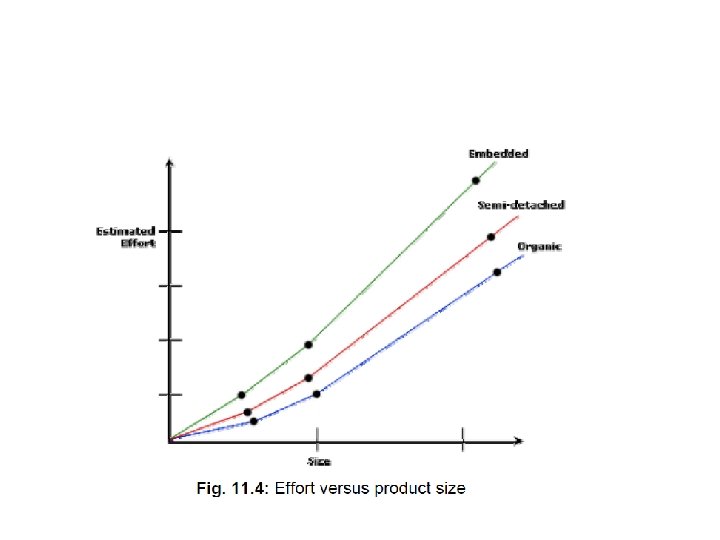
Project Types Organic: Routine project • Well understood domain • Team works well and efficiently together • Project expected to run smoothly • Typically a smaller system and smaller team Embedded: • Difficulties expected • Project that is hard (control software for a nuclear plant, or spacecraft) • Team has little experience in domain • New or inexperienced team • Tend to be large projects with lots of constraints
Semidetached: • In the middle • Complex system, but something the company is familiar with • Teams may be made up of experienced and inexperienced members • System not huge, but not small either
Basic COCOMO Model • COnstructive COst MOdel • The basic COCOMO model gives an approximate estimate of the project parameters.
person-months (PM). • The effort estimation is expressed in units of person-months (PM). • An effort of 100 PM does not imply that 100 persons should work for 1 month nor does it imply that 1 person should be employed for 100 months, but it denotes the area under the person-month curve. • It is the area under the person-month plot.
person-months (PM)
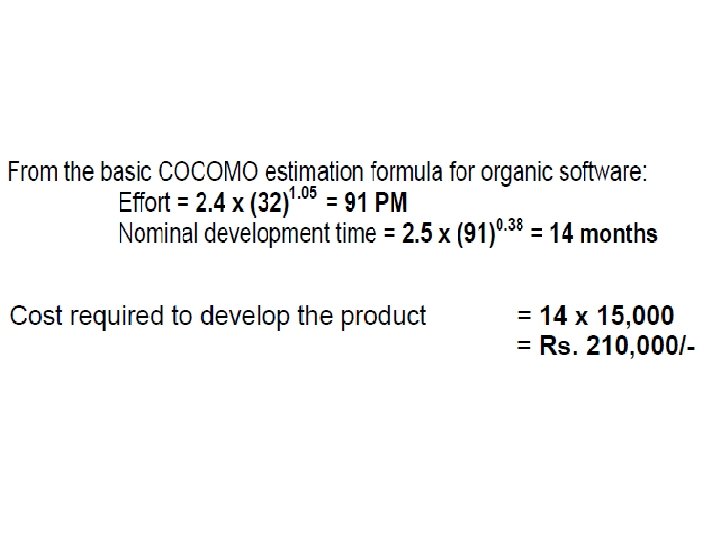
Estimation of development effort
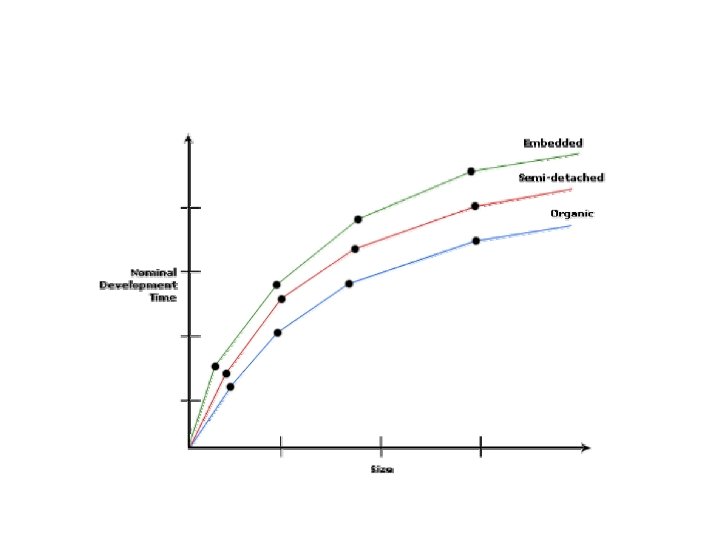
Estimation of development time
Example: • Assume that the size of an organic type software product has been estimated to be 32, 000 lines of source code. Assume that the average salary of software engineers be Rs. 15, 000/- per month. Determine the effort required to develop the software product and the nominal development time.
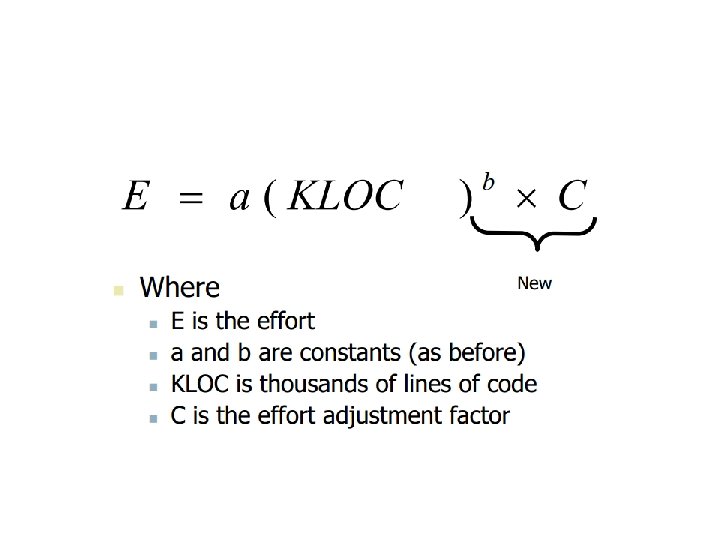
Intermediate COCOMO model • The basic COCOMO model assumes that effort and development time are functions of the product size alone. • However, a host of other project parameters besides the product size affect the effort required to develop the product as well as the development time. • Therefore, in order to obtain an accurate estimation of the effort and project duration, the effect of all relevant parameters must be taken into account.
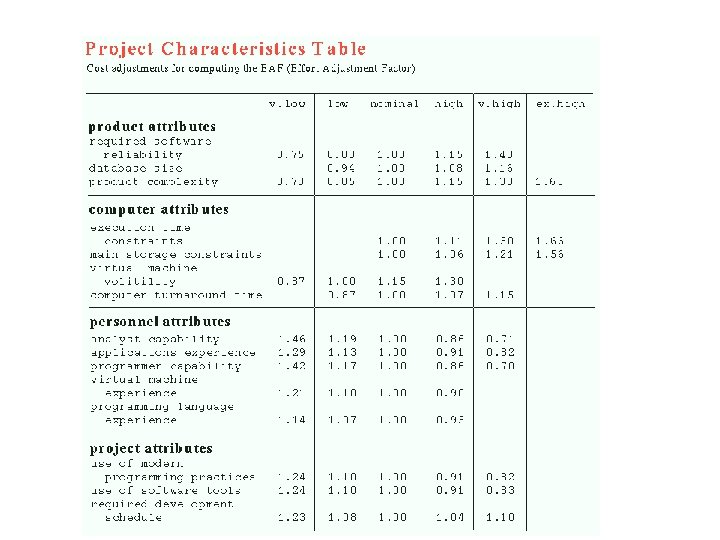
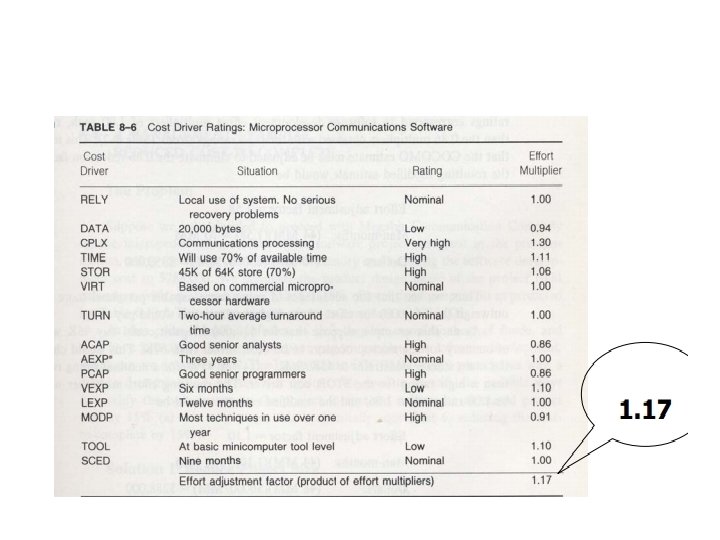
15 Cost Drivers • Boehm requires the project manager to rate these 15 different parameters for a particular project on a scale of one to three. • Then, depending on these ratings, he suggests appropriate cost driver values which should be multiplied with the initial estimate obtained using the basic COCOMO.
Classification of Cost Drivers Product: The characteristics of the product that are considered include the inherent complexity of the product, reliability requirements of the product, etc. Computer: Characteristics of the computer that are considered include the execution speed required, storage space required etc. Personnel: The attributes of development personnel that are considered include the experience level of personnel, programming capability, analysis capability, etc. Development Environment: Development environment attributes capture the development facilities available to the developers. An important parameter that is considered is the sophistication of the automation (CASE) tools used for software development.
Complete COCOMO model • A major shortcoming of both the basic and intermediate COCOMO models is that they consider a software product as a single homogeneous entity. • However, most large systems are made up several smaller sub-systems. • These subsystems may have widely different characteristics. • For example, some subsystems may be considered as organic type, some semidetached, and some embedded.
Example • A distributed Management Information System (MIS) product for an organization having offices at several places across the country can have the following subcomponents: • Database part • Graphical User Interface (GUI) part • Communication part • Of these, the communication part can be considered as embedded software. • The database part could be semi-detached software, and the GUI part organic software.
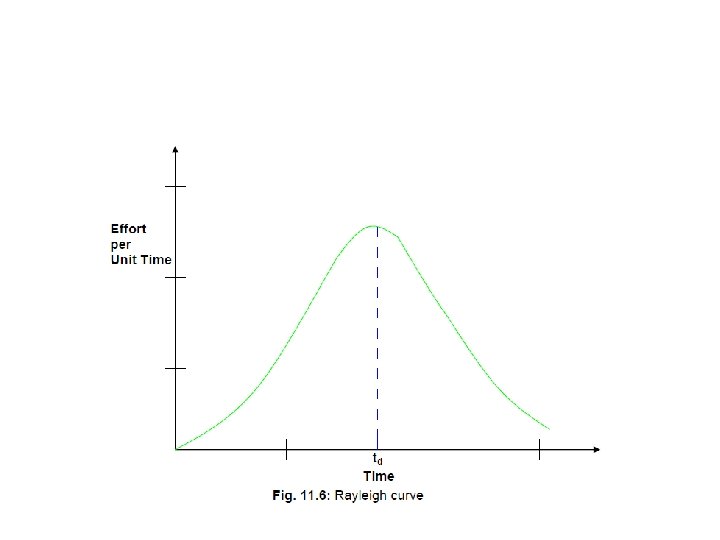
Staffing level estimation • Once the effort required to develop a software has been determined, it is necessary to determine the staffing requirement for the project. • Norden and Putnam studied the staffing patterns of several R & D projects.
Norden’s Work • He found that the staffing pattern can be approximated by the Rayleigh distribution curve. • Norden represented the Rayleigh curve by the following equation: • E is the effort required at time t. E is an indication of the number of engineers (or the staffing level) at any particular time during the duration of the project • K is the area under the curve, and • td is the time at which the curve attains its maximum value.
Project scheduling It involves deciding which tasks would be taken up when. Activities undertaken: 1. Identify all the tasks needed to complete the project. 2. Break down large tasks into small activities. 3. Determine the dependency among different activities. 4. Establish the most likely estimates for the time durations necessary to complete the activities. 5. Allocate resources to activities. 6. Plan the starting and ending dates for various activities. 7. Determine the critical path. A critical path is the chain of activities that determines the duration of the project.
Work breakdown structure • Work Breakdown Structure (WBS) is used to decompose a given task set recursively into small activities. • The root of the tree is labeled by the problem name. • Each node of the tree is broken down into smaller activities that are made the children of the node. • Each activity is recursively decomposed into smaller sub-activities until at the leaf level, the activities requires approximately two weeks to develop.
Work breakdown structure of an MIS problem
Activity networks and critical path method • WBS representation of a project is transformed into an activity network by representing activities identified in WBS along with their interdependencies. • An activity network shows the different activities making up a project, their estimated durations, and interdependencies.
Activity network representation of the MIS problem
Critical Path Method (CPM) • The minimum time (MT) to complete the project is the maximum of all paths from start to finish. • The earliest start (ES) time of a task is the maximum of all paths from the start to the task. • The latest start time is the difference between MT and the maximum of all paths from this task to the finish. • The earliest finish time (EF) of a task is the sum of the earliest start time of the task and the duration of the task. • The latest finish (LF) time of a task can be obtained by subtracting maximum of all paths from this task to finish from MT. • The slack time (ST) is LS – EF and equivalently can be written as LF – EF.
Slack Time • The slack time (or float time) is the total time that a task may be delayed before it will affect the end time of the project. • The slack time indicates the “flexibility” in starting and completion of tasks. • A critical task is one with a zero slack time. A path from the start node to the finish node containing only critical tasks is called a critical path.
Parameters for different tasks of MIS Problem
Gantt chart • Used to allocate resources to activities (resource planning). The resources allocated to activities include staff, hardware, and software. • A Gantt chart is a special type of bar chart where each bar represents an activity. Ø The bars are drawn along a time line. Ø The length of each bar is proportional to the duration of time planned for the corresponding activity.
Gantt chart for MIS problem
PERT chart • PERT (Project Evaluation and Review Technique) charts consist of a network of boxes and arrows. • The boxes represent activities and the arrows represent task dependencies. • The boxes of PERT charts are usually annotated with the pessimistic, likely, and optimistic estimates for every task.
• Gantt chart representation of a project schedule is helpful in planning the utilization of resources, while PERT chart is useful for monitoring the timely progress of activities. • Also, it is easier to identify parallel activities in a project using a PERT chart.
PERT chart representation of the MIS problem