
Sociology 5811 TTests for Difference in Means Wes
- Slides: 24
Sociology 5811: T-Tests for Difference in Means Wes Longhofer, pinch-hitting for Evan Schofer
Strategy for Mean Difference • We never know true population means • So, we never know true value of difference in means • So, we don’t know if groups really differ • If we can figure out the sampling distribution of the difference in means… • We can guess the range in which it typically falls • If it is improbable for the sampling distribution to overlap with zero, then the population means probably differ • An extension of the Central Limit Theorem provides information necessary to do calculations!
Sampling Distribution for Difference in Means • The mean (Y-bar) is a variable that changes depending on the particular sample we took • Similarly, the differences in means for two groups varies, depending on which two samples we chose • The distribution of all possible estimates of the difference in means is a sampling distribution! • The “sampling distribution of differences in means” • It reflects the full range of possible estimates of the difference in means.
Mean Differences for Small Samples • Sample Size: rule of thumb • Total N (of both groups) > 100 can safely be treated as “large” in most cases • Total N (of both groups) < 100 is possibly problematic • Total N (of both groups) < 60 is considered “small” in most cases • If N is small, the sampling distribution of mean difference cannot be assumed to be normal • Again, we turn to the T-distribution.
Mean Differences for Small Samples • To use T-tests for small samples, the following criteria must be met: • 1. Both samples are randomly drawn from normally distributed populations • 2. Both samples have roughly the same variance (and thus same standard deviation) • To the extent that these assumptions are violated, the T-test will become less accurate • Check histogram to verify! • But, in practice, T-tests are fairly robust.
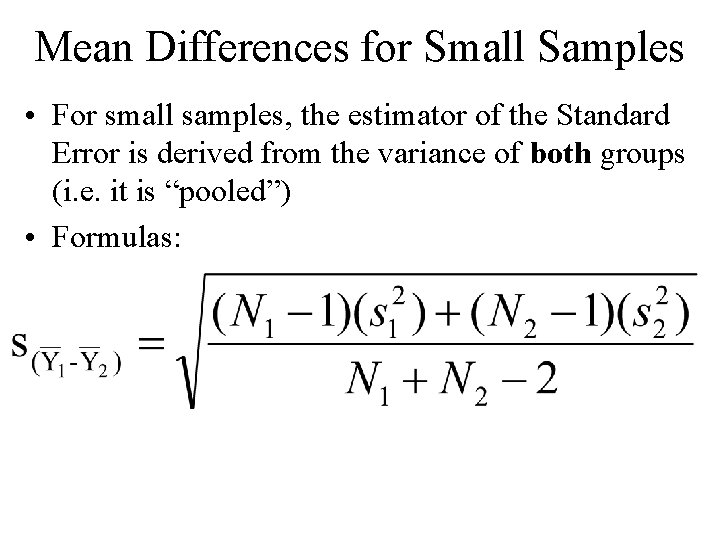
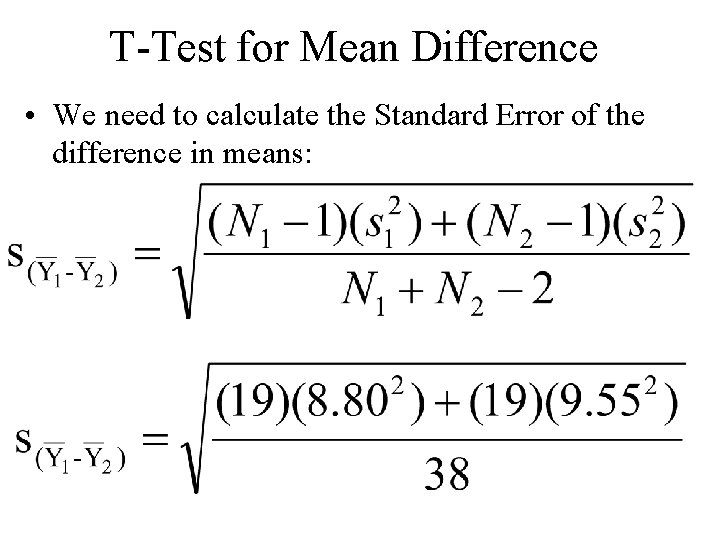
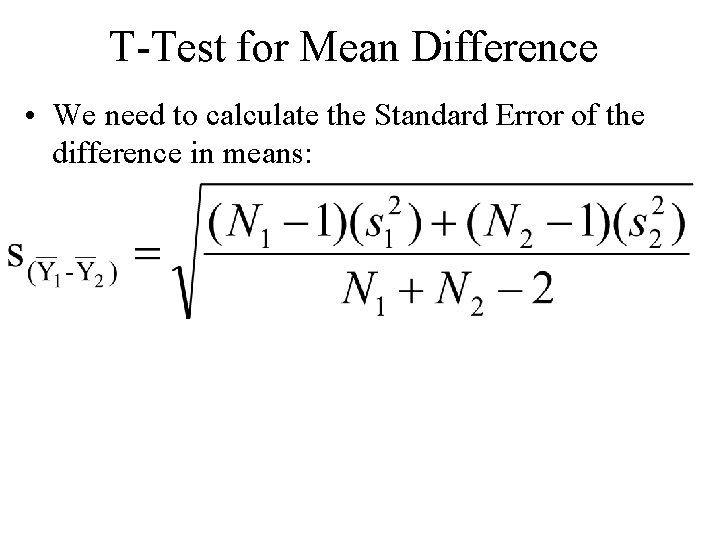
Mean Differences for Small Samples • For small samples, the estimator of the Standard Error is derived from the variance of both groups (i. e. it is “pooled”) • Formulas:
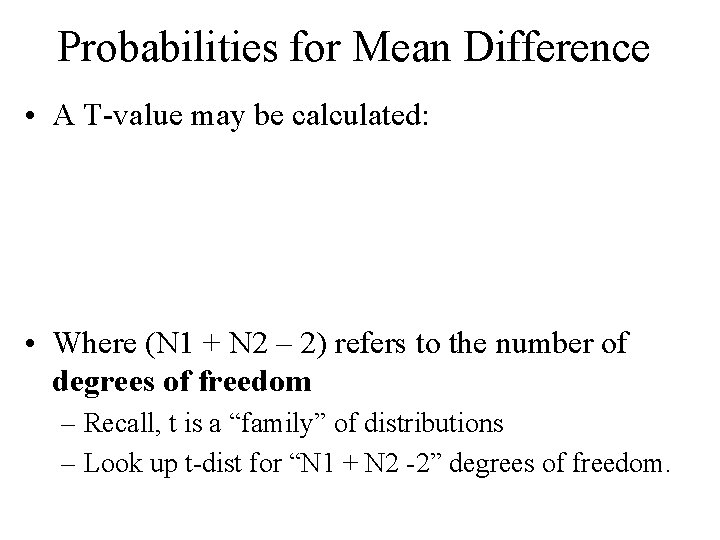
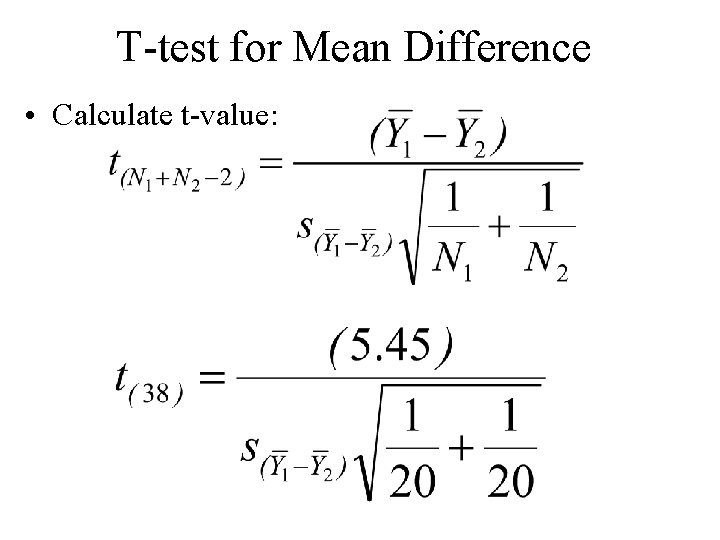
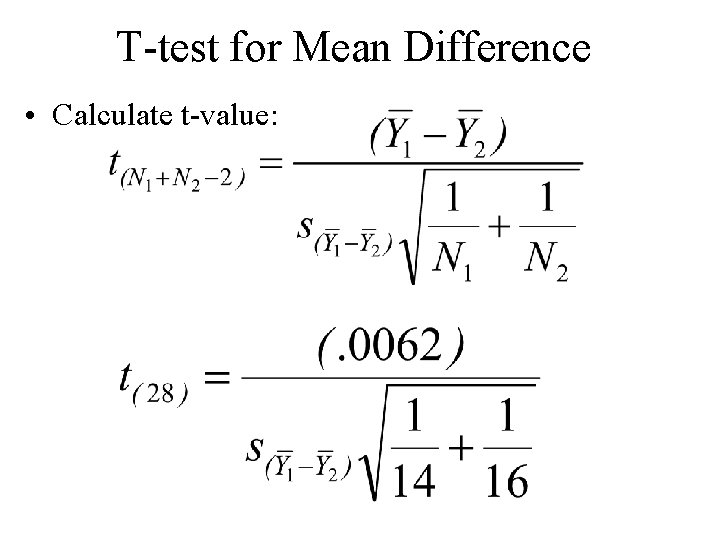
Probabilities for Mean Difference • A T-value may be calculated: • Where (N 1 + N 2 – 2) refers to the number of degrees of freedom – Recall, t is a “family” of distributions – Look up t-dist for “N 1 + N 2 -2” degrees of freedom.
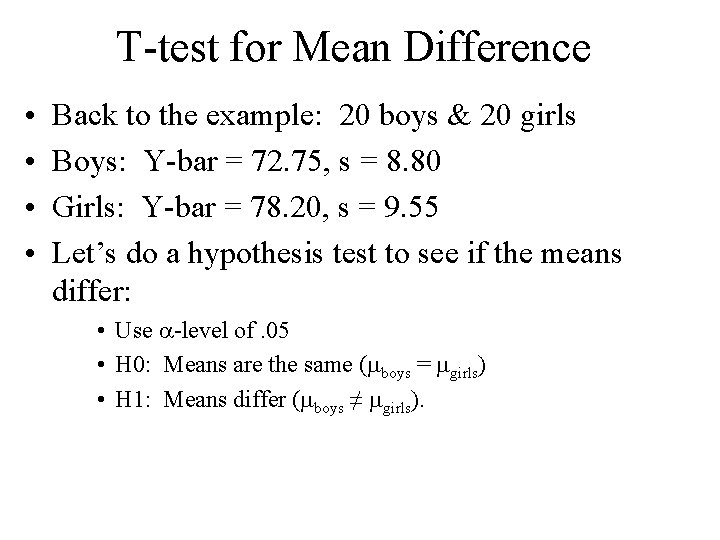
T-test for Mean Difference • • Back to the example: 20 boys & 20 girls Boys: Y-bar = 72. 75, s = 8. 80 Girls: Y-bar = 78. 20, s = 9. 55 Let’s do a hypothesis test to see if the means differ: • Use a-level of. 05 • H 0: Means are the same (mboys = mgirls) • H 1: Means differ (mboys ≠ mgirls).
T-test for Mean Difference • Calculate t-value:
T-Test for Mean Difference • We need to calculate the Standard Error of the difference in means:
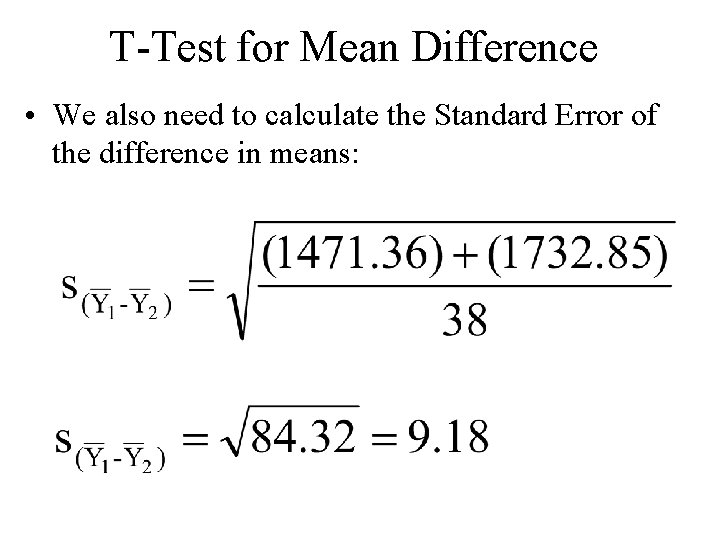
T-Test for Mean Difference • We also need to calculate the Standard Error of the difference in means:
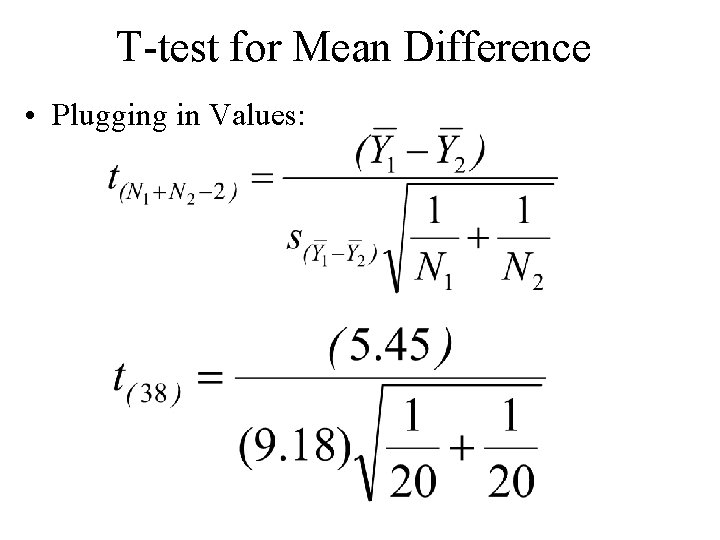
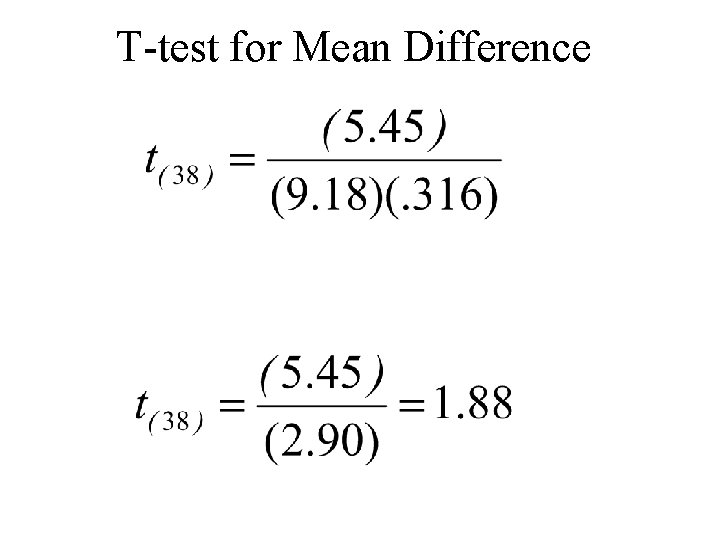
T-test for Mean Difference • Plugging in Values:
T-test for Mean Difference
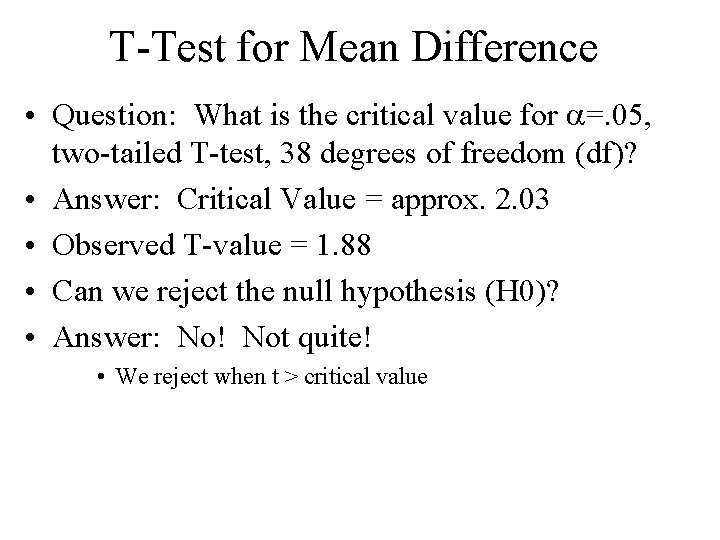
T-Test for Mean Difference • Question: What is the critical value for a=. 05, two-tailed T-test, 38 degrees of freedom (df)? • Answer: Critical Value = approx. 2. 03 • Observed T-value = 1. 88 • Can we reject the null hypothesis (H 0)? • Answer: No! Not quite! • We reject when t > critical value
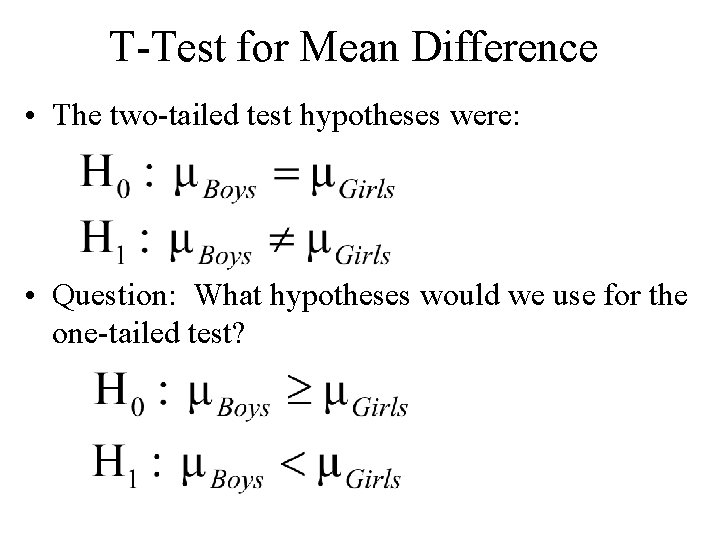
T-Test for Mean Difference • The two-tailed test hypotheses were: • Question: What hypotheses would we use for the one-tailed test?
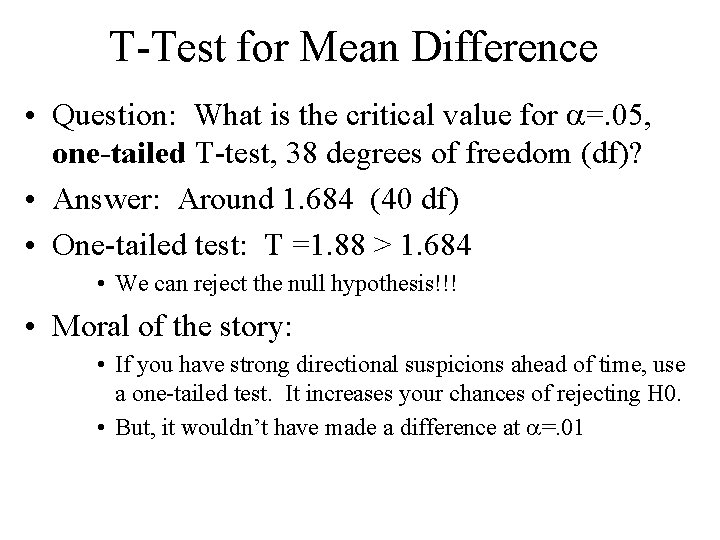
T-Test for Mean Difference • Question: What is the critical value for a=. 05, one-tailed T-test, 38 degrees of freedom (df)? • Answer: Around 1. 684 (40 df) • One-tailed test: T =1. 88 > 1. 684 • We can reject the null hypothesis!!! • Moral of the story: • If you have strong directional suspicions ahead of time, use a one-tailed test. It increases your chances of rejecting H 0. • But, it wouldn’t have made a difference at a=. 01
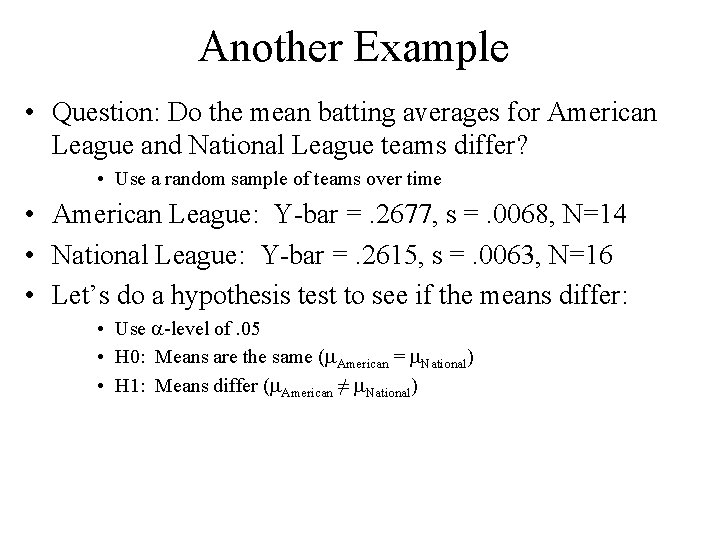
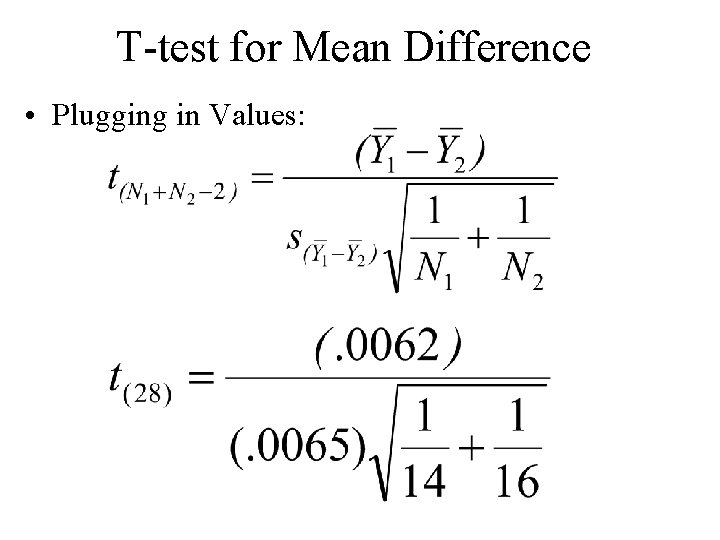
Another Example • Question: Do the mean batting averages for American League and National League teams differ? • Use a random sample of teams over time • American League: Y-bar =. 2677, s =. 0068, N=14 • National League: Y-bar =. 2615, s =. 0063, N=16 • Let’s do a hypothesis test to see if the means differ: • Use a-level of. 05 • H 0: Means are the same (m. American = m. National) • H 1: Means differ (m. American ≠ m. National)
T-test for Mean Difference • Calculate t-value:
T-Test for Mean Difference • We need to calculate the Standard Error of the difference in means:
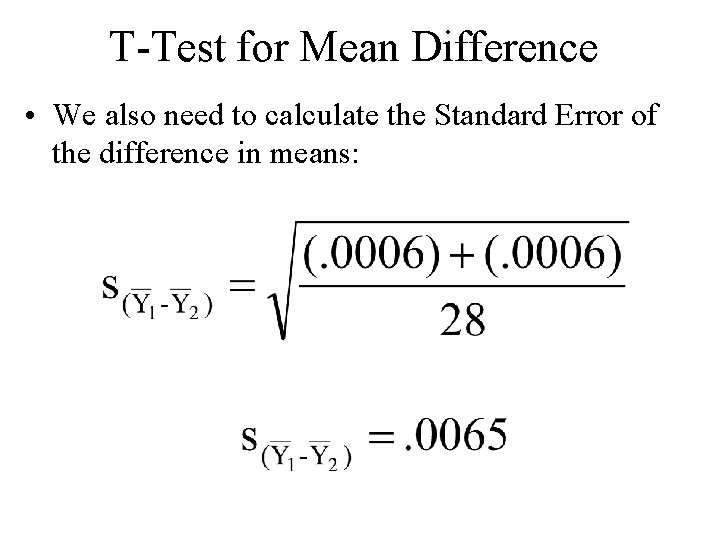
T-Test for Mean Difference • We also need to calculate the Standard Error of the difference in means:
T-test for Mean Difference • Plugging in Values:
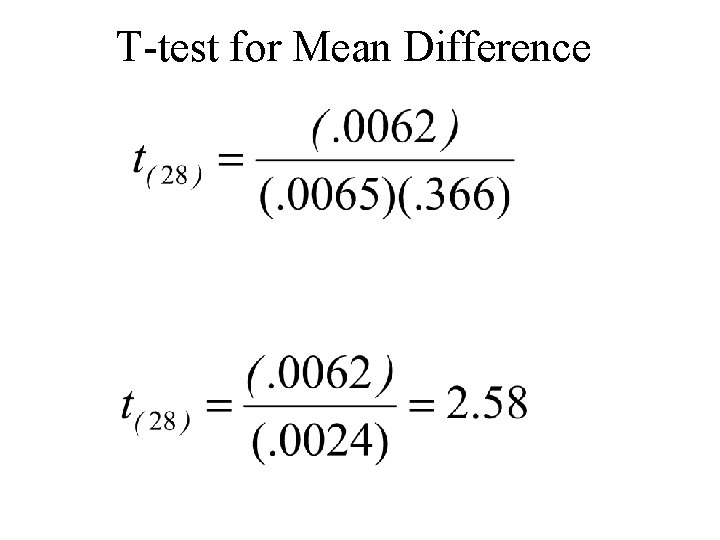
T-test for Mean Difference
T-Test for Mean Difference • Question: What is the critical value for a=. 05, two-tailed T-test, 28 degrees of freedom (df)? • Answer: Critical Value = approx. 2. 05 • Observed T-value = 2. 58 • Can we reject the null hypothesis (H 0)? • Answer: Yes • We reject when t > critical value • What if we used an a-level of. 01? – Critical value=2. 76
T-Test for Mean Difference • Question: What if you wanted to compare 3 or more groups, instead of just two? • Example: Test scores for students in different educational tracks: honors, regular, remedial • Can you use T-tests for 3+ groups? • Answer: Sort of… You can do a T-test for every combination of groups • e. g. , honors & reg, honors & remedial, reg & remedial • But, the possibility of a Type I error proliferates… 5% for each test • With 5 groups, chance of error reaches 50% • Solution: ANOVA.