Societys Fundamental Tasks Familys Fundamental Tasks GOV MARKET


 Problem Behavior Score National Survey of Children's Health 2004")


- Slides: 26
Society’s Fundamental Tasks Family’s Fundamental Tasks GOV MARKET SCHOOL FAMILY CHURCH SOCIETY FAMILY COUPLE INDIVIDUAL FAMILY CHURCH
Belonging: Male + Female SOCIETY AT LARGE FAMILY Child / Adult Father Mother
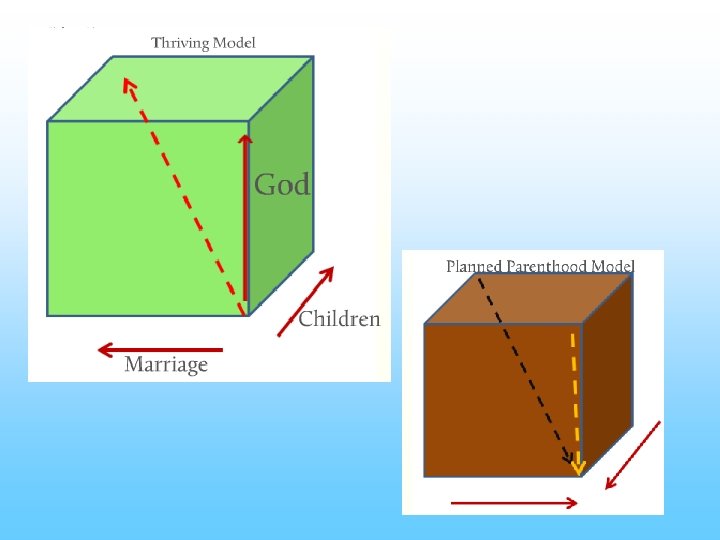
The Foundational Relationship For Society
The Non-Thriving Marriage / Child Relationship
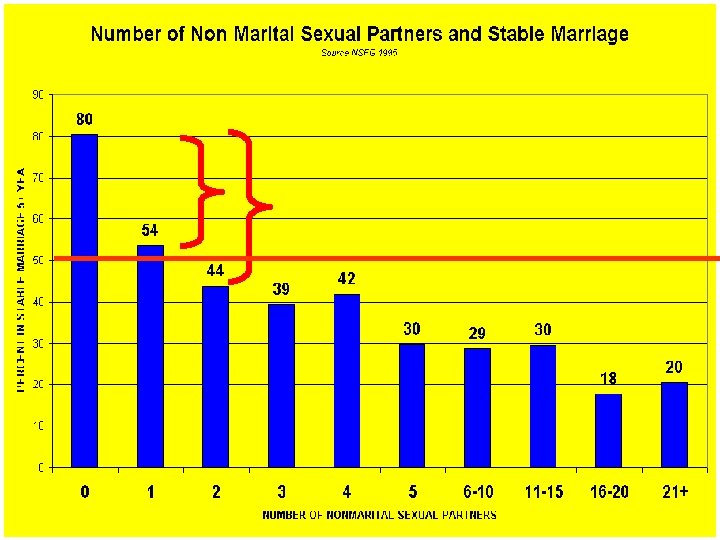
The More Sexual Partners the More Likely to Abort Source NSFG 1995 60 52 Percent who have abortions later 50 43 39 40 31 34 30 25 18 20 19 12 10 8 0 0 1 2 3 4 5 6 -10 11 -15 NUMBER OF NON MARITAL SEXUAL PARTNERS IN LIFETIME 16 -20 21+
Non-Marital Sexual Partners and Out-of-Wedlock Births Source: CDC, National Center for Health Statistics, National Survey of Family Growth, 1995 Percent of Sexually Active Women Aged 15 -44 with Children 60% 55. 21% 49. 45% 49. 99% 50% 44. 02% 40. 02% 49. 89% 47. 55% 42. 66% 40% 32. 89% 30% 20% 16. 29% 10% 1. 71% 0% Virgin at Time of First Marriage Had Pre. Marital Sex with First Husband 1 2 3 4 5 6 -10. 11 -15. Number of Lifetime Voluntary Non-Marital Sexual Partners 16 -20 21+
Non-Marital Sexual Partners And Single Motherhood Source: CDC, National Center for Health Statistics, National Survey of Family Growth, 1995 Percent of Sexually Active women Aged 15 -44 with Children 60% 56. 98% 53. 07% 50. 30% 48. 13% 47. 03% 6 -10. 11 -15. 44. 16% 40% 36. 48% 38. 81% 30. 21% 30% 20% 10% 7. 09% 0% 0 1 2 3 4 5 Number of Lifetime Non-Marital Sexual Partners 16 -20 21+
The Seasons for Growing
Fundamentals
Yearly Income, 2000, Families With Children $60, 000 Note: Figures do not include transferred income. $50, 000 $54, 000 $50, 000 $40, 000 $30, 000 $20, 000 $10, 000 $- $23, 000 $9, 400 $9, 100 Never Married Widowe Separated Divorce Cohabitatio Second+ First Marriage Marriag d d n
Median Net Worth of Families with Children under 18, 2000 Source: Survey of Consumer Finance 2001 $140, 000 $120, 250 $120, 000 $105, 360 $100, 000 $80, 000 $60, 000 $40, 000 $20, 540 $14, 850 $16, 540 $20, 000 $- $27, 800 $350 Never Married Separated. Cohabitation Widowed. Divorced Second+ First Marriage
Children in Poverty Unmarried Parents Same Parents Married 3. 93 Million Children 3. 17 Million Children Out of Poverty In Poverty 0. 75 Million Children Source R Rector: Analysis of CPS 2001
GPA Score Combined English/ Math Source Ad Health Survey Waves 1+2 1995 2. 9 2. 8 Combined English-Math Score 2. 85 2. 8 2. 75 2. 7 2. 65 2. 6 2. 55 2. 45 Weekly<Monthly<Yearly Frequency of Religious Attendance Never
Children in High Poverty Areas: Academic On-Track Performance Source Mark Regnerus J Sc Study of Relig 2003 3. 87 On-Track Academic Performance 3. 9 3. 8 3. 59 3. 7 3. 6 3. 5 3. 33 3. 4 3. 3 3. 2 3. 1 3 High Church Attendance Average Church Attendance Low Church Attendance
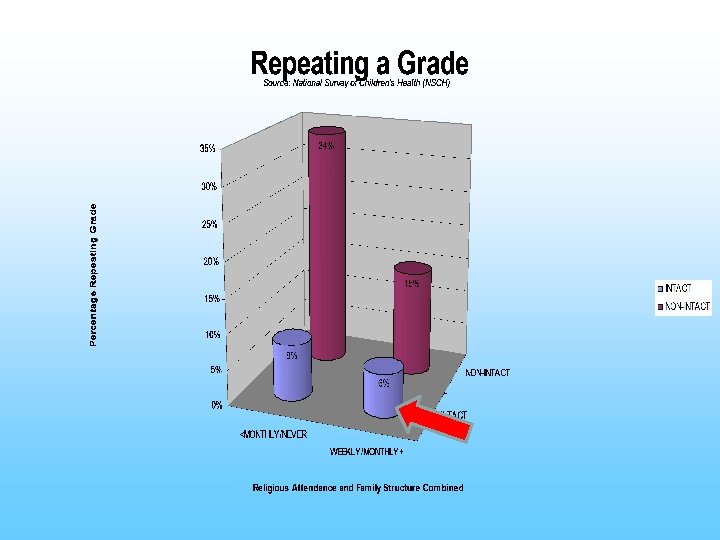
Problem Behavior in Children (mean) Problem Behavior Score National Survey of Children's Health 2004 51. 8 52 51. 1 51. 5 50. 4 51 50. 5 50 49. 2 49. 5 49 48. 5 48 47. 5 Weekly<Monthly<Yearly Frequency of Religious Attendance Never
GPA 2. 94 3 2. 9 2. 8 2. 72 2. 75 2. 7 2. 48 2. 6 2. 5 2. 4 2. 3 ANY REJECTION 2. 2 <MONTHLY/NEVER WEEKLY/MONTHLY+ INTACT/COHABIT(NATURAL)
THE 5 BASIC INSTITUTIONS Providing The Instruments MARKETPLACE Forming The Person SCHOOL CHURCH FAMILY GOV. Order Goods and Services Learning Orientation In Life The Person
GOVERNMENT MARKETPLACE SCHOOL CHURCH FAMILY