Social Studies Grade 7 Semester 1 Map Skills


- Slides: 17
Social Studies Grade 7 Semester 1 Map Skills Types of Maps
Warm up: What types of maps do you know and why do we need them?
Lesson objective: Learning the different types of maps and their uses.
Political Maps �Usually colored by country or by state �Political colors make it easy to compare size, shape, and location �Bold letters often make the country names stand out �Symbols make it easy to tell capitals from other cities �Political maps also name certain physical features, such as rivers and lakes
World Political Map
Physical Map �Has colors that make natural patterns or landforms stand out �The colors on the map can stand for types of vegetation, mountain, and natural features �Names of big natural features are easy to see �Physical maps also include some political information, such as boundaries
World Physical Map
Climate Map �The climate of a place is the weather it has season by season, year after year �Rainfall and temperature are climate’s main ingredients �Climate is affected by elevation, distance from the ocean, and latitude
World Climate Map
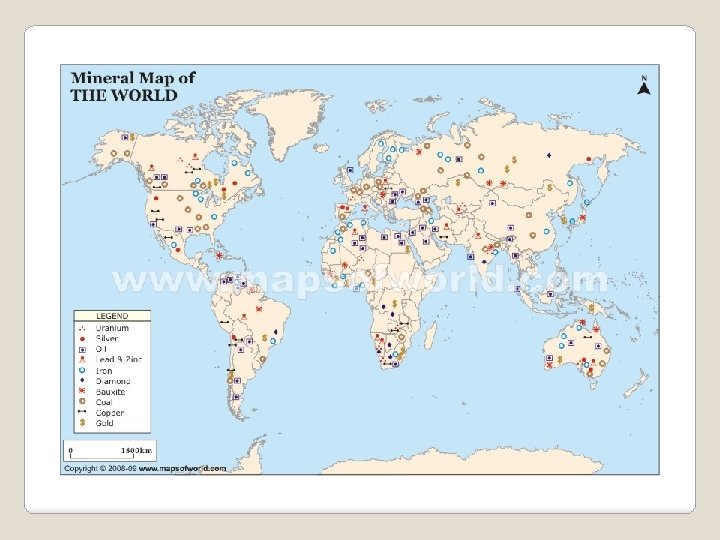
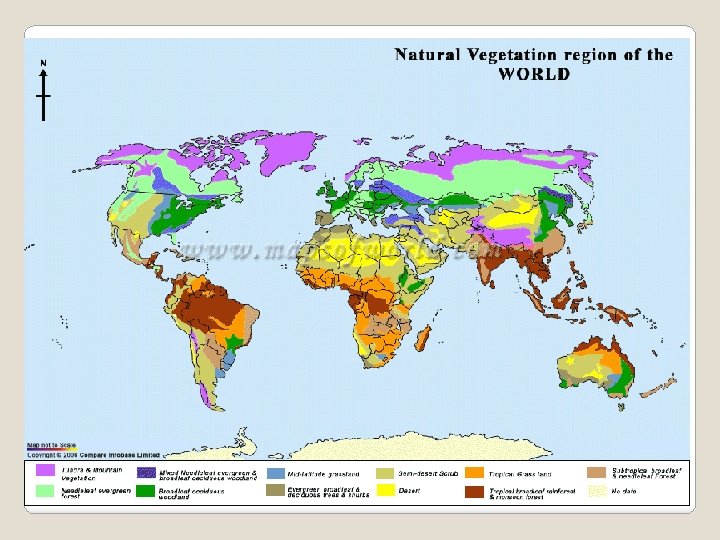
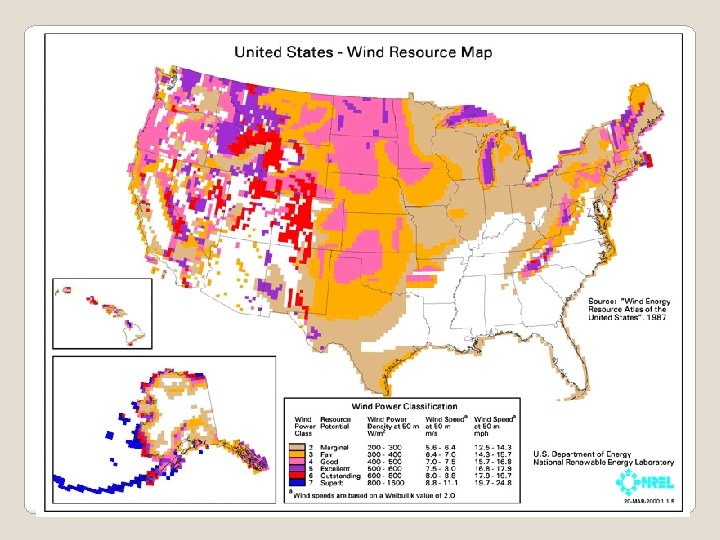
Land Use Resource Map These maps show land is being used. This might refer to: �vegetation �crops being grown �forest vs. Agriculture �mines and wells
Population Map • Colors represent a certain number of people living within a square mile or square kilometer. • Symbols might show metropolitan areas with populations of a particular size.
Population Map
Active practice: 1 - These colorful maps show lines that people use to divide countries and states. They also show major cities. ___________ 2 - These maps show physical features on the Earth like rivers, mountains, and deserts. ____________
Active practice: 3 - These maps show land is being used. For example, they might show which crops are being grown or what animals are being raised. _____________ 4 - These maps show climate regions. __________