Social Network Analysis Outline l Background of social

Social Network Analysis

Outline l Background of social networks – Definition, examples and properties l Data in social networks – Data creation, flow and storage l Analytic tasks in social networks – Problems, solutions and examples l Summary

What is a Social Network? l A definition from Wikipedia – A social network is a social structure made up of a set of social actors (such as individuals or organizations) and a set of the dyadic ties between these actors. – Social network analysis: uanalyze the structure of the whole network, uidentify local and global patterns, ulocate influential entities, and uexamine network dynamics.

Social Network Representation l Graph Representation l Matrix Representation

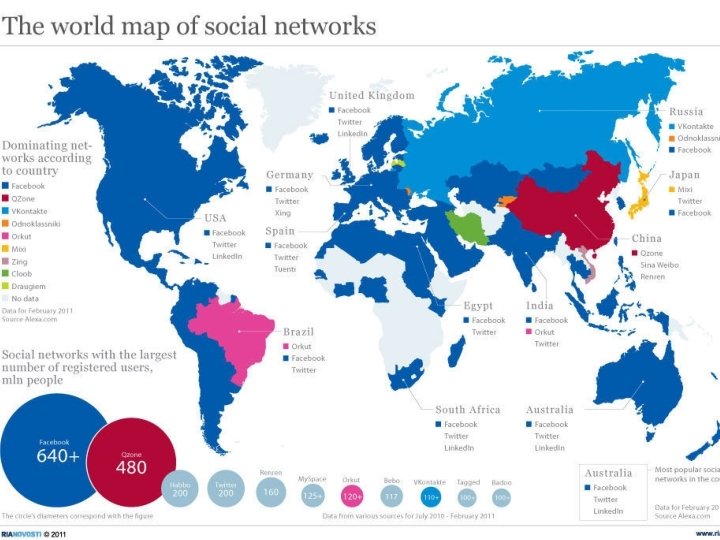
Social Network: Examples

The Scale and Growth of Social Networks l l Facebook statistics – 829 million daily active users on average in June 2014 – 1. 32 billion monthly active users as of June 30, 2014 – 81. 7% of daily active users are outside the U. S. and Canada – 22% increase in Facebook users from 2012 to 2013 Facebook activities (every 20 minutes on Facebook) – 1 million links shared – 2 million friends requested – 3 million messages sent http: //newsroom. fb. com/company-info/ http: //www. statisticbrain. com/facebook-statistics/

Visualizing Friendships on Facebook

The Scale and Growth of Social Networks l l Twitter statistics – 271 million monthly active users in 2014 – 135, 000 new users signing up every day – 78% of Twitter active users are on mobile – 77% of accounts are outside the U. S. Twitter activities – 500 million Tweets are sent per day – 9100 Tweets are sent per second https: //about. twitter. com/company http: //www. statisticbrain. com/twitter-statistics/

A Tweet Map of America

Properties of Large-Scale Social Networks l Scale-free distributions l Small-world effect l Strong community structure

Scale-free Distributions l Degree distribution in large-scale networks often follows a power law, that is, the fraction p(x) of nodes in the network having x connections to other nodes goes for large values of x as: l A. k. a. long tail distribution, scale-free distribution

Log-log Plot l Power law distribution becomes a straight line if plotted in a log-log scale Friendship Network in Flickr Friendship Network in You. Tube

Small-world Effect l “Six Degrees of Separation” l A famous experiment conducted by Travers and Milgram (1969) – Subjects were asked to send a chain letter to his acquaintance in order to reach a target person – The average path length is around 5. 5 l Verified on a planetary-scale IM network of 180 million users (Leskovec and Horvitz 2008) – The average path length is 6. 6 l Facebook users (721 million) were separated by 4. 74 degrees as of May 2011.

Diameter l Measures used to calibrate the small world effect – Diameter: the longest shortest path distance in a network – Average shortest path length l Example – The shortest distance between node 1 and node 9 is 4. – The diameter of the network is 5, corresponding to the shortest distance between nodes 2 and 9. The Longest Shortest Path

Community Structure l Community: People in a group interact with each other more frequently than those outside the group l Friends of a friend are likely to be friends as well l Measured by clustering coefficient: – density of connections among one’s friends

Clustering Coefficient l d 6=4, N 6= {4, 5, 7, 8} l k 6=4 as e(4, 5), e(5, 7), e(5, 8), e(7, 8) l C 6 = 4/(4*3/2) = 2/3 l Average clustering coefficient C = (C 1 + C 2 + … + Cn)/n l C = 0. 61 for the left network

Data in Social Networks l Data creation l Data flow l Data storage

Data Creation in Social Networks l User profiles and relationships l User-generated content – Text (blogs, microblogs, messages, reviews, etc. ) u 500 million tweets are sent per day. – Images, audio, and video u 100 hours of video are uploaded to You. Tube every minute.
 l Inexpensive to generate")
Distinction from Content in Traditional Media (Newspaper, TV, etc. ) l Inexpensive to generate and publish l Widely accessible l Varying quality l Rich user interaction
![Data Flow Architecture at Facebook [Thusoo et al. , SIGMOD’ 10] l Hadoop: a](http://slidetodoc.com/presentation_image/5b6f69e88f8f6bb8f563fea76d6edae1/image-21.jpg "Data Flow Architecture at Facebook [Thusoo et al. , SIGMOD’ 10] l Hadoop: a")
Data Flow Architecture at Facebook [Thusoo et al. , SIGMOD’ 10] l Hadoop: a distributed file system and map-reduce platform l Scribe: a distributed and scalable data bus that aggregates logs from web servers l Hive: a data warehousing framework for reporting, querying and analysis l Federated My. SQL: contains all the Facebook site related data

Data Storage at Facebook l The production cluster usually has to hold only one month’s worth of data l The ad hoc cluster needs to hold all the historical data, so that measures, models and hypotheses can be tested on historical data l Using gzip to compress data with a compression factor of 6 -7

Cold Data Storage l Facebook uses 10, 000 Blu-ray discs to store a petabyte (=1, 000 GB) of ‘cold’ data that hardly ever needs to be accessed, including duplicates of its users’ photos and videos that Facebook keeps for backup purposes. l The Blu-ray system reduces costs by 50% and energy use by 80% compared with its current cold-storage system, which uses hard disk drives.

Server Racks in Facebook’s Data Center

Data Analytic Tasks in Social Networks l Community detection l Friend recommendation l Importance of nodes l Influence propagation l Event detection

Community Detection

What is a Community? l Community: It is formed by individuals such that those within a group interact with each other more frequently than with those outside the group – a. k. a. group, cluster, cohesive subgroup, module in different contexts l Two types of groups in social networks – Explicit Groups: formed by user subscriptions – Implicit Groups: implicitly formed by social interactions
![Community Example [Mc. Auley and Leskovec, NIPS’ 2012]](http://slidetodoc.com/presentation_image/5b6f69e88f8f6bb8f563fea76d6edae1/image-28.jpg "Community Example [Mc. Auley and Leskovec, NIPS’ 2012]")
Community Example [Mc. Auley and Leskovec, NIPS’ 2012]

Subjectivity of Community Definition A densely-knit community Each component is a community Definition of a community can be subjective.

Community Detection l Community detection: discovering groups in a network where individuals’ group memberships are not explicitly given l Some social media sites allow people to join groups, is it necessary to extract groups based on network topology? – Not all sites provide community platform – Not all people want to make effort to join groups – Groups can change dynamically

Community Detection based on Cliques l Clique: a maximum complete subgraph in which all nodes are adjacent to each other Nodes 5, 6, 7 and 8 form a clique of size 4 In a clique of size k, each node maintains degree >= k-1 (for example, node 7 with degree 4) l Nodes with degree < k-1 will not be included in the clique (for example, node 9 with degree 1) l

Maximum Clique Example l In order to find a clique >3, remove all nodes with degree <=3 -1=2 – Step 1. Remove nodes 2 and 9 – Step 2. Remove nodes 1 and 3 – Step 3. Remove node 4
 l Clique is a very strict definition, unstable Normally use")
Clique Percolation Method (CPM) l Clique is a very strict definition, unstable Normally use cliques as a core or a seed to find larger communities l CPM is such a method to find overlapping communities l – Input u. A parameter k, and a network – Procedure u. Find out all cliques of size k in a given network u. Construct a clique graph. Two cliques are adjacent if they share k-1 nodes u. Each connected component in the clique graph forms a community

CPM Example Cliques of size 3: {1, 2, 3}, {1, 3, 4}, {4, 5, 6}, {5, 6, 7}, {5, 6, 8}, {5, 7, 8}, {6, 7, 8} Communities: {1, 2, 3, 4} {4, 5, 6, 7, 8}

Friend Recommendation

Friend Recommendation Example

What is Friend Recommendation? l Given a snapshot of a social network, can we recommend new friendships among its members that are likely to occur in the near future? – a. k. a. link prediction l Observation: Users do not form friendship at random with all other users. Instead, they tend to prefer other users that are “close” to them.

Popular Link Prediction Heuristics l Heuristic shortest path distance common neighbors Adamic/Adar Score Definition

Link Prediction Heuristics Example l

Link prediction accuracy* Link Prediction Accuracy Differentiating between different degrees is important In sparse graphs, length 3 or more paths help in prediction. For large dense graphs, common neighbors are enough The number of paths matters, not the length Random Shortest Common Adamic/Adar Path Neighbors Ensemble of short paths *Liben-Nowell & Kleinberg, 2003; Brand, 2005; Sarkar & Moore, 2007; Sarkar, 2010

Importance of Nodes

Importance of Nodes l Not all nodes are equally important l Find out the most important nodes (influential entities) in one network l Commonly-used measures – Degree Centrality – Closeness Centrality

Degree Centrality l The importance of a node is determined by the number of nodes adjacent to it – The larger the degree, the more important the node is – Only a small number of nodes have high degrees in many reallife networks l Degree Centrality l Normalized Degree Centrality:

Degree Centrality Example l Which node is the most important in the network? Node Degree Normalized centrality degree centrality 1 3 3/8 2 2 2/8 3 3 3/8 4 4 4/8 5 4 4/8 6 4 4/8 7 4 4/8 8 3 3/8 9 1 1/8

Closeness Centrality l l “Central” nodes are important, as they can reach the whole network more quickly than non-central nodes Importance measured by how close a node is to other nodes l Average Distance: l Closeness Centrality

Closeness Centrality Example Node 4 is more central than node 3

Influence Propagation

Influence Propagation l People are connected and perform actions. friends, fans, comment, link, rate, followers, etc. like, retweet, post a message, etc. [Castillo et al. , KDD’ 12]
: 8")
Real World Example l Hotmail’s viral climb to the top spot (90 s): 8 million users in 18 months! l Far more effective than conventional advertising by rivals and far cheaper too! [Castillo et al. , KDD’ 12]
![Application: Viral Marketing [Castillo et al. , KDD’ 12]](http://slidetodoc.com/presentation_image/5b6f69e88f8f6bb8f563fea76d6edae1/image-50.jpg "Application: Viral Marketing [Castillo et al. , KDD’ 12]")
Application: Viral Marketing [Castillo et al. , KDD’ 12]
![Application: Viral Marketing [Castillo et al. , KDD’ 12]](http://slidetodoc.com/presentation_image/5b6f69e88f8f6bb8f563fea76d6edae1/image-51.jpg "Application: Viral Marketing [Castillo et al. , KDD’ 12]")
Application: Viral Marketing [Castillo et al. , KDD’ 12]

Common Properties of Influence Propagation Models l A social network is represented as a directed graph, with each actor being one node; l Each node is started as active or inactive; l A node, once activated, will activate his neighboring nodes; l Once a node is activated, this node cannot be deactivated.
 l Independent cascade model (ICM)")
Well-known Influence Propagation Models l Linear threshold model (LTM) l Independent cascade model (ICM)

Linear Threshold Model l

Linear Threshold Model - Diffusion Process l 7 1 4

Independent Cascade Model l A node w, once activated at step t , has one chance to activate each of its neighbors randomly – For a neighboring node (say, v), the activation succeeds with probability pw, v (e. g. p = 0. 5) l If the activation succeeds, then v will become active at step t+1 l In the subsequent rounds, w will not attempt to activate v anymore. l The diffusion process, starts with an initial activated set of nodes, then continues until no further activation is possible

How does the Influence Spread? Green node: active Yellow node: activated successfully Red node: failed to be activated

Event Detection

Event Detection from Social Media l Social media is a great news source – Human sensors report very quickly – Tweet waves travel faster than earthquake waves! – Large amount of data with huge data rate l Event detection is of high value to – news reporters and analysts, and – online marketing professionals and opinion tracking companies.
![Bursty Event in Twitter – Forest Fire [Longueville et al. , LBSN’ 09]](http://slidetodoc.com/presentation_image/5b6f69e88f8f6bb8f563fea76d6edae1/image-60.jpg "Bursty Event in Twitter – Forest Fire [Longueville et al. , LBSN’ 09]")
Bursty Event in Twitter – Forest Fire [Longueville et al. , LBSN’ 09]

Bursty Event in Twitter - Earthquake Event detection and location estimation from tweets [Sakaki et al. , WWW '10] Kyoto Tokyo estimation by median Osaka estimation by particle filter actual earthquake center

Bursty Event in Twitter – i. Phone Release Steve Jobs announced the release of the fourth generation i. Phone at Apple WWDC 2010, causing huge wave in Twitter. [Xie et al. , ICDM’ 13]
![Twit. Info – Event Detection System [Marcus et al. , CHI’ 11]](http://slidetodoc.com/presentation_image/5b6f69e88f8f6bb8f563fea76d6edae1/image-63.jpg "Twit. Info – Event Detection System [Marcus et al. , CHI’ 11]")
Twit. Info – Event Detection System [Marcus et al. , CHI’ 11]

Summary l In this lecture, we introduce – social networks, examples and their properties – data creation, flow and storage in social networks – social network analysis tasks, applications and case studies

References l Community Detection and Mining in Social Media. Lei Tang and Huan Liu, Morgan & Claypool, September, 2010.
- Slides: 65