SOCIAL MAPPING OF ROMA IN THE REPUBLIC OF

SOCIAL MAPPING OF ROMA IN THE REPUBLIC OF NORTH MACEDONIA REGIONAL CONFERENCE: “REGIONAL METHODOLOGY FOR MAPPING HOUSING OF ROMA” ALBERT MEMETI 05 NOVEMBER 2019, SARAJEVO, BOSNIA AND HERZEGOVINA

DATA ON ROMA v Data on Roma – UNDP 2004, 2011, 2017 v Roma v IPA Inclusion Index, 2015 project “Local Integration of Refugees, Internally Displaced Persons and Minority Groups“, 2016 v “Rights to housing among Roma for sustainable urban development”, - Habitat Macedonia, 2017 v AECOM - Social Mapping, 2018
 Social map Infrastructure condition On an")
METHODOLOGY On a Community level (Roma settlements units) Social map Infrastructure condition On an Individual level (household units) Housing and infrastructure Employment and access to employment Health status and access to health Income and poverty

QUALITATIVE Participatory Appraisal Method Objective Tools Participatory Appraisal is a methodology for interacting with members of a community, understanding them and learning from them. It involves a process of communicating with them using a set of menus of methods that seek community participation. They are especially valuable in gathering information that will provide insights about people and the communities in which they live. These insights will, in turn, enable projects to: 1. Customize interventions according to the needs and circumstances of the particular communities 2. Better focus questions for quantitative surveys that may be carried out to complement the qualitative research, 3. Refine the approach and activities mid-stream as information is gathered for monitoring purposes, 4. Improve follow-on activities and inform future projects as a result of what is learned in evaluations. Participants Technique Social map - A map that is drawn by the participants and which shows the social structures and institutions found in the area. It focusses on drawing a map, household enumeration and location, trends in housing – decreasing or increasing, nearby population, religious group, migration and social structures Infrastructure and Resource map – Developing the content of the map with the community infrastructure (description of the neighbourhood context, water and sanitation, access to electricity, road infrastructure, physical assets and availability of the resources. Wealth and income perceptions – most important source of income, expenditure structure, income variation during the year, main occupation of the community Venn Diagram on institutions – mapping the institutions that are around the community as well as the distance of the community to the basic service providers – kindergarten, schools, hospital, bus station, Community members representatives NGOs Local municipalities Consultation meetings and Focus groups

QUANTITATIVE Survey Objective Principles Sample universe Sample frame The social mapping survey includes information on the socio-economic situation of individual households living in a particular (geographical) area of interest and provides information about households’ relative wellbeing based on a set of pre-defined indicators of interest. They survey is especially valuable in gathering quantitative information of Roma households that allows to draw conclusion on the entire population by deploying a sample methodology and interference methods and techniques. Customize interventions according to the needs and circumstances of the particular communities. Representative sample that has strong external validity in relationship to the target population in order the sample to be large enough meaning to represent the population. The findings from the survey can be generalized with confidence to the population of interest. Randomness – subset of statistical population in which each unit has an equal probability of being chosen. The households in Roma settlements or areas of compact Roma population; representatives of Roma population who implicitly identify themselves as Roma List of settlements on a municipal level from the Census with a significant share of Roma urban population updated with information from other sources (local experts who are knowledgeable about this minority population). Type of sample Three stage random representative sample stratified based on the distribution of the Roma population in the municipal level 1 st stage Clusters drawn randomly from each stratum municipal by number of sections (starting addresses) 2 nd stage Households chosen with equal probabilities, and selected by the method of random start or equal random walk 3 rd stage Sample size Sampling error Household member 16+, and selected by first birthday technique 550 Households nmin= 384 households Response rate = 70% Confidence interval = 95% Sample error = +/- 5% Technique Data collection Survey Questionnaire Through trained Enumerators with a mixed structure of Roma information centers’ staff and health mediators

SOCIAL MAPPING

DEMOGRAPHICS 2773 PERSONS 550 HOUSEHOLDS. 49 % WERE WOMEN 0 – 5 YEARS: 14% 6 – 14 YEARS: 16% 15 – 18 YEARS: 10% 19 – 64 YEARS- 57%) OVER 64: 3% THE HIGHEST NUMBER OF THE ASYLUM SEEKERS: BITOLA (58%), KOCANI (48%), KUMANOVO (44%) AND STRUMICA (30%). 7

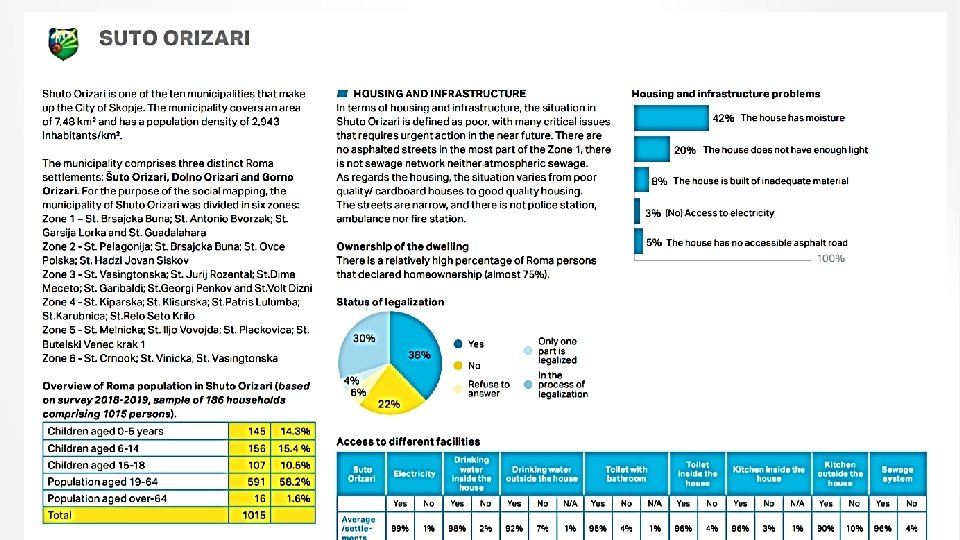
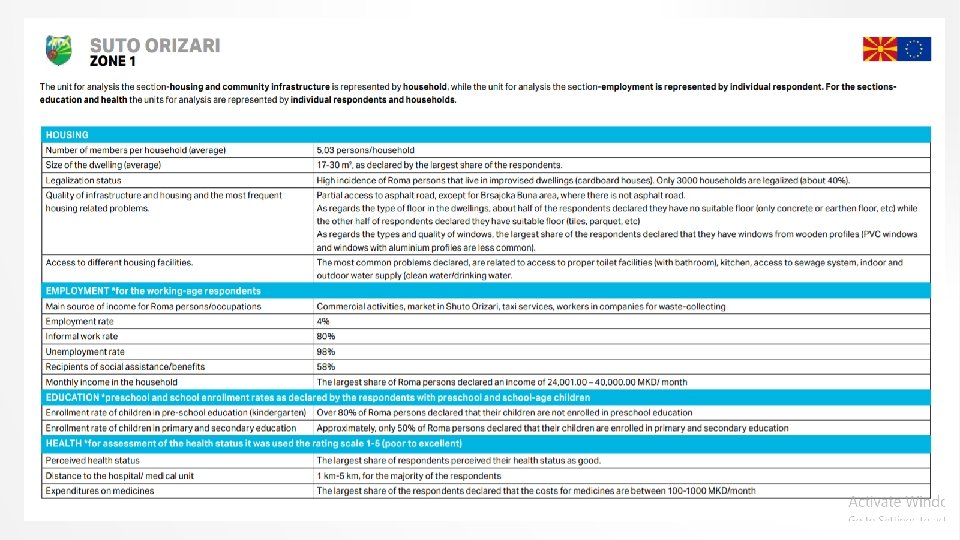
HOUSING Municipalitie s 10 - 16 m 2 Bitola 0% 8% Debar 0% Gostivar 6% Kavadarci 17 - 30 m 2 31 - 50 m 2 51 - 70 м 2 71 - 90 m 2 More than 90 m 2 50% 28% 14% 0% 0% 27% 20% 33% 9% 15% 18% 18% 0% 0% 33% 22% 22% 0% Kicevo 8% 17% 0% 13% 25% 8% 29% Kocani 0% 7% 11% 15% 48% 7% 11% Kumanovo 0% 8% 12% 15% 39% 15% 10% Prilep 0% 3% 17% 23% 33% 15% 8% Shuto Orizari 1% 11% 6% 29% 32% 12% 9% Stip 0% 0% 7% 13% 50% 27% 3% Strumica 0% 10% 30% 40% 10% 0% Tetovo 0% 0% 9% 38% 16% 9% 28% Veles 0% 0% 9% 0% 55% 36% 0% Vinica Average THE HIGHEST NUMBER IN A GIVEN HOUSEHOLD IS NOTED IN KICEVO (6. 83 PERSON IN ONE HOUSEHOLD); KAVADARCI (6. 22), GOSTIVAR (5. 79) AND SHUTO ORIZARI - 5. 46 PERSONS IN ONE HOUSEHOLD Less than 10 m 2 0% 0% 18% 29% 12% 41% 0% 5% 15% 22% 28% 17% 1% 11% AS SHOWN IN THE TABLE BELOW (TABLE 5), AROUND 44% OF THE ROMA POPULATION LIVE IN DWELLING LESS THAN 50 M 2. TAKING INTO CONSIDERATION THAT ON AVERAGE IN ONE HOUSEHOLD THERE ARE 5 MEMBERS, IT CAN BE CONCLUDED THAT THERE IS HIGH RATE OF OVERCROWDING. BASED ON THE MUNICIPAL L EVEL, HIGH OVERCROWDING CAN BE NOTICED IN BITOLA AND STRUMICA (OVER 80% OF THE POPULATION); MODERATE OVERCROWDING IS PRESENT IN KAVADARCI, SHUTO ORIZARI, PRILEP, VINICA (OVER 47%8 OF THE POPULATION)

LEGALIZATION Municipalities Bitola Debar Gostivar Kavadarci Kicevo Kocani Kumanovo Prilep Shuto Orizari Stip Strumica Tetovo Veles Vinica Total (national level) I do not know, I'm a tenant 6% 0% 0% 11% 0% 0% 2% 0% 0% 0% 1% Yes 17% 67% 41% 33% 46% 96% 12% 68% 41% 90% 50% 25% 64% 41% No 67% 13% 35% 44% 38% 0% 53% 15% 22% 3% 40% 6% 9% 59% Refuse to answer 0% 7% 0% 0% 0% 3% 3% 0% 0% 9% 0% 0% 45% 27% 2% Only one part, the other part is in the process of legalization 0% 0% 0% 11% 13% 0% 0% 0% 2% 0% 0% 3% 0% 0% 2% In the process of legalization 11% 13% 24% 0% 4% 4% 36% 13% 30% 7% 10% 56% 27% 0% 23% Only 45% of the Roma reported that they have legalized houses, while 1 % have rented house. Around 23% of the dwellings are in the process of legalization. the highest percentage is in Tetovo (56%), Kumanovo (36%), Shuto Orizari (30%), Veles (27%) and Kavadarci (24%) there is high percentage of dwellings that are not legalized (27%) and they present a potential case for eviction if their status soon is not solved. From those houses that are not legalized, the highest percentage is in Bitola (67%), Vinica (59%), Kumanovo (53%), Kavadarci (44%), Strumica (40%), Kicevo (38%) and Shuto Orizari (22%). 9

The house has moisture The house does not have enough light HOUSING Bitola • Quality of the house Debar Gostivar Kavadarci Kicevo Kocani Kumanovo Prilep Shuto Orizari Stip Strumica Tetovo Veles Vinica Total 10% 0% 9% 2% 5% 3% 14% 8% 27% 5% 2% 9% 2% 5% 52% 6% / 5% 2% 2% / 2% 7% 41% 5% 3% 7% 2% 17% 16% The house is built of inadequate material Do not have access to electricity 5% 5% 21% 5% 3% / / 18% 28% 5% / / / 10% 7% The house has no accessible asphalt road 10% / 10% 30% / / / 5% 25% / / 20% 4% 2% / 12% 3% / 2% 5% 33% 14% 3% 2% 9% 3% 14% 12% 52% of the Roma households self-reported that have moisture in their dwellings. Among the municipalities, the highest incidence of moisture is present in Shuto Orizari (27%); Kumanovo (14%), Bitola (10%) whereas in all the rest of the municipalities the incidence is less than 10%. 16% of the Roma reported that do not have enough lighting in the house, whereas the highest incidence is reported in Shuto Orizari and Vinica around 7% reported that their dwelling is built of inadequate material. Among the municipalities, the highest frequency is noticed in Shuto Orizari, Prilep, Gostivar and Vinica only 4% of the Roma communities reported that they do not have access to electricity. Among the municipalities, in Kavadarci is reported the highest frequency (30%), Shuto Orizari (25%) and the municipality of Vinica (20%). Around 12% of the respondents reported that their houses do not have access to asphalt road. Among the municipalities the highest frequency is reported in Prilep (33%), Shuto Orizari and Vinica (14%), Gostivar 12% and Tetovo with 10%. 10

2. 2% Access to sewage system 5. 1% Kithen outside thr house Kitchen insidw the house 1. 8% Toilet inside the house 1. 6% Toilet with a bathroom 2. 0% Aceess to electricity 79% 82% 19% 80% 13% 30% 68% 20% 3. 6% Clean water outside the house Clean water inside the house 18% 0. 7% 78% 28% 69% 10% 89% 0. 4%5% 0% 10% 94% 20% 30% 40% Refuse to answer 50% No 60% 70% 80% 90% 100% Yes As shown in the figure, 18% of the households do not have access to sewage system, 30% of them do not have toilet inside the house, 20% of them do not have toilet with a bathroom and around 10% of the Romani households do not have clean water inside the house. On the municipal level, the most vulnerable situation was registered in Shuto Orizari, Prilep, and Kumanovo. 11

QUESTIONS
- Slides: 15