SO 442 Lesson 7 El Nio La Nia


 Darwin Tahiti The Southern Oscillation is")
")

 as")


 Warm water heats the atmosphere, the air rises, and")
-than-average")
 East")


 Index is based on 6 parameters relevant")
 What is coming in the next year")


 Real-time data from the equatorial Pacific Ocean (collected")


 and")
 for Climate Prediction at Columbia University’s")
- Slides: 47
SO 442 Lesson 7 El Niño, La Niña and the Southern Oscillation Notes adapted from material from NOAA CPC, Univ. of Kentucky, Univ. at Albany, and Rutgers Univ
Lesson Objectives § Describe the major teleconnection pattern in the tropical Pacific ocean: the El Niño-Southern Oscillation (ENSO) § Examine several methods used to describe ENSO § Visualize regional impacts (temperature, precipitation, extreme events) and mechanisms for the teleconnected impacts
Some History • In the early 20 th Century, Sir Gilbert Walker discovered a recurrent pattern in sea level pressure data from the Pacific region. • He called this pattern “The Southern Oscillation. ”
The Southern Oscillation Sir Gilbert Walker (1868 -1958) Darwin Tahiti The Southern Oscillation is a “see-saw” pattern in sea level pressures between two locations: Darwin (Australia) and Tahiti
The Oceanic Connection Jacob Bjerknes (1897 -1975)
Ekman Transport • We discussed Ekman transport before: – Ekman transport is an ocean response to surface winds balanced by Coriolis force • In the Northern Hemisphere, the Ekman ocean transport is directed to the right of the wind flow. (It is directed to the left in the Southern Hemisphere)
Equatorial Upwelling There is often ocean upwelling (cool water coming to the surface) as a result of the surface winds along the equator
Coastal Upwelling • Ekman transport also occurs along major coastlines – Persistent surface winds (red arrow) and surface ocean currents (black arrow) result in net motion of surface waters away from the coast. – That motion away from the coast requires upwelling of water from below to satisfy continuity of mass. Andes Mts. S. Pacific Ocean
Equatorial upwelling is a real thing Winds have a major influence on tropical SST pattern. Equatorial Upwelling Coastal Upwelling
SST and Atmospheric Circulation Rising air; clouds and precipitation Sinking air; very little precipitation Walker Circulation Warm Cold Western Equatorial Pacific Eastern Equatorial Pacific
In the tropics… • Sea surface temperatures are strongly influenced by surface winds. • Atmospheric circulation is strongly influenced by the sea surface temperatures. • Therefore… Strong air-sea interactions are possible
Chronology of Events in the History of Understanding El Niño and La Niña late 1800 s Fishermen coin the name El Niño to refer to the periodic warm waters that appear off the coasts of Peru and Ecuador around Christmas. 1928 Gilbert Walker describes the Southern Oscillation, the seesaw pattern of atmospheric pressure readings on the eastern and western sides of the Pacific Ocean.
1957 Large El Niño occurs and is tracked by scientists participating in the International Geophysical Year. Results reveal that El Niño affects not just the coasts of Peru and Ecuador but the entire Pacific Ocean. 1969 Jacob Bjerknes, of the University of California, Los Angeles, publishes a seminal paper that links the Southern Oscillation to El Niño.
1975 Klaus Wyrtki, of the University of Hawaii, tracks sea levels across the Pacific and establishes that an eastward flow of warm surface waters from the western Pacific causes sea surface temperatures to rise in the eastern Pacific. 1976 Researchers use an idealized computer model of the ocean to demonstrate that winds over the far western equatorial Pacific can cause sea surface temperature changes off Peru.
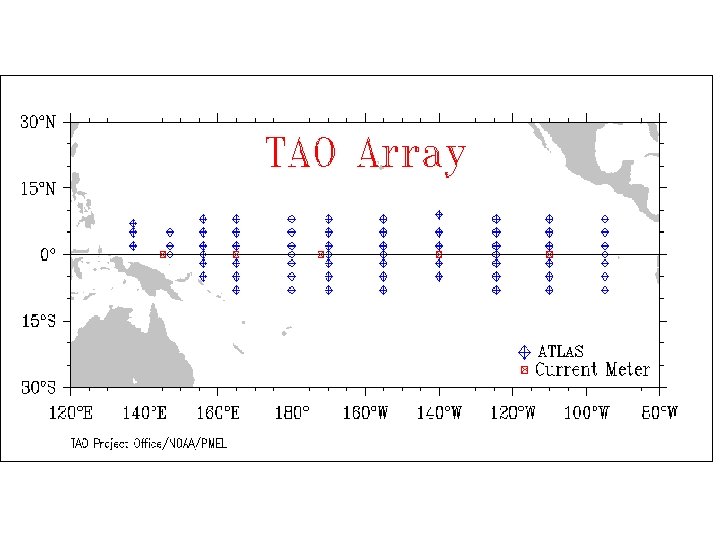
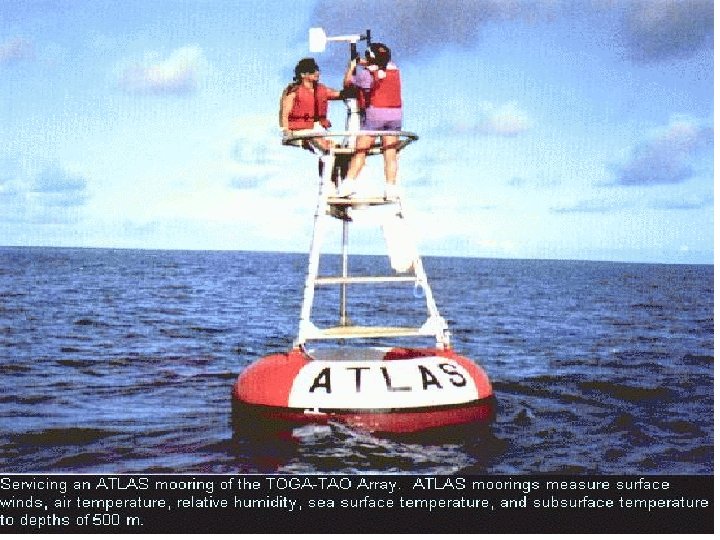
1982 A severe El Niño develops in an unexpected manner, but its evolution is recorded in detail with newly developed ocean buoys. 1985 Several nations launch the Tropical Ocean. Global Atmosphere (TOGA) program, a 10 year study of tropical oceans and the global atmosphere. 1986 Researchers design the first coupled model of ocean and atmosphere that accurately predicts an El Niño event in 1986.
1988 Researchers explain how the "memory" of the ocean--the lag between a change in the winds and the response of the ocean--influences terminations of El Niño and the onset of La Niña. 1996 -1997 The array of instruments monitoring the Pacific, plus coupled ocean-atmosphere models, enable scientists to warn the public of an impending El Niño event.
Observing El Nino
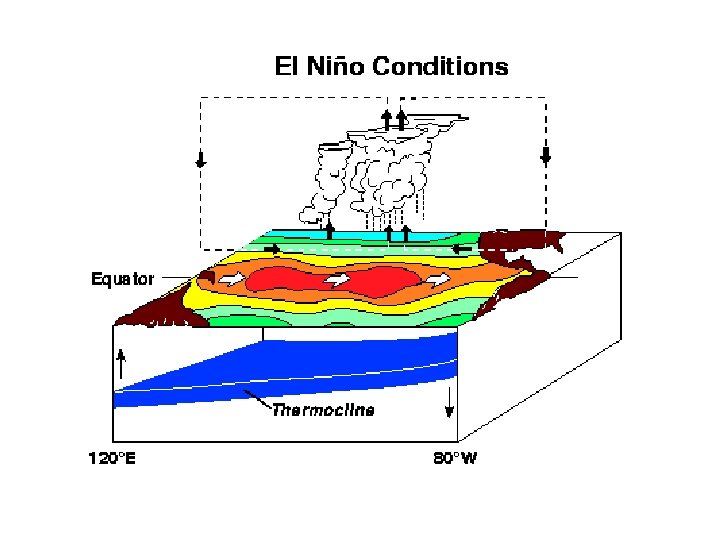
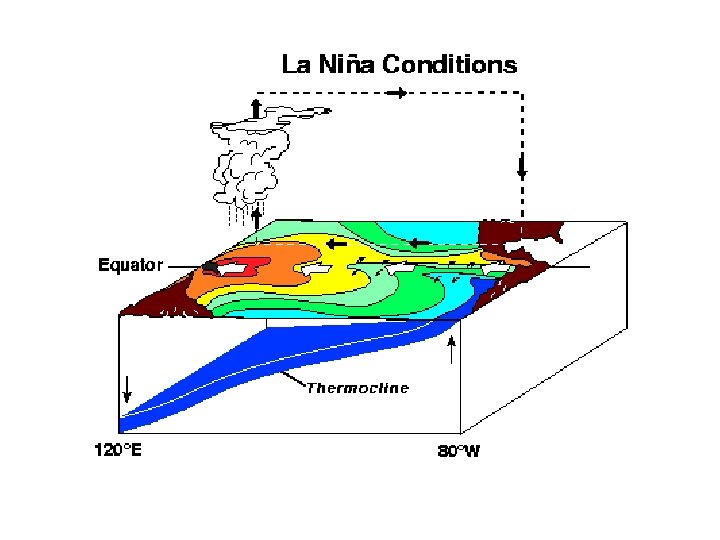
La Niña conditions: Strong cold tongue El Niño conditions: Cold tongue absent
Precipitation Enhanced rainfall occurs over warmer-thanaverage waters during El Niño. Reduced rainfall occurs over colder -than-average waters during La Niña.
Sea Level Pressure El Niño: Positive SLP anomalies over the western tropical Pacific, Indonesia and Australia. Negative SLP anomalies over eastern tropical Pacific, middle and high latitudes of the North Pacific, and over U. S. Opposite pattern for La Niña. The pressure see-saw between the eastern and western tropical Pacific is known as the Southern Oscillation.
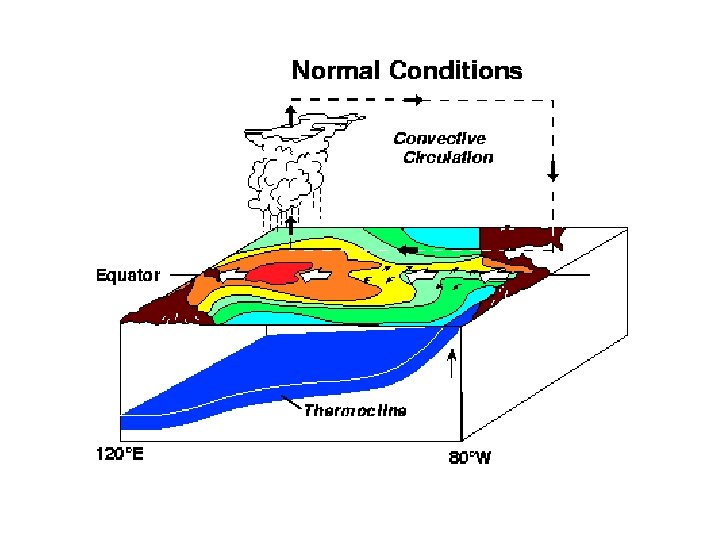
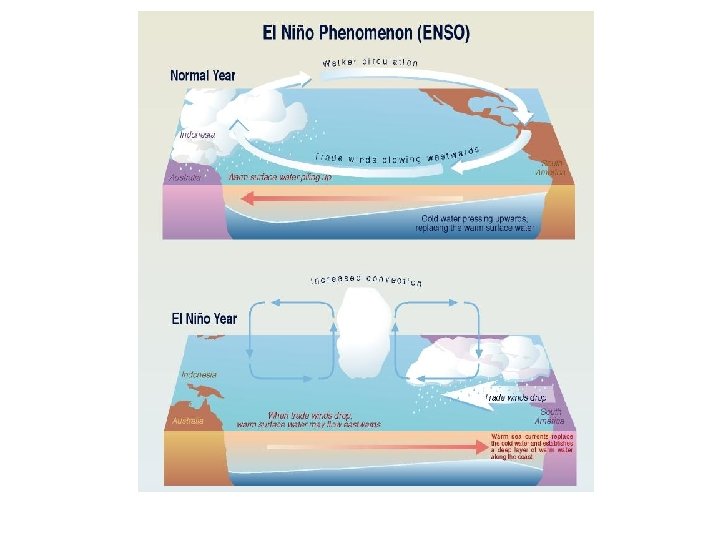
What is “Average? ” (2) Warm water heats the atmosphere, the air rises, and low-level trade winds converge toward the warm water. Subsiding air occurs in the eastern Pacific basin. Warm Cold Winds and Sea Surface Temperature are COUPLED. The SSTs influence the winds and vice versa. (1) Easterly trade-winds help push warm water to the western Pacific and upwell cold water along the equator in the eastern Pacific Ocean. December-February Average Conditions Warm Cold
Low-Level Winds & Thermocline Depth La Niña: stronger-than-average easterlies lead to a deeper (shallower)-than-average thermocline in the western (eastern) eq. Pacific. El Niño: weaker-than-average easterlies lead to a deeper (shallower)-than-average thermocline in the eastern (western) eq. Pacific.
Recent history of El Niño and La Niña West (by the date line) East (by Ecuador/Peru) Sea surface temperatures along the equator
Recent history of El Niño and La Niña Another view of evolution of sea surface temperatures (as anomalies, departure from the 1981 -2010 mean) Note the reversal of anomalies. Not every El Niño (or every La Niña) is strong
Measuring the ‘pulse’ of ENSO: Use of time series indices to describe climate variability Traditional indices rely on average temperature conditions in the tropical Pacific (NINO 1, 2, 3, 4 and NINO 3. 4 indices) 1. obtain monthly averaged SST data 2. get a reference ‘normal’ SST state (e. g. 30 -yr average) 3. Calculated for each time step SST anomaly SSTA(t) = SST(t) -Climatology 4. (Do some temporal smoothing, seasonal averaging etc)
Measuring the ‘pulse’ of ENSO: Use of time series indices to describe climate variability • We have seen that ENSO is tightly linked to the atmosphere (sea level pressure anomalies, winds, rainfall). • A new method of measuring ENSO variability makes use of these different ocean-atmosphere variables. • With the aid of statistical methods all this information was combined into one index: Multivariate ENSO index (MEI).
Multivariate ENSO Index (up to Nov. 2017) Index is based on 6 parameters relevant to phase of ENSO: sea level pressure sea surface temperature cloudiness zonal and meridional wind at surface air temperature http: //www. esrl. noaa. gov/psd/people/klaus. wolter/MEI/
Multivariate ENSO Index (up to Nov. 2017) What is coming in the next year or two? Index is based on 6 parameters relevant to phase of ENSO: sea level pressure sea surface temperature cloudiness zonal and meridional wind at surface air temperature http: //www. esrl. noaa. gov/psd/people/klaus. wolter/MEI/
El Niño’s Life Cycle Initiation Peak Source: IRI Decay
Measuring the impacts of ENSO in remote regions such as the US, Africa, or Antarctica Studying the impact of ENSO on the global climate Observation-based statistical analysis methods: With the index for ENSO variability we can compare temperature, precipitation time series from all parts of the world with the ENSO index. Model-based analysis of ENSO impacts: Global climate models (the standard term is “General Circulation Model”, GCM) can be used to study: (a) How does the atmosphere respond to a prescribed SST anomaly typical for El Nino or La Nina events (b) Coupled ocean-atmosphere models These models generate their own ENSO variability => allows for statistical analysis in same way as with observations
Mechanisms for remote impacts of ENSO § Latent heating associated with tropical precipitation anomalies excites waves in the atmosphere: § § § Atmospheric equatorial Kelvin and Rossby waves propagate zonally. Associated subsidence warms troposphere and suppresses precipitation Rossby waves can also propagate into extratropics (especially in winter) causing largescale circulation anomalies which impact weather. (Note that propagation requires a westerly mean flow and the relevant Rossby waves have an eastward group velocity)
Source: D. Neelin
Source: D. Neelin
Global El Niño Impacts are generally more extensive during the northern winter.
Global La Niña Impacts Mid-latitude impacts generally occur during the winter season (NH – DJF; SH- JJA).
What about the daily weather in the midlatitudes? Does it really care about the tropics? Remember that El Nino and La Nina events develop over months, usually peak in their amplitude during the months Dec-Feb, and then decay thereafter. But the mid-latitude weather is highly variable in daily to weekly time scales.
Forecasting ENSO Forecasters rely on: (1) Real-time data from the equatorial Pacific Ocean (collected from buoys, satellites, etc) and their knowledge of previous ENSO episodes (2) Dynamical models: mathematical equations combined with current observations and run on a computer - NCEP Climate Forecast System (CFS): a “coupled” computer model (ocean and atmosphere interact) (3) Statistical models: use observations of the past to make predictions of the future - Consolidated Forecast Tool (“CON”): statistically combines different models to take advantage of independent information provided by each model https: //iri. columbia. edu/ourexpertise/climate/forecasts/enso/current/? enso-sst_table
How well do models predict ENSO? • Statistical and Dynamical models have comparable forecast skill. • Models have trouble with transition timing and predicting amplitude of ENSO events. • Stronger ENSO events tend to be better predicted than weaker ones. • “Spring barrier: ” historically, forecasts before the Northern Hemisphere Spring have low skill. • Intraseasonal variability (i. e. MJO) is not captured in most of these models and this phenomenon can have considerable impact on ENSO evolution.
Why does ENSO occur? The delayed oscillator The leading theoretical model is the delayed oscillator [see Battisti and Hirst, 1989]: Here, Ts is the temperature in the East Pacific, b and c are positive constants, and is a time-lag determined by equatorial oceanic adjustment. • The first term on the RHS can be thought of a representing a positive feedback associated with the atmosphere, e. g. , the large-scale Darwin. Tahiti pressure difference (the SOI). • The second term represents a negative feedback associated with thermocline adjustment via equatorial waves. • The time delay is the time required for Rossby waves to propagate westward, reflect at the boundary, and return to the region of origin.
Equatorial Kelvin & Rossby Waves 2 -layer oceanic SWE model Surface currents (l) and thermocline displacements (r) for a Gaussian perturbation Kelvin wave: Non-dispersive, eastward propagating (~2 m/s for H = 150 m) Rossby waves: Dispersive, westward propagating (fastest is 1/3 of Kelvin wave group velocity)
More information • The International Research Institute (IRI) for Climate Prediction at Columbia University’s Lamont-Doherty Earth Observatory has an excellent web site with information on El Niño. • http: //iri. columbia. edu/our-expertise/climate/enso/