Smoothed Maps This is a Smoothed Map Ideas


- Slides: 18
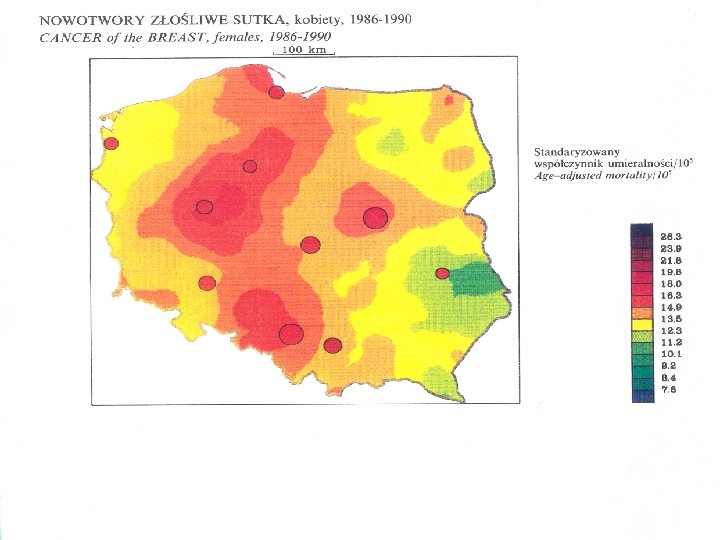
Smoothed Maps
This is a Smoothed Map
Ideas Behind Smoothing • To avoid arbitrary political boundaries • To adjust unstable estimates towards a global mean • To borrow strength from neighboring areas
Spatial Smoothing Techniques • • Rates/RRs in disjoint areas such as counties Empirical Bayes Headbanging Spatial Filters / Kernel Smoothers All techniques may be used for rates, proportions or relative risks. The latter also for probabilities.
Empirical Bayes Global smoothers adjust each area estimate towards a global mean. Local smoothers adjust each area estimate up or down depending on the data in neighboring areas. Review: Devine OJ, Louis TA, Halloran ME. Empirical Bayes methods for stabilizing incidence rates before mapping. Epidemiology, 5: 622 -630, 1994.
Headbanging Adjusts estimates in an area by borrowing strength from neighbouring areas. Hansen KM. Headbanging: Robust smoothing in the plane. IEEE Transactions on Geoscience and Remote Sensing, 29: 369 -378, 1991. Mungiole M, Pickle LW, Simonson KH. Application of a weighted head-banging algorithm to mortality data maps. Statistics in Medicine, 18: 3201, 1999.
Pickle et al: United States Mortality Atlas
Spatial Filters / Kernel Smoothers Calculates rates / RRs in multiple overlapping circular areas. The rate / RRs for each circle is depicted at the center of that circle.
x x x x x
Spatial Filters / Kernel Smoothers Larger Circles = More smoothing and more stable estimates Smaller Circles = Less smoothing but higher geographical resolution
Spatial Filters / Kernel Smoothers Circles of fixed geographical size provides equal geographical resolution across the map. Circles of fixed population size provides equally reliable estimates across the map.
Spatial Filters / Kernel Smoothers Rather than a simple circle, one can use a kernel with a higher weight in the center and gradually lower weights further away as one moves away from the center.
Smoothed Probability Maps Provides contours of p-values
Low Birth Weight in Des Moines, Iowa Rushton & Lolonis Statistics in Medicine 1996
Spatial Filters / Kernel Smoothers References Kafadar K. Smoothing geographical data, particularly rates of disease. Statistics in Medicine, 15: 2539 -2560, 1996. Rushton G, Lolonis P. Exploratory spatial analysis of birth defect rates in an urban population. Statistics in Medicine, 15: 717 -726, 1996. Talbot TO, et al. Evaluation of spatial filters to create smoothed maps of health data. Statistics in Medicine, 19: 2399 -2408, 2000.
Exploratory/Descriptive Techniques • • Maps of rates or relative risks Probability maps Smoothed rates or relative risks Smoothed probability maps
Maps of rates and probability maps are very useful for descriptive purposes Problem Maps of Rates: No statistical testing Probability Maps: Multiple testing Solution Tests for Spatial Randomness: One test