SME Participation in Horizon 2020 Including SME Instrument

 & SC* 'Innovation")


 for: 1. 2.")

 for:")


 • Continuously open call with around")


- Slides: 24
SME Participation in Horizon 2020 Including SME Instrument Phase 1 DG Research and Innovation, Unit B. 3 SMEs, Financial Instruments and State Aid @ NCP Training October 7, 2014
Horizon 2020 for SMEs 20 % budgetary target in LEITs (IL) & SC* 'Innovation in SMEs' (IL) 'Access to Risk Finance' (IL) MSCA (ES) Collaborative Projects 13% SME Instrument 7% Eurostars II Enhancing Innovation Capacity Innov. Fin – EU Finance for Innovators & accompanying measures Fellowships (Access to Skills) *= ~ EUR 9 billion of direct SME support. over the period 2014 -2020
Horizon 2020 Global View – SME participation in the 3 Pillars (excl. 'Innovation in SMEs' & 'Access to Risk Finance') An Encouraging Start
An Encouraging Start! • 9 months into Horizon implementation. SMEs represent… • • 1/4 of applicants (24. 82%) 1/5 of beneficiaries (19. 55%) 1/6 of budget allocation (16. 18%) What about the target (set by Council and EP) to allocate 20% of the budget for Societal Challenges and LEITs to SMEs? • For Societal Challenges. we are at close to 12% (11. 98%) • For LEITs. we are at about 21. 4% (21. 46%) • For both together we are currently at 18. 12% • This while the full impact of SME instrument funding has not kicked in yet (no phase 2 yet) • On the basis of an extrapolation taking into account the full impact of SME instrument phase 2, it can be assumed that the target will be exceeded by 2 -3% for 2014 -2015
SMEs in Excellent Science: A Mixed Bag • Two sections out of four with high relevance for SME participation: 1. Future and Emerging Technologies (FETs) 2. Marie-Skłodowska-Curie Actions (MSCA) • For FETs: suboptimal results, given relative attractiveness of the topics for SMEs (esp. start-ups): • • • 7. 4% of all applicants are SMEs 4. 2% of all beneficiaries are SMEs 5. 4% of the budget goes to SMEs 12. 09% of SME applicants are successful (vs. 20. 96% of all applicants) For MSCA: first information confirms that SMEs have found their way to this scheme: • • 11. 76% of applicants are SMEs 13. 77% of beneficiaries are SMEs (// close to 15 % in FP 7) 10. 31% of the budget goes to SMEs (// close to 11% in FP 7) 19. 27% of SME applicants are successful (vs. 16. 45% of all applicants)
SMEs in Excellent Science – applicants and budget * SME applicants in the selection Priority Area European Research Council FETs MSCA Research infrastructures Total: Excellent Science Requested EU financial contribution to SME applicants in selection Retained Proposals (in million EUR) Eligible Proposals Retained Proposals Success Rates Eligible Proposals (in million EUR) 2 0 0. 00% 0. 21 91 11 12. 09% 344. 13 1. 91 5. 55% 1308 252 19. 27% 317. 87 48. 16 15. 15% 0 0 1401 263 19% 352. 5 50. 07 14% * As available in CORDA on 25/9/2014 Success Rates 0. 00%
SMEs in LEITs: Clear Chemistry • Most interest (in absolute terms) for: 1. 2. 3. 4. 5. • Information and Communication Technologies (ICT) [4198 SME applicants = 29. 84% of total] Advanced Manufacturing and Processing (AMP) – [1336 SME applicants = 30. 72% of total] Nanotechnologies. Advanced Materials and Production (NMP) [692 SME applicants = 44. 85% of total] Space (SP) [639 SME applicants = 25. 58% of total] Biotechnology (Biotech) [74 SME applicants = 100% of total*] Overall, reassuring figures for all LEITs: • • 30. 65% of all applicants are SMEs 25. 29% of all beneficiaries are SMEs About 1/9 of SME applicants are successful (vs. 13. 38% of all applicants) 234. 2 million EUR of the 1. 092 billion EUR (21. 46%) allocated so far went to SMEs * Only SME instrument (phase 1)
SMEs in LEITs – applicants and budget figures* SME applicants in the selection Requested EU financial contribution to SME applicants in selection Priority Area Eligible Proposals Retained Proposals Success Rates Eligible Proposals (in million EUR) ICT 4198 429 10. 22% 1188. 27 130. 54 10. 99% 19. 48% NMP 692 58 8. 38% 164. 38 22. 11 13. 45% 30. 86% Biotech 74 3 4. 05% 3. 7 0. 15 4. 05% 100% AMP 1336 165 12. 35% 476. 26 58. 19 12. 22% 25. 58% Space 639 111 17. 37% 149. 69 23. 23 15. 52% 19. 47% Advanced Materials 0 0 Total: LEITs 6941 766 11. 04% 1982. 3 234. 23 11. 82% 21. 46% * As available in CORDA on 25/9/2014 Retained Proposals (in million EUR) Success Rates % of budget allocated to SMEs
SMEs in SC: More Highs than Lows • Most interest (in absolute terms) for: 1. 2. 3. 4. 5. 6. 7. Health, Demographic Change and Wellbeing [1163 SME applicants = 22. 1% of total] – SC 1 Secure, Clean and Efficient Energy [959 SME applicants = 30. 92% of total] – SC 3 Climate Action, Environment, Resource Efficiency and Raw Materials [665 SME applicants = 31. 49% of total] – SC 5 Smart, Green and Integrated Transport [342 SME applicants = 48. 24% of total] – SC 4 Inclusive, Innovative and Reflective Societies [226 SME applicants = 16. 78% of total] – SC 6 Food Security, Sustainable Agriculture and Forestry, Marine, Maritime and Inland Water Research [190 SME applicants = 100% of total*] – SC 2 Secure Societies [47 SME applicants = 100% of total*] – SC 7 1. Overall. OK. yet budget going to SMEs should be increased (what will happen in any case with SME instrument phase 2): 1. 2. 3. 4. 28. 04% of all applicants are SMEs 19. 57% of all beneficiaries are SMEs About 1/10 of SME applicants are successful (vs. 14% of all applicants) 71. 4 million EUR of the 595. 7 million EUR (11. 98%) allocated so far went to SMEs * Only SME Instrument (Phase 1)
SMEs in SC - applicants and budget* SME applicants in the selection Requested EU financial contribution to SME applicants in selection Priority Area Eligible Proposals Retained Proposals Success Rates Eligible Proposals (in million EUR) SC 1 1163 116 9. 97% 371. 22 29. 7 8. 00% 12. 17% SC 2 173 10 5. 78% 8. 65 0. 5 5. 78% 100% SC 3 959 63 6. 57% 231. 69 15. 32 6. 61% 8. 33% SC 4 342 40 11. 7% 31. 37 3. 88 12. 36% 16. 61% SC 5 665 85 12. 78% 137. 03 16. 88 12. 32% 14. 87% SC 6 226 24 10. 62% 56. 60 4. 83 8. 54% 16. 03% SC 7 47 6 12. 77% 2. 05 0. 3 14. 63% 100% Total: SC 3575 344 9. 6% 838. 61 71. 42 9% 11. 98% * As available in CORDA on 25/9/2014 Retained Proposals (in million EUR) Success Rates % of budget allocated to SMEs
Horizon 2020 for SMEs = Integrated & Complimentary Support 20 % budgetary target in LEITs (IL) & SC* 'Innovation in SMEs' (IL) 'Access to Risk Finance' (IL) MSCA (ES) Collaborative Projects 13% Enhancing Innovation Capacity Eurostars II Debt & Equity Facilities & accompanying measures Fellowships (Access to Skills) *= ~ EUR 9 billion of direct SME support, over the period 2014 -2020
Implementation • Implemented centrally by one agency (EASME) • Continuously open call with around 4 cut-off dates per year 2014 2015 Phase 1 Phase 2 18/06/2014 09/10/2014 18/03/2015 24/09/2014 17/12/2014 17/06/2015 17/09/2015 16/12/2015 17/12/2014
2% budget 10% budget 88% budget
SME Instrument – Phase 1 - Submission ü 1 st Cut-off date 18 June 2014: 2662 proposals • • • 2503 single company applications. 119 consortia with 2 SMEs. 34 with 3 SMEs. 6 with 4 SMEs Italy was the country with the highest number of proposals submitted (436), closely followed by Spain (420), UK (232) and Germany (188), France (167) and Hungary (166) The Open Disruptive Innovation (ODI) topic attracted by far the highest number of applications with 885. followed by low carbon energy systems (372). nanotechnologies (305) and eco-innovation/raw materials (241) ü 2 nd Cut-off date 24 September 2014: 1944 proposals • • • The ranking by country remains the same as in June. with Italy in the lead in terms of number of applications (351). followed by Spain (283), United Kingdom (149), Germany (128), France (93) and Hungary (91) Open Disruptive Innovation (ODI) attracted again the biggest number of proposals (608), also followed by low carbon energy systems (268), nanotechnologies (234) and eco-innovation/raw materials (199) No further information yet on applicants
only countries with submissions are shown
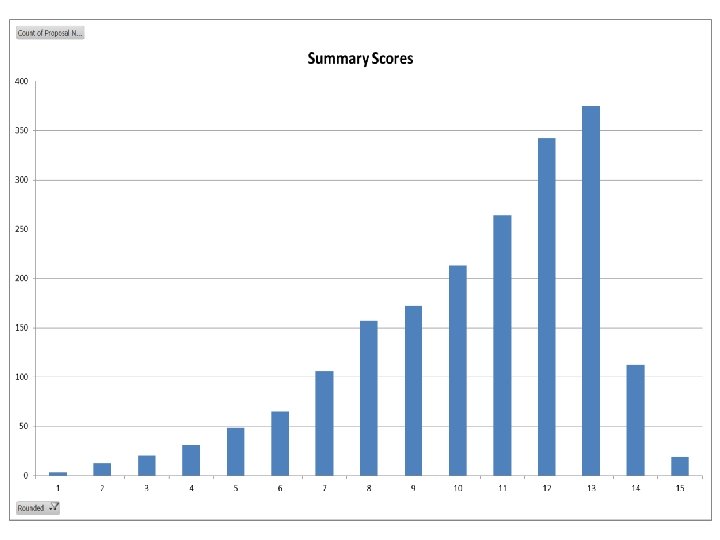
Number of proposals submitted by topic for the 2 cut-off dates:
SME Instrument – Phase 1 – Evaluation / Funding after First Cut-Off Date • • • Out of the 2602 eligible applications received, 317 (12%) were evaluated above threshold. The budget available for this cut-off would allow to fund 169 companies (Phase 1 project). Based on the positively evaluated applications per topic 155 projects could be funded (6%). 49% of applications above threshold will be funded every second "good" proposal is funded. 105 out of 155 (68%) of the SMEs reportedly are newcomers to Framework Programmes. Countries with highest success rate are: Ireland (20%), Austria (15%), UK (11%), Israel (10%) and Spain (9%) Company statistics: • 58% of funded SMEs have between 6 to 50 employees, 30% of SMEs micro-companies with up to 5 employees, and 11% have more than 50 employees. • 25% of funded SMEs are consolidated companies with more than 11 trading years, 39% with 4 to 10 years, and 36% with up to 36%. • 36% of funded SMEs have a turnover higher than € 1 M, 35% between € 100 K-€ 1 M, 28% less than € 100 K.
The 5 highest "country success rates" are: Ireland: Austria: United Kingdom: Israel: Spain: 20% 15% 11% 10% 9%
Analysis of received and selected proposals per topic – 1 st Cut-off Proposals evaluated Max. project fundable Proposals above % positively evaluated "Success rate" %above threshold and funded 886 30 107 12% 28% 310 15+2 29 9% 59% BIOTECH 5: SME boosting biotechnology-based industrial processes driving competitiveness and sustainability 74 3 8 11% 38% LEIT Space-SME High number of ineligible or wrongly submitted proposals: 66 61 4 4 7% 100% 208 44 (20%) 24 12% 100% Topic ICT 37: Open Disruptive Innovation Scheme Fairly high number of proposals above threshold NMP 25: Accelerating the uptake of nanotechnologies, advanced materials or advanced manufacturing and processing technologies by SMEs PHC 12 : Clinical research for the validation of biomarkers and/or diagnostic medical devices Fewer than possible projects positively evaluated
Analysis of received and selected proposals per topic – 1 st Cut-off Proposals evaluated Max. project fundable Proposals above % positively evaluated "Success rate" %above threshold 125 7 29 23% 24% BG 12: Blue Growth 48 3 6 12% 50% SIE 1: Stimulating the innovation potential of SMEs for a low carbon and efficient energy system 374 22+1 46 12% 50% IT. 1: Small business innovation research for Transport 227 24+2 26 12% 100% SC-5 -20: Boosting the potential of small businesses for eco-innovation and a sustainable supply of raw materials 248 11+1 32 13% 38% 41 6 6 15% 100% Topic SFS 8: Resource-efficient eco-innovative food production and processing Many proposals above threshold DRS 17 -Protection of urban soft targets and urban critical infrastructures
First analysis of reasons for unsuccessful phase 1 proposals: • Too much project focussed, not enough business opportunity oriented • Description of company not convincing (why would this company succeed and not the competitor? !) • No information on competing solutions • Innovation content too low; product exists already on the market (just incremental improvement) • Just ideas, no proof of existing commercialisation concept (TRL far too low) • Just trying one's luck
Lessons learned and aspects for improvement: • Submission process not yet optimal (85% of the submitted proposals arrived within the last 48 h prior to the cut-off date). • Presentation of the call at proposal submission level is not yet optimal (70 proposals had to be transferred from one topic to another upon request by the applicants, with the majority of the cases due to misinterpretation of the applicant). • Level of feedback from evaluation to applicants will be improved, yet speed (short time-to-grant) will remain the most important preoccupation. • Pool of evaluators will be broadened from current 521 to about 1000 (more business, financial profiles!)
Your reaction, feedback based on your contacts with stakeholders? Are there any specific issues that need to be better explained/clarified to potential proposers? Questions? Research and Innovation