Smart Waste Management System Based on Io T

Smart Waste Management System Based on Io. T Graduation Project 2

Team Members Under Supervision of Dr. Saed Tarapiah Noura Booz Nisreen Saadeh Mariam Qawariq

Contents : Introduction Problem Statement Problem Solution Io. T VRP Methodology Results and Discussion Conclusion and Future Work

Introduction:

Introduction : This project deals with the problem of Waste management in smart cities, where the garbage collection system is not optimized. In this system , the smart bins are connected to the internet to get the real time information of the smart dustbins.

Problem Statement • Solid waste management is one of the main environmental problems. • The traditional manual way is an inefficient method because it wastes the time and fuel which leads to a waste of money.

Solution Using an Io. T-based waste management system reduces fuel consumption leads to saving money and time.

Smart Waste Management Advantages: Minimal Time Easy Collection Decision Support Clean Environment Reduce Fuel Consumption Save Money Optimize Resources
 The Internet of Things (Io. T) is a concept")
Internet of Things (Io. T) The Internet of Things (Io. T) is a concept in which surrounding objects are connected through wired and wireless networks without user intervention. In the field of Io. T, the objects communicate and exchange information to provide advanced intelligent services for users.
 The vehicle routing problem is known as the problem of finding")
Vehicle Routing Problem(VRP) The vehicle routing problem is known as the problem of finding the optimum way to deliver or collect from one or more warehouses to many cities or customers.

Methodology

Methodology System’s Flowcharts Design System’s Block Diagram

Design Full System Design & Waste Bin Design

Full System Design Sensing Monitoring Control

Waste Bin Design Smart waste bin Led control system Data control system

System’s Block Diagram
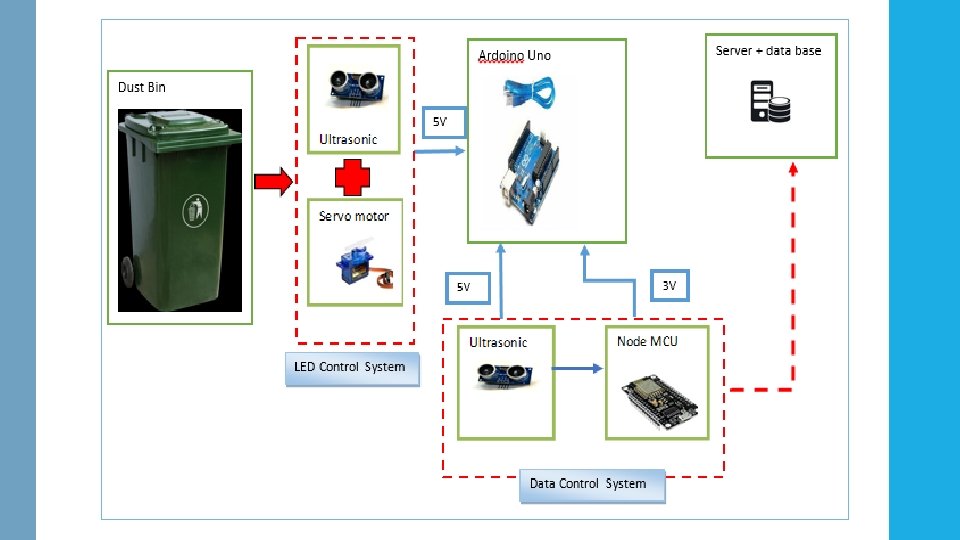

Smart Waste Bin:

System’s Flowcharts Waste Bin Flowchart & Server and Database Flowchart

Waste Bin Flowchart start Set level= 0 Read the bin’s waste level If level<40 % If 40%<lev el<70% If level>70 % Set color of bin green Set color of bin yellow Set color of bin red Current level=level Send current level Data sent to server each 50 seconds

Server and Database Flowchart Website prepares the current location. Start Node id, percentage and location are sent through Node MCU to save_db server. The website connects to fetch_api server and sends the location to it. fetch_api server does the following: The save_db server connects to the database. Save_db server puts the retrieved data to the database. Connects to the same database and fetches all records already saved. Retrieves the location and calculates the distance and time between that location and the location of each node. All data are sent to the website and previewed on the table. Executed each 50 s End

Results and Discussion

Starting from the trash bins, to the end where the results are displayed on the online page that was designed, this page will be displayed and explained in detail. Database Server MYSQL Database PHP Server

When we enter our website the welcoming page will appear at first as follow:

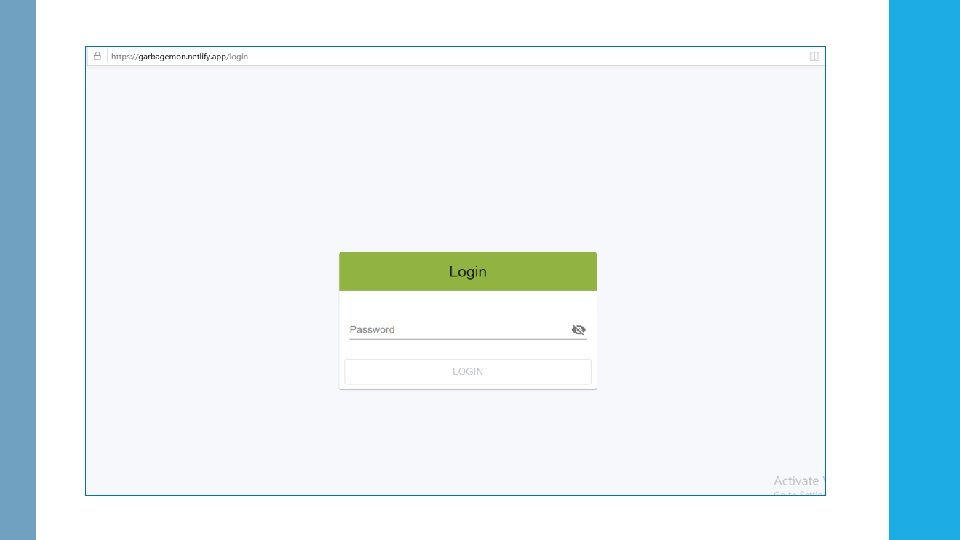
https: //garbagemon. netlify. app/ The login page will appear and ask you to enter a password to let you continue to the home page:

Home Page

It is the distance between the location of the device that we open the website on it and the node that the truck will go to it This column gives the percentage of fill for each waste bin Every waste bin (node) have a detected ID, and this help to differentiate between nodes. Is the time that the driver need to reach the next node starting from his current location. Shows the date of the last modification made at the level of trash bins and the time that the adjustment was made in hours, minutes, and in seconds. When you click on this icon, all baskets appear on the map in color to indicate the fullness of their fullness, as in the next slide By this column the map with the shortest path to detected node will be appear when we press to the map icon. as in the next two slides.

This figure appears where all the trash bins are on the map when clicking on the map mark in the top right of home page , where the red color indicates that the trash bin is full and yellow indicates that it is half full and green it is almost empty or completely empty.

When you click on the map icon for some of trash bin, this result will be as the following :

The shortest route and the distance between the trash bin No. 1 and the driver on the map.

The shortest route and the distance between the trash bin No. 5 and the driver on the map.

Conclusion and Future Work:

Conclusion • The Io. T based waste monitoring is very useful for cities. • By implementing this project we will avoid over flowing of garbage and reducing the traffic.

Future Work: The system will be improved to give greater efficiency by introducing solar cells on it. Design an application on the mobile device to facilitate the process, and sending data to a truck. Using some data in the analysis. In the near future, an additional algorithm based on machine learning will be developed, so it can expect the garbage bins which filled faster than others and draw a daily path for the driver that connects all the filled bins to empty them easily, and in a shorter time.

The End
- Slides: 36