
Smart Leveraging the Internet of Things to assess

- Slides: 21
//Smart: Leveraging the Internet of Things to assess the effectiveness of Natural Flood Management Arnout van Soesbergen, Mark Mulligan, Sophia Burke and Caitlin Douglas www. policysupport. org/smart arnout. van_soesbergen@kcl. ac. uk This project has received funding from the European Union’s Horizon 2020 research and innovation programme under grant agreement No 730497.
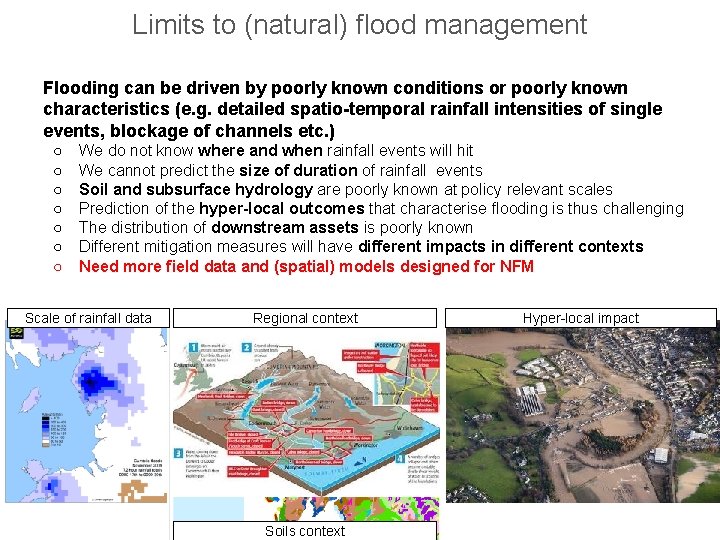
Limits to (natural) flood management Flooding can be driven by poorly known conditions or poorly known characteristics (e. g. detailed spatio-temporal rainfall intensities of single events, blockage of channels etc. ) ○ ○ ○ ○ We do not know where and when rainfall events will hit We cannot predict the size of duration of rainfall events Soil and subsurface hydrology are poorly known at policy relevant scales Prediction of the hyper-local outcomes that characterise flooding is thus challenging The distribution of downstream assets is poorly known Different mitigation measures will have different impacts in different contexts Need more field data and (spatial) models designed for NFM Scale of rainfall data Regional context Soils context Hyper-local impact
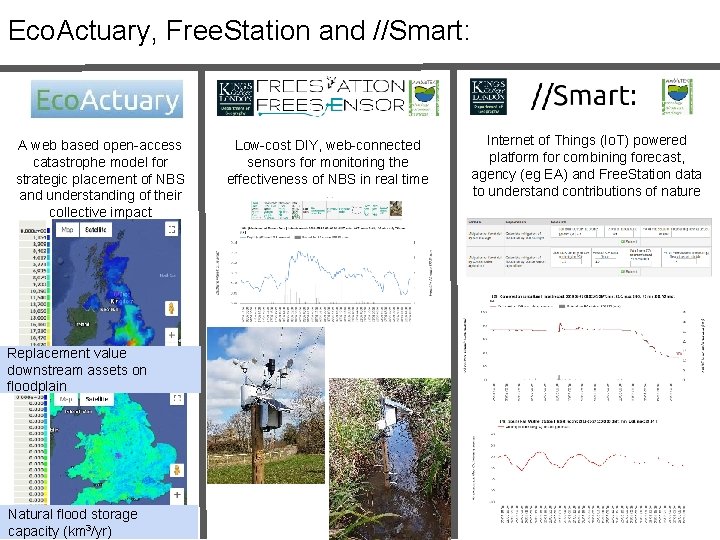
Eco. Actuary, Free. Station and //Smart: A web based open-access catastrophe model for strategic placement of NBS and understanding of their collective impact Replacement value downstream assets on floodplain Natural flood storage capacity (km 3/yr) Low-cost DIY, web-connected sensors for monitoring the effectiveness of NBS in real time Internet of Things (Io. T) powered platform for combining forecast, agency (eg EA) and Free. Station data to understand contributions of nature
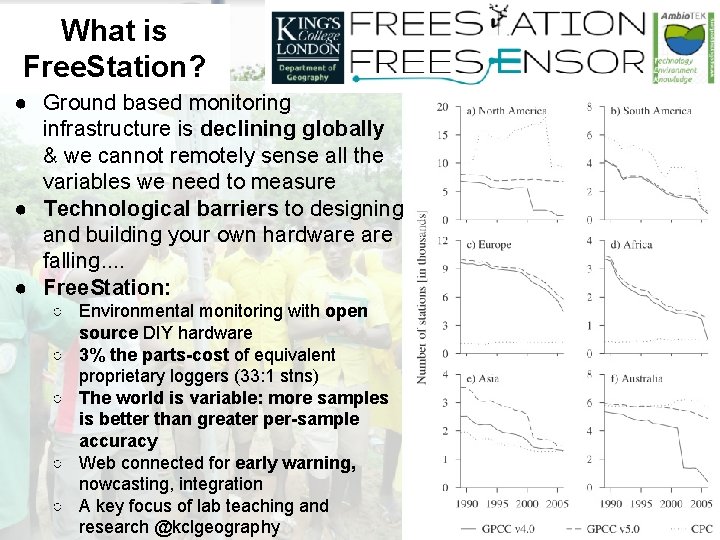
What is Free. Station? ● Ground based monitoring infrastructure is declining globally & we cannot remotely sense all the variables we need to measure ● Technological barriers to designing and building your own hardware falling. . ● Free. Station: ○ Environmental monitoring with open source DIY hardware ○ 3% the parts-cost of equivalent proprietary loggers (33: 1 stns) ○ The world is variable: more samples is better than greater per-sample accuracy ○ Web connected for early warning, nowcasting, integration ○ A key focus of lab teaching and research @kclgeography
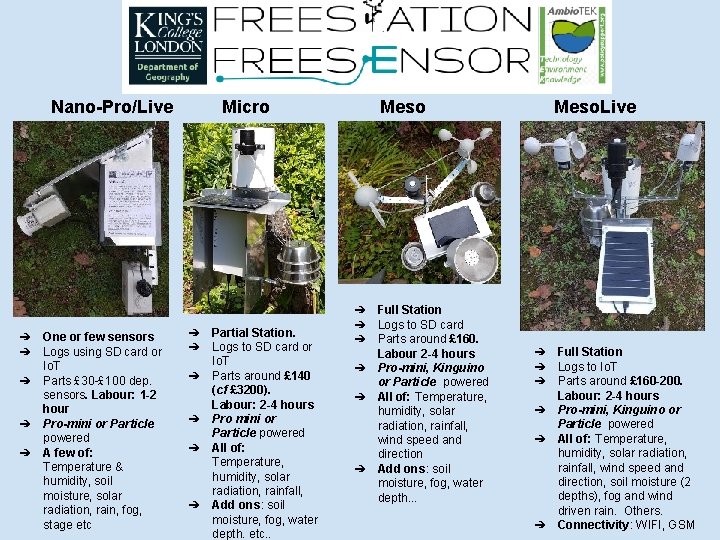
Nano-Pro/Live ➔ ➔ ➔ One or few sensors Logs using SD card or Io. T Parts £ 30 -£ 100 dep. sensors. Labour: 1 -2 hour Pro-mini or Particle powered A few of: Temperature & humidity, soil moisture, solar radiation, rain, fog, stage etc Micro ➔ ➔ ➔ Partial Station. Logs to SD card or Io. T Parts around £ 140 (cf £ 3200). Labour: 2 -4 hours Pro mini or Particle powered All of: Temperature, humidity, solar radiation, rainfall, Add ons: soil moisture, fog, water depth. etc. . Meso ➔ ➔ ➔ Full Station Logs to SD card Parts around £ 160. Labour 2 -4 hours Pro-mini, Kinguino or Particle powered All of: Temperature, humidity, solar radiation, rainfall, wind speed and direction Add ons: soil moisture, fog, water depth. . . Meso. Live ➔ ➔ ➔ Full Station Logs to Io. T Parts around £ 160 -200. Labour: 2 -4 hours Pro-mini, Kinguino or Particle powered All of: Temperature, humidity, solar radiation, rainfall, wind speed and direction, soil moisture (2 depths), fog and wind driven rain. Others. Connectivity: WIFI, GSM
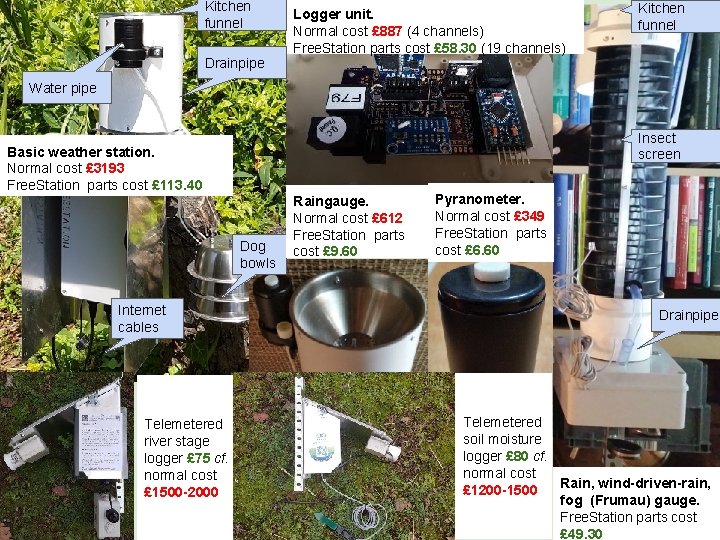
Kitchen funnel Drainpipe Logger unit. Normal cost £ 887 (4 channels) Free. Station parts cost £ 58. 30 (19 channels) Kitchen funnel Water pipe Insect screen Basic weather station. Normal cost £ 3193 Free. Station parts cost £ 113. 40 Dog bowls Internet cables Telemetered river stage logger £ 75 cf. normal cost £ 1500 -2000 Raingauge. Normal cost £ 612 Free. Station parts cost £ 9. 60 Pyranometer. Normal cost £ 349 Free. Station parts cost £ 6. 60 Drainpipe Telemetered soil moisture logger £ 80 cf. normal cost Rain, wind-driven-rain, £ 1200 -1500 fog (Frumau) gauge. Free. Station parts cost £ 49. 30
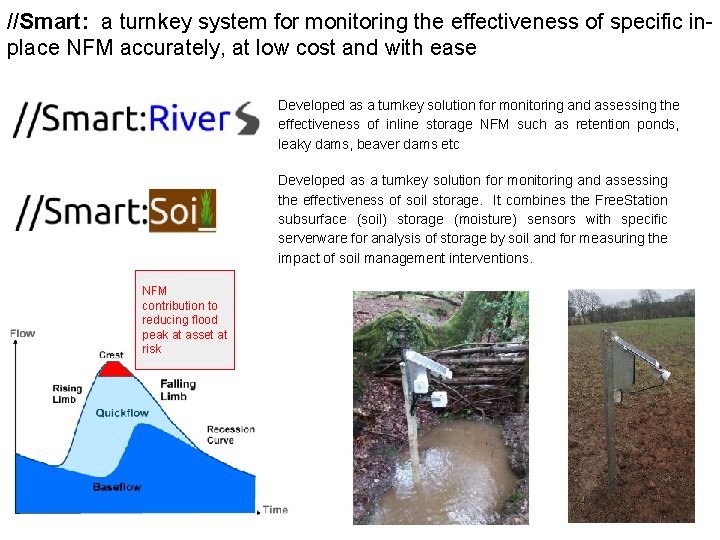
//Smart: a turnkey system for monitoring the effectiveness of specific inplace NFM accurately, at low cost and with ease Developed as a turnkey solution for monitoring and assessing the effectiveness of inline storage NFM such as retention ponds, leaky dams, beaver dams etc Developed as a turnkey solution for monitoring and assessing the effectiveness of soil storage. It combines the Free. Station subsurface (soil) storage (moisture) sensors with specific serverware for analysis of storage by soil and for measuring the impact of soil management interventions. NFM contribution to reducing flood peak at asset at risk
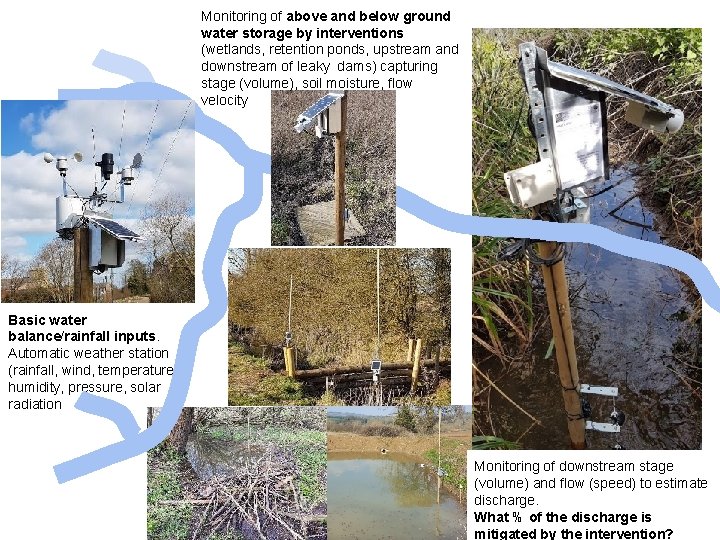
Monitoring of above and below ground water storage by interventions (wetlands, retention ponds, upstream and downstream of leaky dams) capturing stage (volume), soil moisture, flow velocity Basic water balance/rainfall inputs. Automatic weather station (rainfall, wind, temperature, humidity, pressure, solar radiation Monitoring of downstream stage (volume) and flow (speed) to estimate discharge. What % of the discharge is mitigated by the intervention?
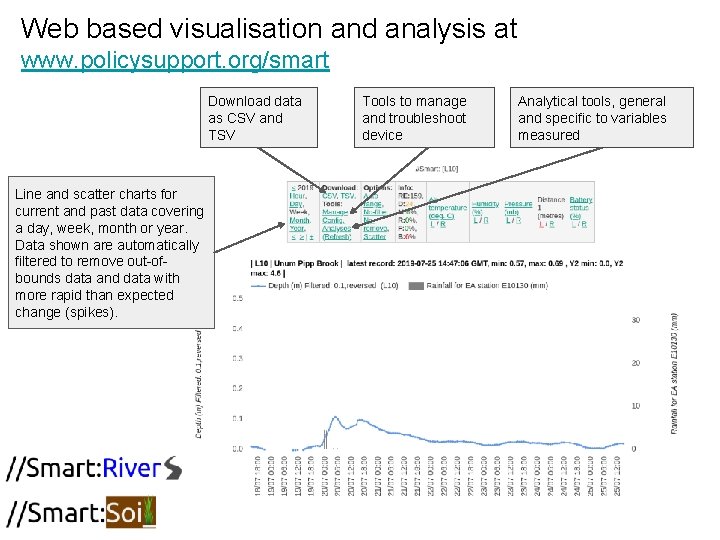
Web based visualisation and analysis at www. policysupport. org/smart Download data as CSV and TSV Line and scatter charts for current and past data covering a day, week, month or year. Data shown are automatically filtered to remove out-ofbounds data and data with more rapid than expected change (spikes). Tools to manage and troubleshoot device Analytical tools, general and specific to variables measured
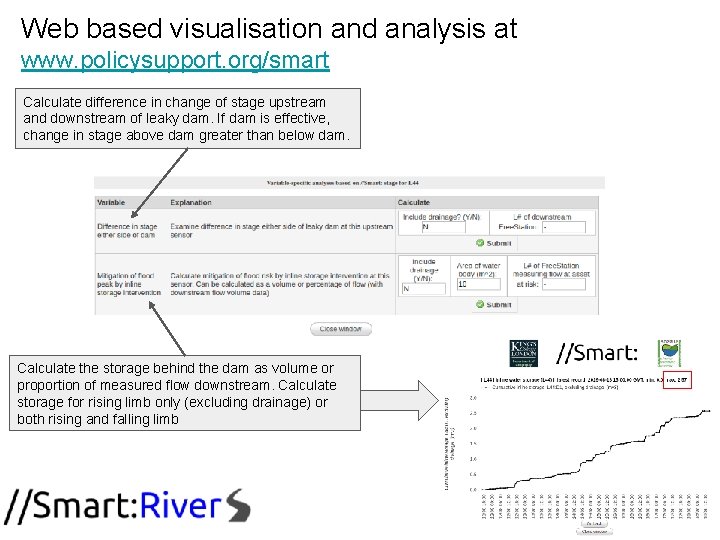
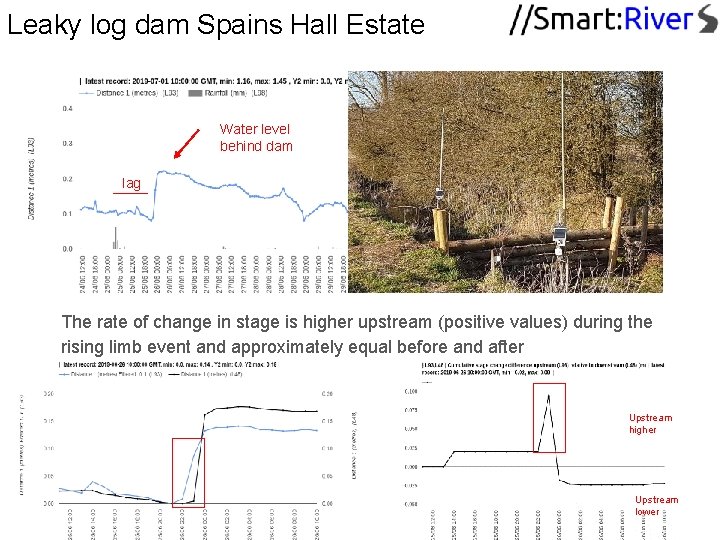
Web based visualisation and analysis at www. policysupport. org/smart Calculate difference in change of stage upstream and downstream of leaky dam. If dam is effective, change in stage above dam greater than below dam. Calculate the storage behind the dam as volume or proportion of measured flow downstream. Calculate storage for rising limb only (excluding drainage) or both rising and falling limb
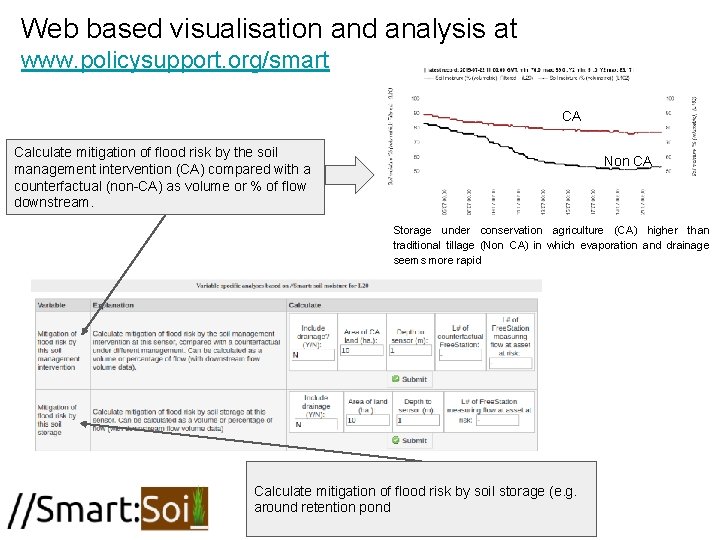
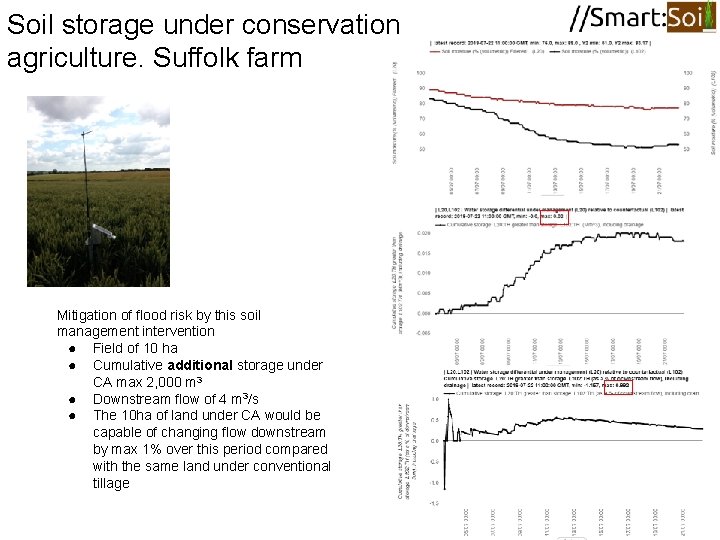
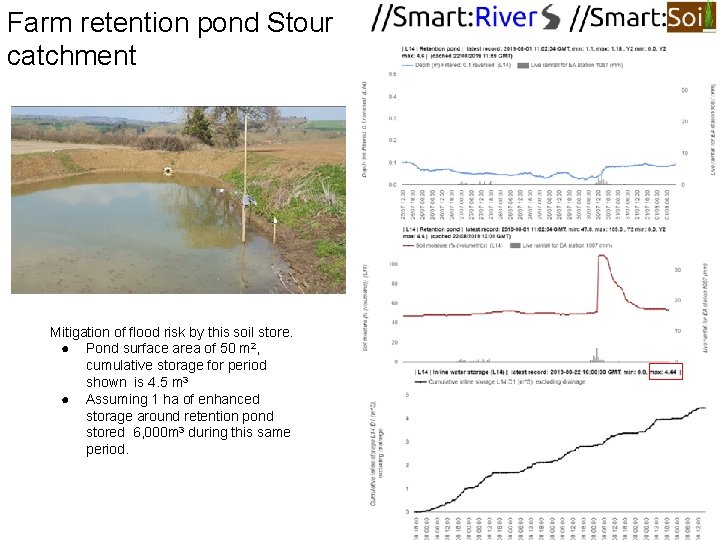
Web based visualisation and analysis at www. policysupport. org/smart CA Calculate mitigation of flood risk by the soil management intervention (CA) compared with a counterfactual (non-CA) as volume or % of flow downstream. Non CA Storage under conservation agriculture (CA) higher than traditional tillage (Non CA) in which evaporation and drainage seems more rapid Calculate mitigation of flood risk by soil storage (e. g. around retention pond
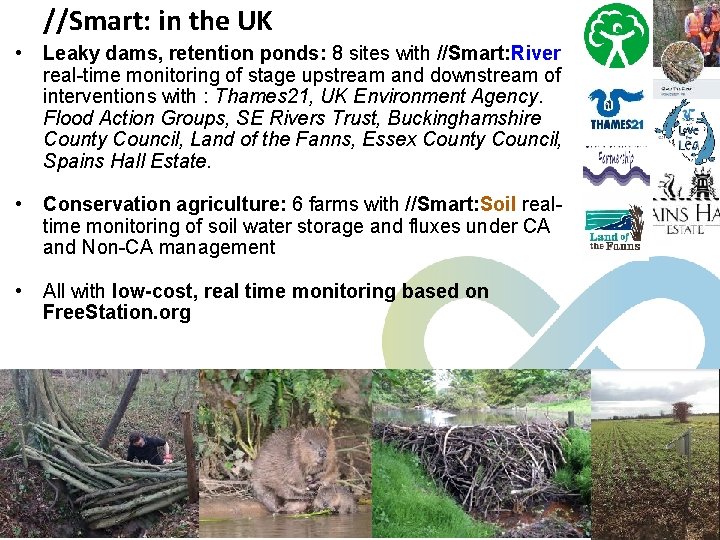
//Smart: in the UK • Leaky dams, retention ponds: 8 sites with //Smart: River real-time monitoring of stage upstream and downstream of interventions with : Thames 21, UK Environment Agency. Flood Action Groups, SE Rivers Trust, Buckinghamshire County Council, Land of the Fanns, Essex County Council, Spains Hall Estate. • Conservation agriculture: 6 farms with //Smart: Soil realtime monitoring of soil water storage and fluxes under CA and Non-CA management • All with low-cost, real time monitoring based on Free. Station. org
Leaky log dam Spains Hall Estate Water level behind dam lag The rate of change in stage is higher upstream (positive values) during the rising limb event and approximately equal before and after Little surface storage of event (but small event) Upstream higher Upstream lower
Soil storage under conservation agriculture. Suffolk farm Mitigation of flood risk by this soil management intervention ● Field of 10 ha ● Cumulative additional storage under CA max 2, 000 m 3 ● Downstream flow of 4 m 3/s ● The 10 ha of land under CA would be capable of changing flow downstream by max 1% over this period compared with the same land under conventional tillage
Farm retention pond Stour catchment Mitigation of flood risk by this soil store. ● Pond surface area of 50 m 2, cumulative storage for period shown is 4. 5 m 3 ● Assuming 1 ha of enhanced storage around retention pond stored 6, 000 m 3 during this same period.
Conclusions ● ● ● ● Budgets for developing NFM strategies and monitoring NFM are small to non-existent so alternatives to the traditional engineering model approaches to strategy and effectiveness assessment are necessary We have to develop and implement low-cost indicators to understand ○ Where to put NFM and how large they need to be to produce the desired benefits ○ How they work in practice and under what conditions they produce the required benefits as well as any disbenefits accruing //Smart: tools represent a turnkey solution for understanding the environment by combining open source designs for accurate, low-cost, web connected logging sensors with online tools for analysis Few technical skills are necessary to build deploy and operate significant monitoring infrastructures Different types of natural flood management require different kinds of analyses to understand their impact Impact should be measured in relation to downstream flow Large area interventions such as soil storage tend to have much higher impact (and lower cost per m 3) than smaller interventions such as leaky dams Free to use at www. freestation. org and www. policysupport. org/smart
Using Free. Station //Smart: ● Build - www. freestation. org/building ● Deploy - www. freestation. org/installing ● Switch on. Data starts coming in. ● Go to www. policysupport. org/smart ● Analyse Still spaces for free workshop: Wednesday 11 September, KCL, London, more info here
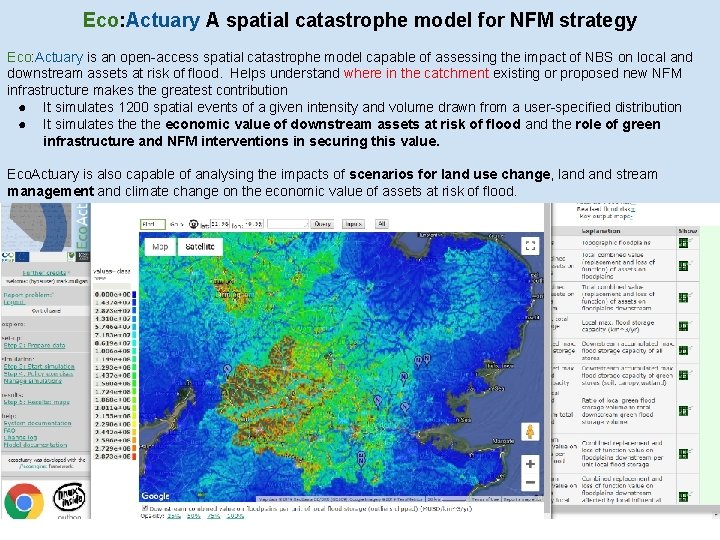
Eco: Actuary A spatial catastrophe model for NFM strategy Eco: Actuary is an open-access spatial catastrophe model capable of assessing the impact of NBS on local and downstream assets at risk of flood. Helps understand where in the catchment existing or proposed new NFM infrastructure makes the greatest contribution ● It simulates 1200 spatial events of a given intensity and volume drawn from a user-specified distribution ● It simulates the economic value of downstream assets at risk of flood and the role of green infrastructure and NFM interventions in securing this value. Eco. Actuary is also capable of analysing the impacts of scenarios for land use change, land stream management and climate change on the economic value of assets at risk of flood.
Eco: Actuary (E$A) on a slide (in prep. ) ● Multi-hazard risk and risk mitigation by nature-based solutions and through asset adaptation. Co-benefits of risk mitigating natural capital. Biophysical and economic valuation interfaces. ● Detailed stochastic, phenomenological and process model, coupling elements of Water. World and Co$ting. Nature PSS+new ● Valuation interface for connection to others' valuation data ● Spatial, local to global (1 ha, 1 km or 10 km spatial resolution) ● All required data supplied globally, from EO and OSM ● Fast (full analysis in 20 -60 minutes) ● Simple to use (web-based, firefox or chrome, no GIS reqd) ● Live connection to Io. T Smart. River sensors ● Uncertainty and validation tools ● Sophisticated land use and management scenarios ● Interventions for DRR through mitigation and adaptation
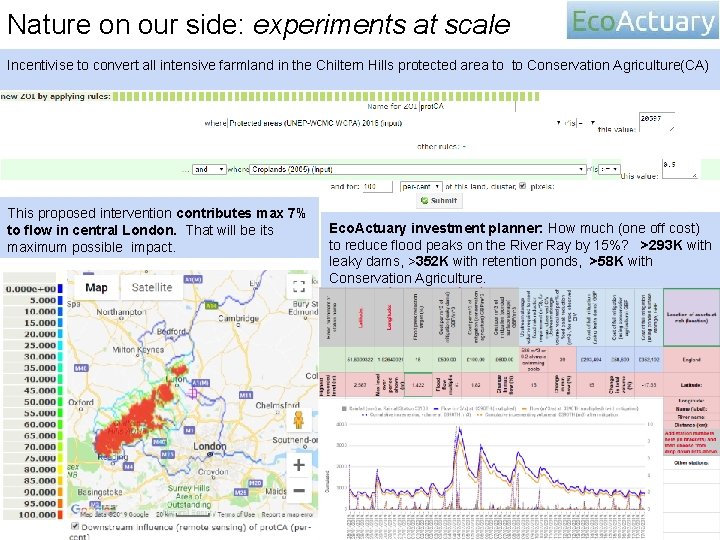
Nature on our side: experiments at scale Incentivise to convert all intensive farmland in the Chiltern Hills protected area to to Conservation Agriculture(CA) This proposed intervention contributes max 7% to flow in central London. That will be its maximum possible impact. Eco. Actuary investment planner: How much (one off cost) to reduce flood peaks on the River Ray by 15%? >293 K with leaky dams, >352 K with retention ponds, >58 K with Conservation Agriculture.