Smallarea estimation in Official Statistics ICT survey in


")
 Survey in Enterprises was")


- Slides: 17
Small-area estimation in Official Statistics: ICT survey in Enterprises of the Basque Country Jorge Aramendi, Jose Miguel Escalada, Elena Goni & Anjeles Iztueta EUSTAT. Basque Statistics Office European Establishment Statistics Workshop Nuremberg – Germany 9 September 2013
Index • • • Review and Historical Context ICT Survey Design Main Objective Methodology Variables Auxiliary information Estimators Accuracy Conclusion and Results
Review and Historical Context From 2003 onwards, partnership with the UPNA (Navarra Public University) to study small area techniques in EUSTAT surveys In 2004, work began on studying the first survey • • • Industrial Survey (2005) Labour Force Survey (2008) Information Society Survey in Families (2009) Technological Innovation Survey (2010) Information and Communications Technologies (ICT) Survey in Enterprises (2012)
ICT Survey design The ICT (Information and Communications Technologies ) Survey in Enterprises was implemented in 2001 to find out the level of use of new technologies in the Basque economy The ICT Survey is a panel of around 7500 establishments with an annual renewal between 15% and 20% of the elements. Stratified design with optimal allocation according to three variables: province, activity and employment stratum. • 3 provinces: Araba, Bizkaia and Gipuzkoa • 65 branches of activity, based on NACE • 6 employment strata: 0 -5, 6 -9, 10 -19, 20 -49, 50 -99, >=100
Main Objective Currently estimates calculated using the direct Horvitz. Thompson estimator for 3 provinces, 65 activity sectors Bilbao and 3 employment stratum. San Sebastián OBJECTIVE : Obtaining district estimations (20 districts and 3 capital cities) for the main ICT variables. PROBLEM: Insufficient sample size for direct estimates So we decided to improve the estimation methodology of this survey and to introduce small area estimation techniques. Vitoria - Gasteiz
Methodology • Variables : Selection and analysis of the target variables • Definition of the small area: 20 districs and 3 capital cities • Auxiliary information: Availability of sources, quality of the data, . . • Estimators: Select best estimators for the data and asses them
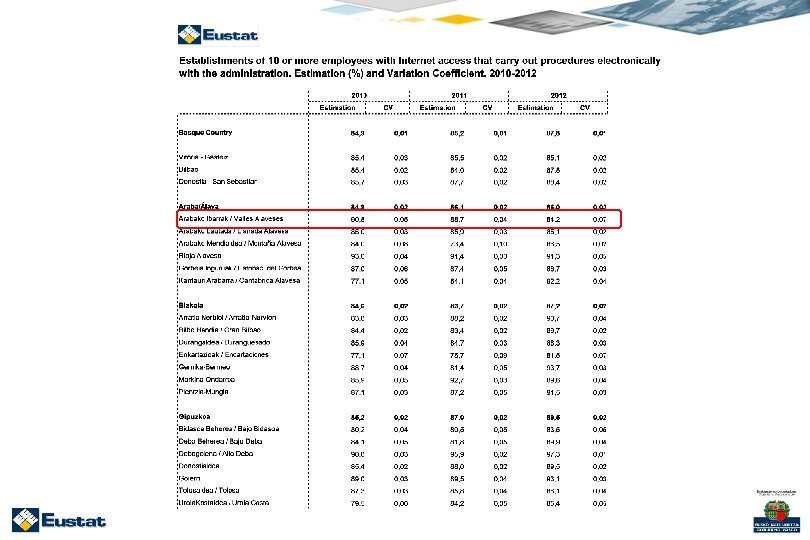
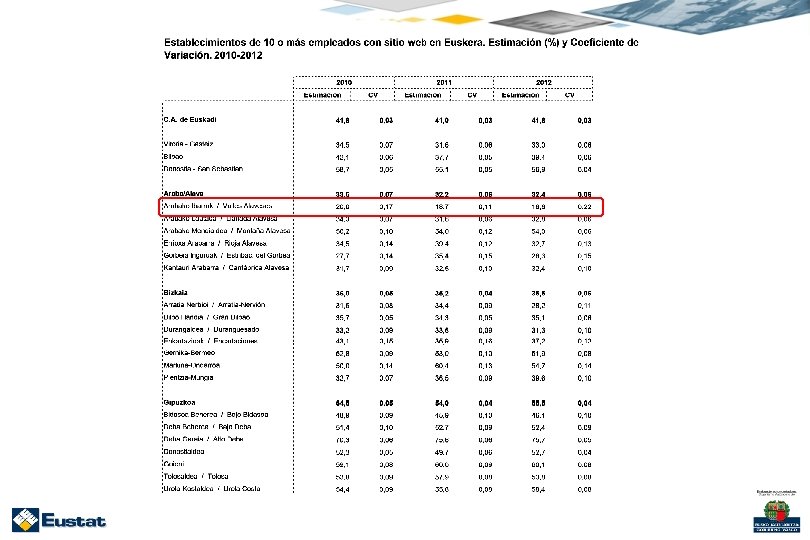
Methodology: Variables Selection and analysis of the target variables: • • • Internet and computer (%) e-commerce (sales or purchases) (%) web (%) freeware operating-systems (%) electronic data exchange (%) web proceedings with the public administration (%).
Methodology: Auxiliary Information Analysis of the auxiliary information: üDIRAE – Our Directory for economic establishments ü 184. 000 establishments üUpdated with different surveys and administrative sources üEmployment and Activity are key variables regularly updated
Methodology: Model selection Assess several estimators Design based estimators: Direct Postestratified Synthethic Composite estimators Model based estimators: Logistic regression model, linear mixed model and no-linear mixed model Analyze the consistency and stability of the aggregated estimates at province level
Methodology: Final Model First level model: where • p 1 is the proportion of establishments that responds affirmatively in a certain variable. • β 0 is the intercept. • β 1, …, β 19 are the coefficients of explanatory variables for the 20 districts. • β 20, β 21 are the coefficients of explanatory variables for the 3 employment strata. • β 22, …, β 47 are the coefficients of explanatory variables for the 27 categories in the activity classification.
Methodology: Model Second level model: where • p 2 is the proportion of establishments that responds affirmatively in a certain variable. • β 0 is the intercept. • β 1, β 2 are the coefficients of explanatory variables for the 3 provinces. • β 3, β 4 are the coefficients of explanatory variables for the 3 employment strata. • β 5, …, β 30 are the coefficients of explanatory variables for the 27 categories in the activity classification.
Methodology: Accuracy Mean Squared Error is calculated using the bootstrap resampling method. where: is the total population of a certain variable in region d. R number of repetitions used in the bootstrap method (R = 200) i is the repeated number (i = 1, 2, …, R) d is the region the estimator in the i-th bootstrap sample of said total in region d
Conclusion and Results ü Estimates are consistent and stable. ü The results offer acceptable levels of quality in terms of accuracy. The estimated coefficients of variation (CV) are not excessively high, the majority of the CV-s obtained in the estimations do not exceed 15%. , given the relatively small samples and population in some districts. ü As a result of the study we have a computer programme based on SAS that is used to analyse this methodology and to apply the mentioned estimators and the calculation of the mean squared errors. ü We have disseminated distric-level information for 3 years 2010, 2011 and 2012
Eskerrik asko Thank you Danke Schön Jorge Aramendi j-aramendi@eustat. es www. eustat. es