
Small Sensors at Low Temperature Revealing Cryogenic Turbulence
Small Sensors at Low Temperature Revealing Cryogenic Turbulence University of Florida Physics Andrew Rinzler Gary IhasØJennifer Sippel-Oakley ØYihui Zhou ØRidvan Adjimambetov ØShu-chen Liu ØIsaac Luria ØMario Padron Mark Sheplak-University of Florida Engineering T. Chen Vadim Mitin-V. Lashkarev Institute of Semiconductor Physics, NASU, Kiev, Ukraine Funding: Research Corporation Miramare June 10, 2005

Thank you Mr. Organizer In his lab circa 2004 (with research trainee)
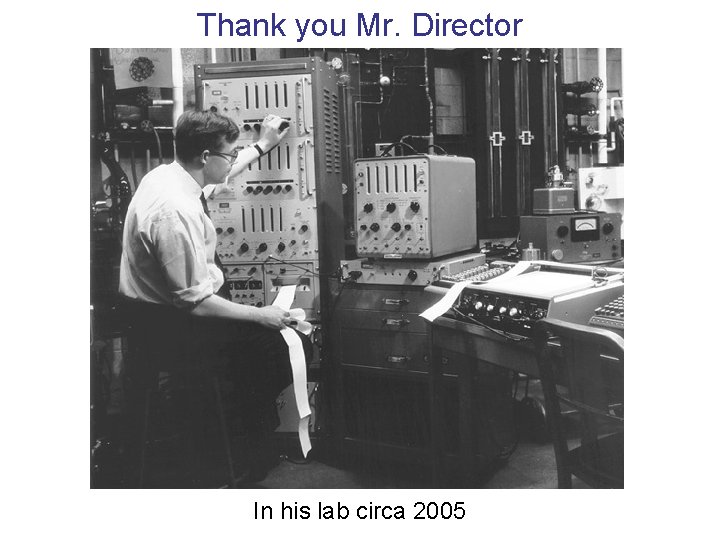
Thank you Mr. Director In his lab circa 2005
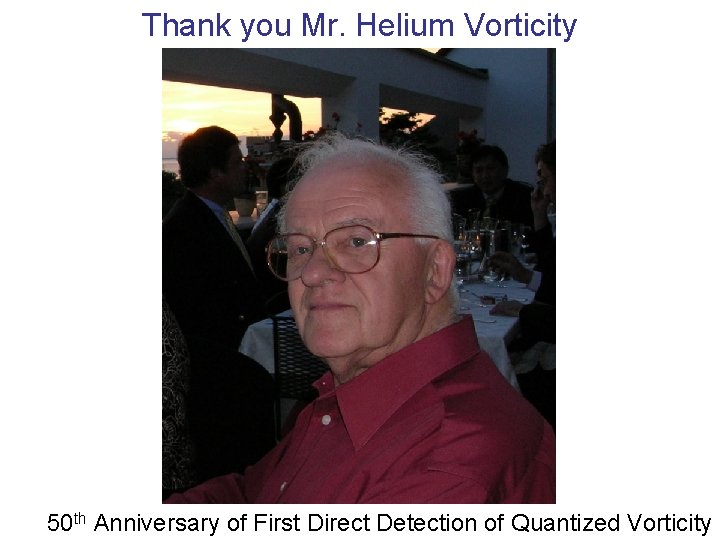
Thank you Mr. Helium Vorticity 50 th Anniversary of First Direct Detection of Quantized Vorticity
Outline § Low Temperature Motivation-Small apparatus size & Quantum turbulence decay studies Measurement Techniques § § Thermal-Electrical Resistance § § § Mechanical § § § Semiconductor technology Results Piezo-resistive Piezo-electric Capacitive Optical Results Nanotube films § § § Thermal Mechanical Results
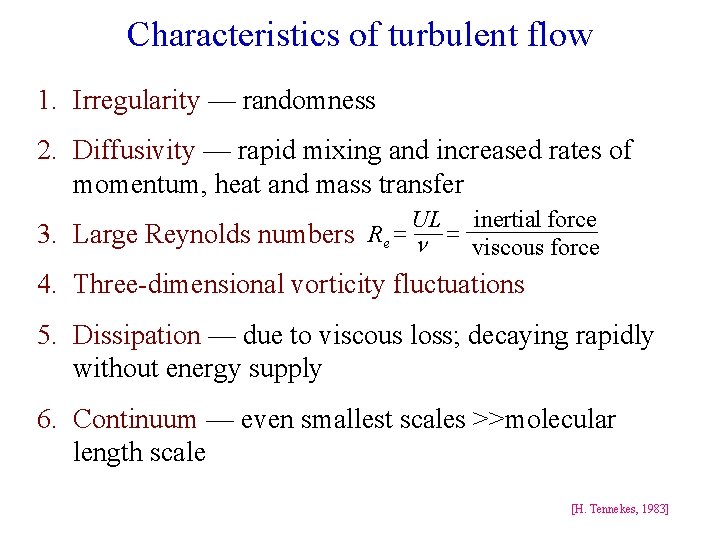
Characteristics of turbulent flow 1. Irregularity — randomness 2. Diffusivity — rapid mixing and increased rates of momentum, heat and mass transfer UL inertial force 3. Large Reynolds numbers R e = n = viscous force 4. Three-dimensional vorticity fluctuations 5. Dissipation — due to viscous loss; decaying rapidly without energy supply 6. Continuum — even smallest scales >>molecular length scale [H. Tennekes, 1983]
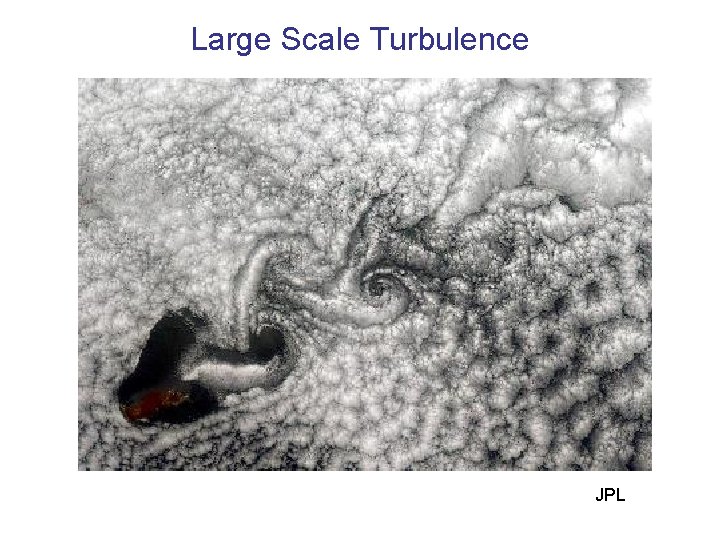
Large Scale Turbulence JPL
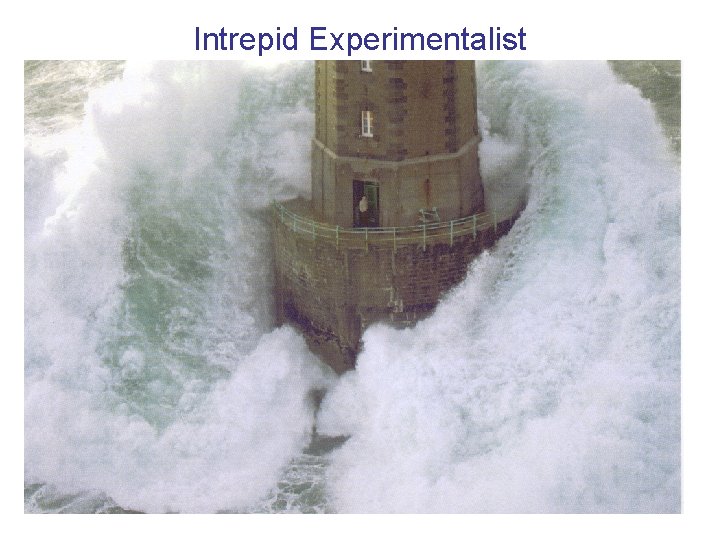
Intrepid Experimentalist
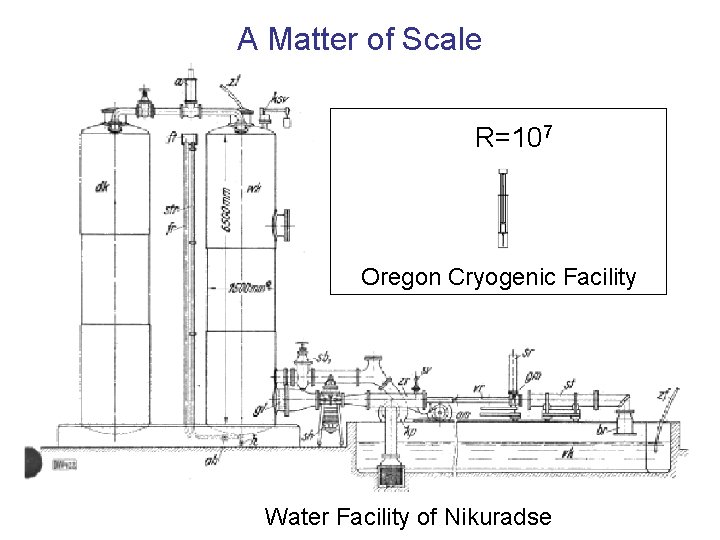
A Matter of Scale R=107 Oregon Cryogenic Facility Water Facility of Nikuradse
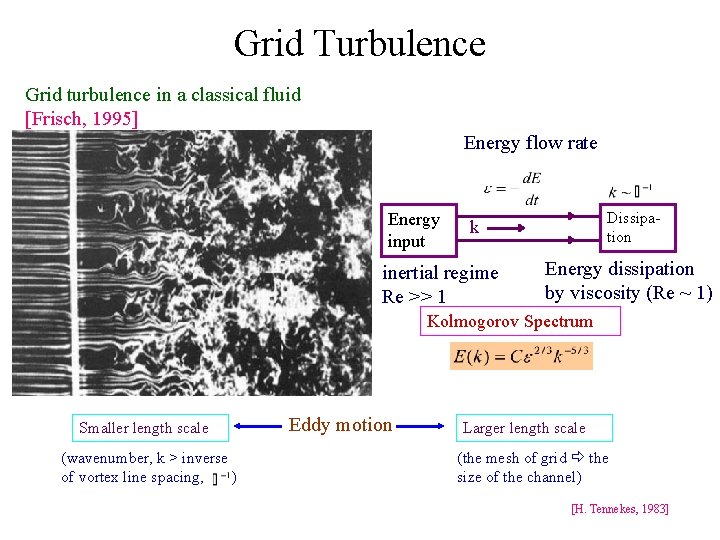
Grid Turbulence Grid turbulence in a classical fluid [Frisch, 1995] Energy flow rate Energy input Dissipation k inertial regime Re >> 1 Energy dissipation by viscosity (Re ~ 1) Kolmogorov Spectrum Smaller length scale (wavenumber, k > inverse of vortex line spacing, ) Eddy motion Larger length scale (the mesh of grid the size of the channel) [H. Tennekes, 1983]
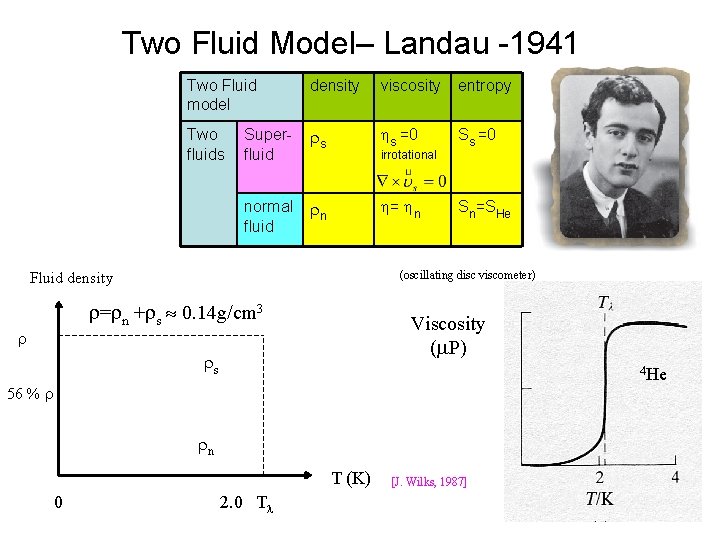
Two Fluid Model– Landau -1941 Two Fluid model density viscosity entropy Two fluids Superfluid s s =0 Ss =0 normal fluid n = n Sn=SHe irrotational (oscillating disc viscometer) Fluid density = n + s 0. 14 g/cm 3 Viscosity ( P) s 4 He 56 % n T (K) 0 2. 0 T [J. Wilks, 1987]
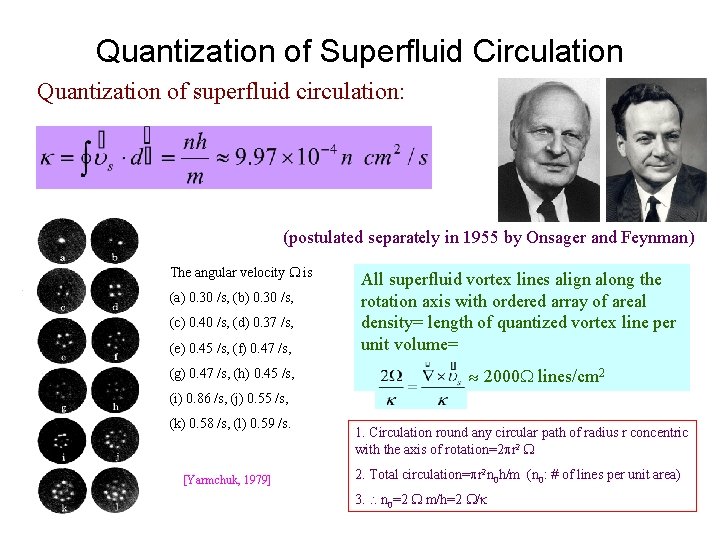
Quantization of Superfluid Circulation Quantization of superfluid circulation: (postulated separately in 1955 by Onsager and Feynman) The angular velocity is (e) 0. 45 /s, (f) 0. 47 /s, All superfluid vortex lines align along the rotation axis with ordered array of areal density= length of quantized vortex line per unit volume= (g) 0. 47 /s, (h) 0. 45 /s, 2000 lines/cm 2 (a) 0. 30 /s, (b) 0. 30 /s, (c) 0. 40 /s, (d) 0. 37 /s, (i) 0. 86 /s, (j) 0. 55 /s, (k) 0. 58 /s, (l) 0. 59 /s. [Yarmchuk, 1979] 1. Circulation round any circular path of radius r concentric with the axis of rotation=2 r 2 2. Total circulation= r 2 n 0 h/m (n 0: # of lines per unit area) 3. n 0=2 m/h=2 /
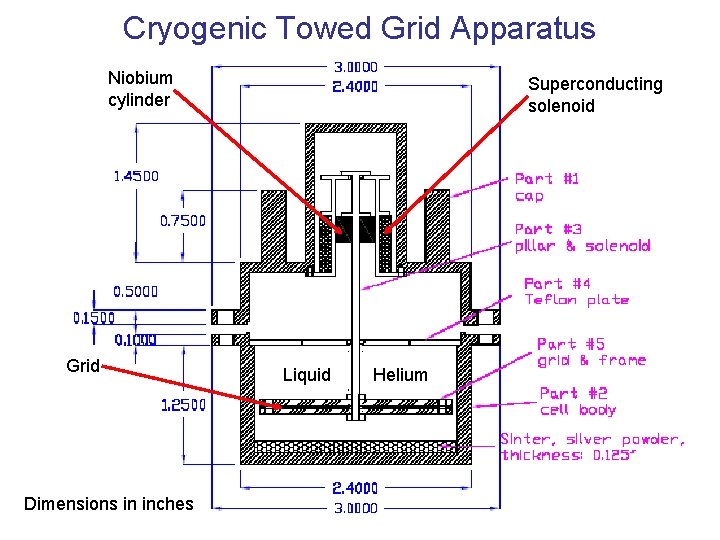
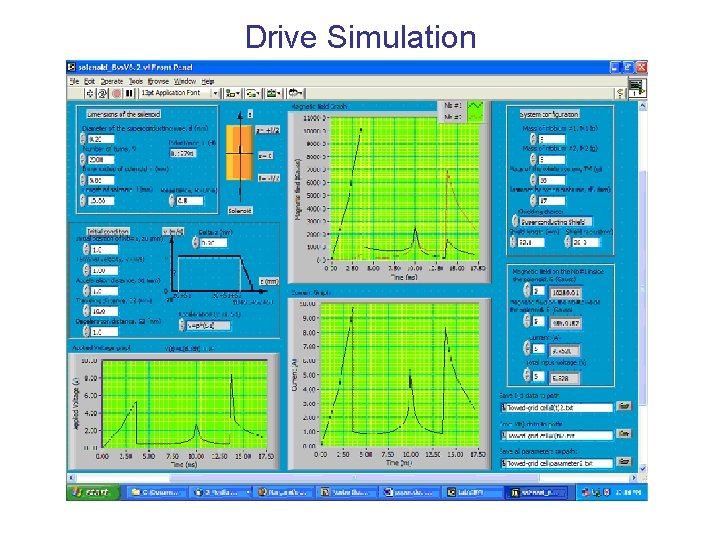
Cryogenic Towed Grid Apparatus Niobium cylinder Grid Dimensions in inches Superconducting solenoid Liquid Helium
Drive Simulation
Techniques To Study Quantum Turbulence § Observation of rise in temperature of helium as turbulence decays § Localized correlated pressure measurements to detect vortex motion and density § Flow
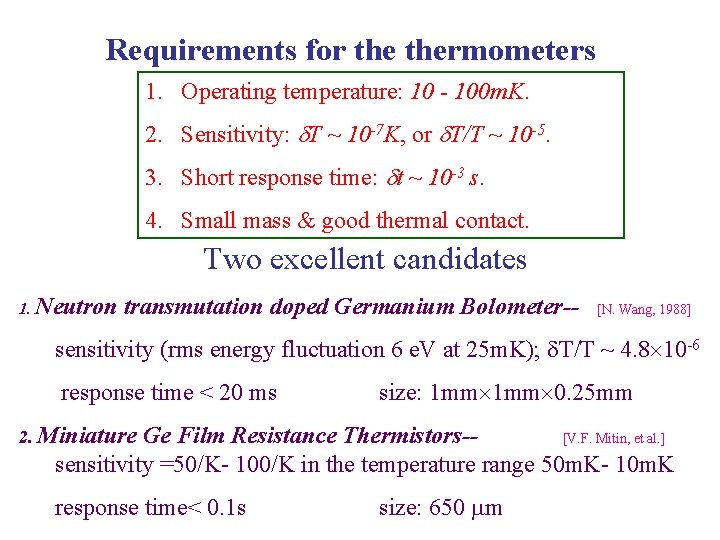
Requirements for thermometers 1. Operating temperature: 10 - 100 m. K. 2. Sensitivity: T ~ 10 -7 K, or T/T ~ 10 -5. 3. Short response time: t ~ 10 -3 s. 4. Small mass & good thermal contact. Two excellent candidates 1. Neutron transmutation doped Germanium Bolometer-- [N. Wang, 1988] sensitivity (rms energy fluctuation 6 e. V at 25 m. K); T/T ~ 4. 8 10 -6 response time < 20 ms size: 1 mm 0. 25 mm 2. Miniature Ge Film Resistance Thermistors-[V. F. Mitin, et al. ] sensitivity =50/K- 100/K in the temperature range 50 m. K- 10 m. K response time< 0. 1 s size: 650 m
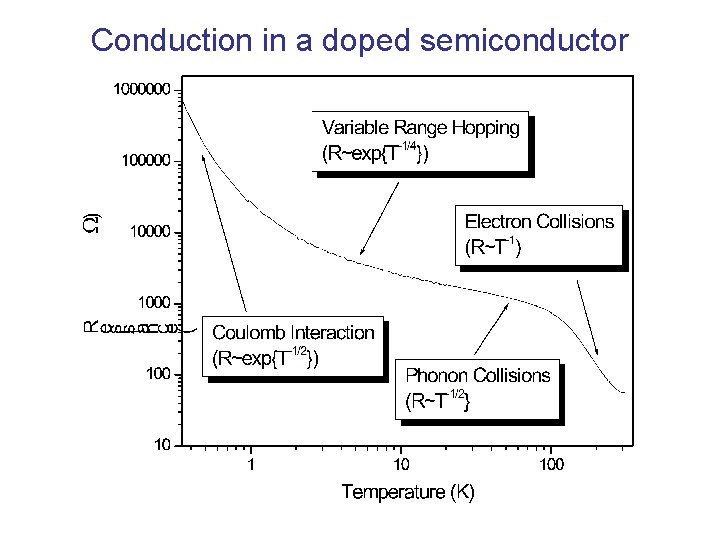
Conduction in a doped semiconductor
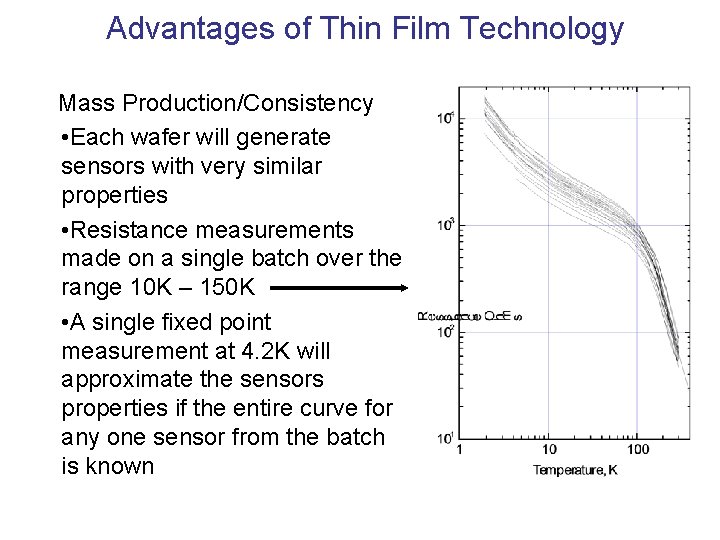
Advantages of Thin Film Technology Mass Production/Consistency • Each wafer will generate sensors with very similar properties • Resistance measurements made on a single batch over the range 10 K – 150 K • A single fixed point measurement at 4. 2 K will approximate the sensors properties if the entire curve for any one sensor from the batch is known
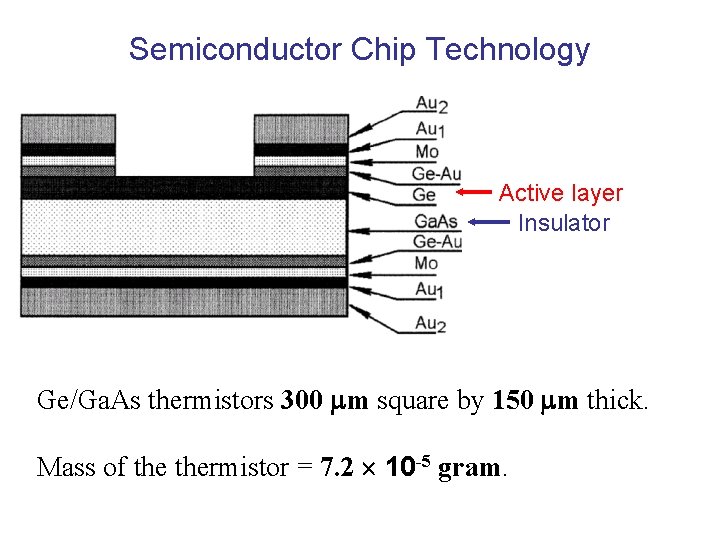
Semiconductor Chip Technology Active layer Insulator Ge/Ga. As thermistors 300 m square by 150 m thick. Mass of thermistor = 7. 2 10 -5 gram.
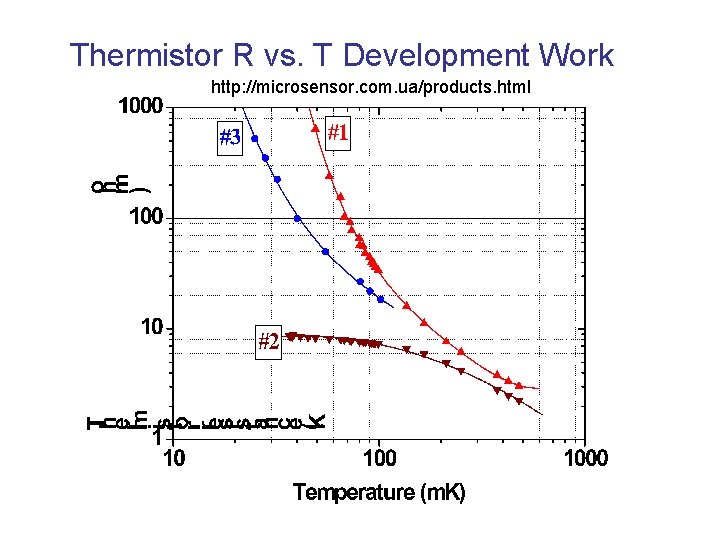
Thermistor R vs. T Development Work http: //microsensor. com. ua/products. html
Pressure Transducer Requirements §sampling on micron scale § sensitivity: 0. 1 Pascal § fast: 1 msec §function at low temperatures (20 – 100 m. K) § transduction: as simple as possible MEMS Technology Pressure Sensors § Piezo-resistive § Capacitive § Optical
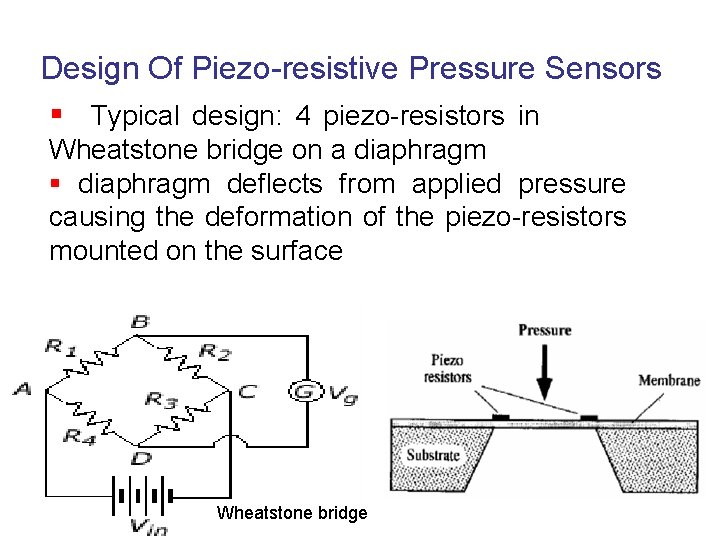
Design Of Piezo-resistive Pressure Sensors § Typical design: 4 piezo-resistors in Wheatstone bridge on a diaphragm § diaphragm deflects from applied pressure causing the deformation of the piezo-resistors mounted on the surface Wheatstone bridge
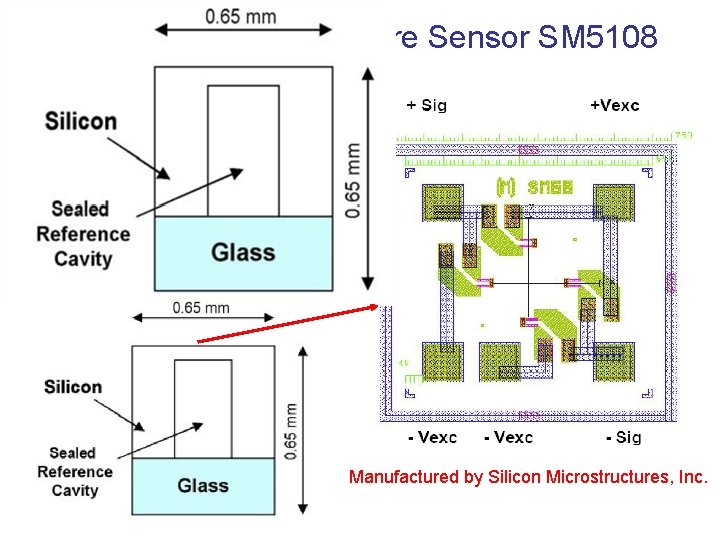
Piezo-resistive Pressure Sensor SM 5108 Semiconductor resistors joined by aluminum conductors in bridge configuration Resistors placed on diaphragm Two strained parallel to I Two strained perpendicular to I Manufactured by Silicon Microstructures, Inc.
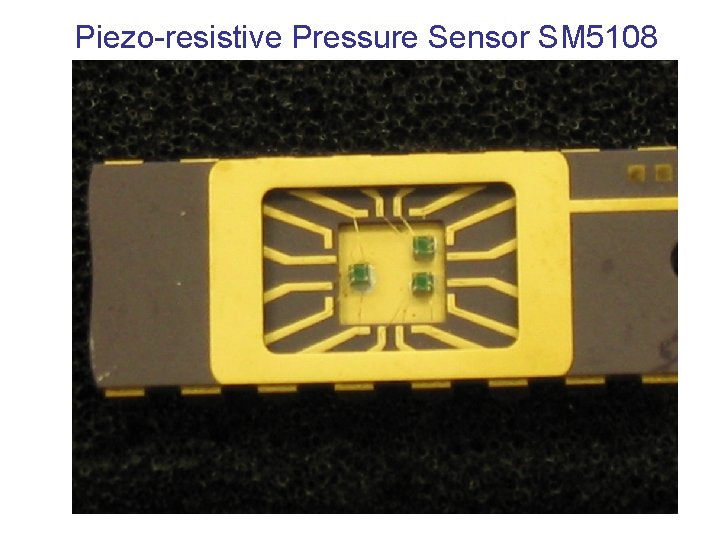
Piezo-resistive Pressure Sensor SM 5108
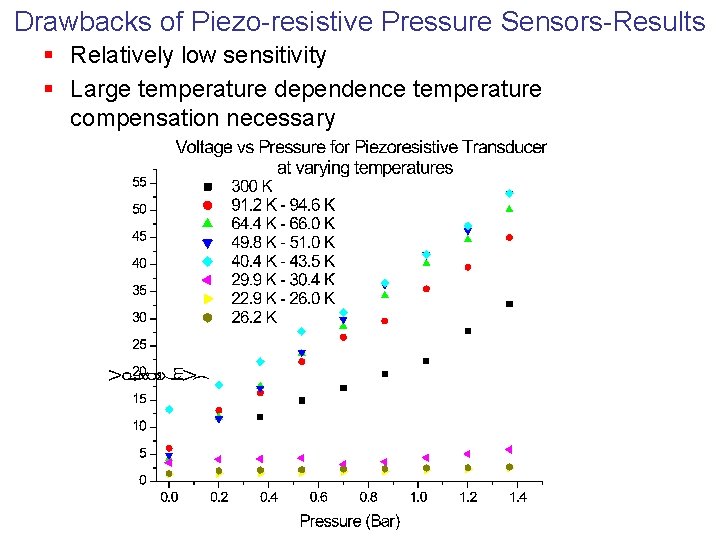
Drawbacks of Piezo-resistive Pressure Sensors-Results § Relatively low sensitivity § Large temperature dependence temperature compensation necessary
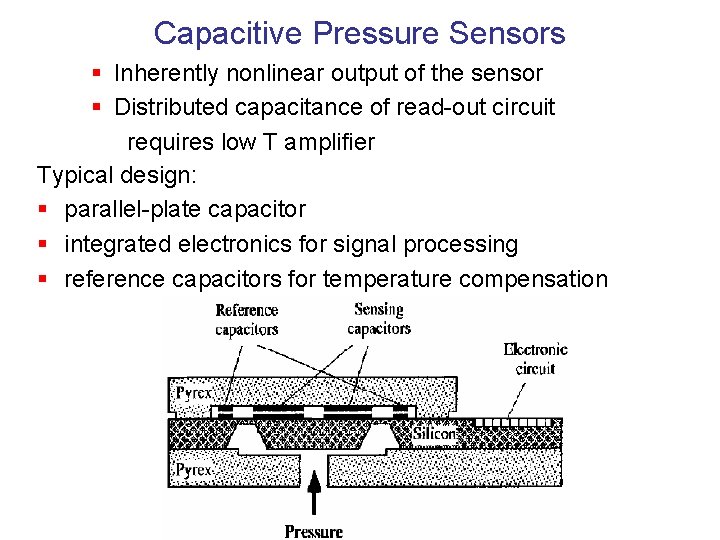
Capacitive Pressure Sensors § Inherently nonlinear output of the sensor § Distributed capacitance of read-out circuit requires low T amplifier Typical design: § parallel-plate capacitor § integrated electronics for signal processing § reference capacitors for temperature compensation
Advantages And Disadvantages Of Capacitive Pressure Sensors Over Piezo-resistive Sensors § Advantages: § Higher sensitivity § Long-term stability § Smaller temperature dependence § Disadvantages: § Non-linear output § More complicated manufacturing due to the integration of the compensation circuit and signal processing electronics to the sensor chip § Relatively high price
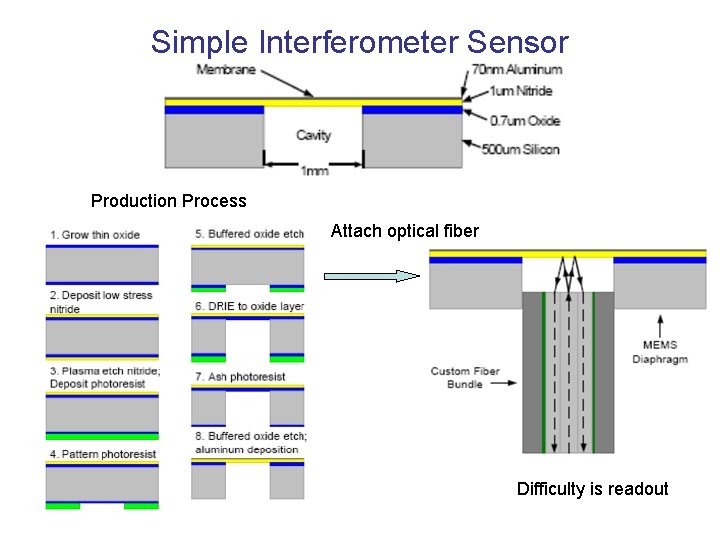
Optical Pressure Sensors Optical techniques typically employ a microsensor structure that deforms under pressure resulting in change in optical signal. Diaphragm-based sensors, for example, incorporate optical waveguides on the top surface.
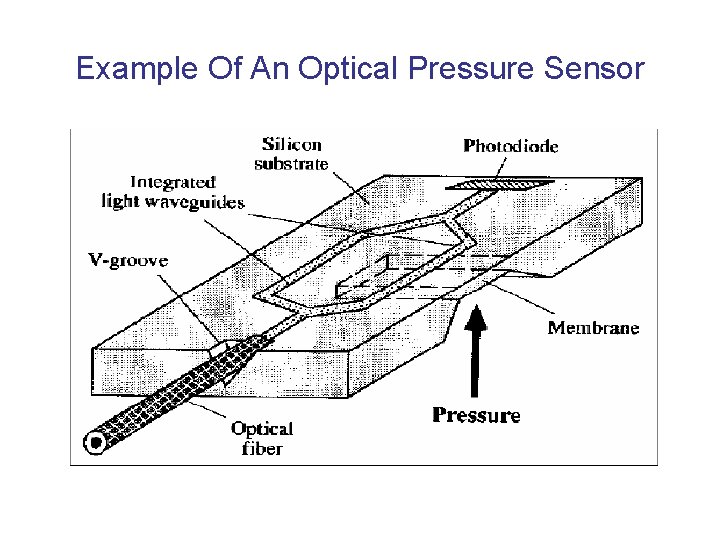
Example Of An Optical Pressure Sensor
Simple Interferometer Sensor Production Process Attach optical fiber Difficulty is readout
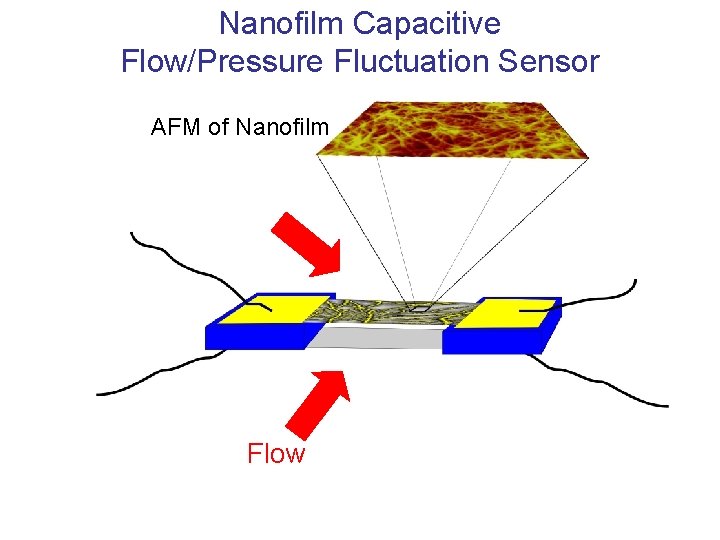
Nanotube/Film Technology • Small • Strong • Conducting • But not too conducting • Elastic • Stick to some surfaces Can be used for Thermometers Heaters Strain gauges Capacitor plates Flow meters Turbulence detectors
Nanotube film AFM Image 1 micron
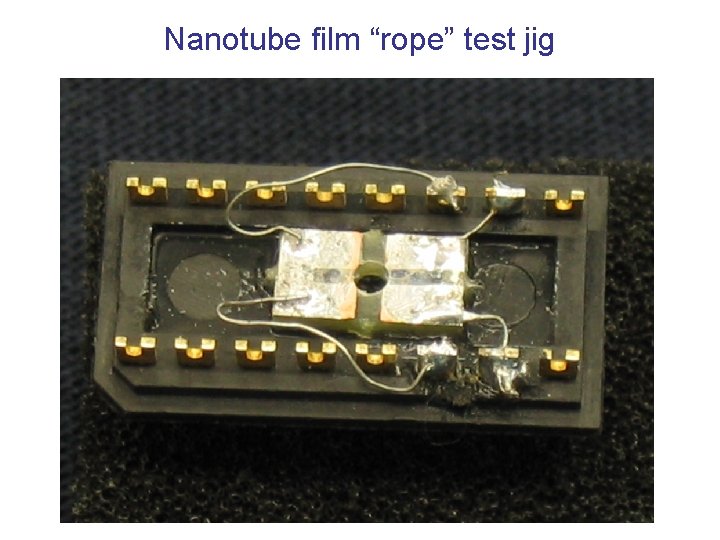
Nanotube Film Flow Sensor Test Helium liquid or gas flow Tinned Copper 4 -terminal Resistance Measurement G 10 (fiberglas)
Nanotube film “rope” test jig
Nanotube film “rope” R vs. T
Flow past a Nanotube film
Nanofilm Capacitive Flow/Pressure Fluctuation Sensor AFM of Nanofilm Flow
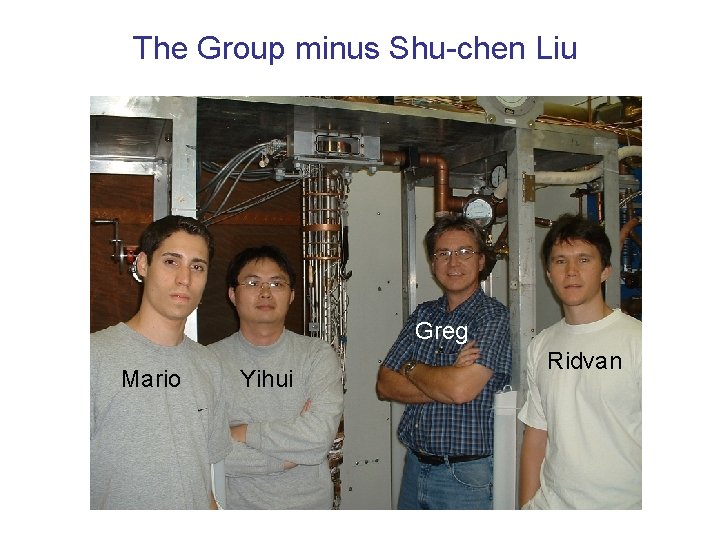
The Group minus Shu-chen Liu Greg Mario Yihui Ridvan
- Slides: 38