SMALL HYDRO POWER SYSTEM OVERVIEW Power from a


 granted")
 granted with")

 of Commissioned RE Installations Year Biogas Biomass (Landfill / Agri")
 1 RENEWABLE POWER SDN. BHD. , SMALL HYDRO HULU")
 15 KUASA SEZAMAN SDN BHD, SMALL HYDRO KUALA KANGSAR,")


 – ρ = density of")


- Slides: 36
SMALL HYDRO POWER SYSTEM
OVERVIEW • Power from a small hydro plant – potential energy, pressure energy and kinetic energy. • Design guideline – Reduce pipe losses by evaluating friction head losses for different types of pipe, optimum flow rate. • Determination of the available water flow. • Three different approaches to transform the water power into the mechanical energy needed to rotate the shaft of an electrical generator – Impulse turbines, reaction turbines, water wheel. • Electrical aspects of small hydro – generator, charge controller, batteries and grid interface.
WHAT IS SMALL HYDROPOWER? • Defining small hydropower plant is that of output • International Union of Producers and Suppliers of Electricity (UNIPEDE), the European Commission, European Small Hydropower Association (ESHA) defined a scheme of less than 10 MW • Italy fixes limit at 3 MW • UK limit at 5 MW • France limit at 8 MW • MALAYSIA LIMIT AT 20 MW
PLANTS IN PROGRESS • This table shows the total RE capacities (in MW) granted with Feed-in Approvals under the Fi. T mechanism and which have not yet achieved the Fi. T Commencement Date. Installed Capacity (MW) of Plants in Progress Year Biogas 2012 2013 2014 2015 2016 0. 00 2. 30 2. 40 0. 00 Cumulative 4. 70 Biogas Biomass (Landfill / Agri Waste) 2. 00 0. 00 2. 00 12. 00 7. 10 43. 00 16. 93 22. 00 1. 13 9. 95 29. 16 86. 95 Biomass (Solid Waste) Small Hydro Solar PV 0. 00 11. 09 0. 00 28. 30 26. 80 28. 94 133. 10 0. 09 36. 02 37. 33 0. 00 2. 09 80. 62 127. 72 67. 87 144. 18 11. 09 217. 14 73. 44 422. 48 Total
OPERATION PLANTS • This table shows the total RE capacities (in MW) granted with Feed-in Approvals under the Fi. T mechanism and which have achieved the Fi. T Commencement Date. Installed Capacity (MW) of Commissioned RE Installations Year Biogas 2012 2013 2014 2. 00 3. 38 0. 00 Cumulative 5. 38 Biogas Biomass (Landfill / (Solid Agri Waste) 3. 16 43. 40 8. 90 3. 20 0. 00 6. 36 43. 40 8. 90 Small Hydro Solar PV Total 11. 70 0. 00 31. 57 81. 74 0. 35 100. 73 88. 32 0. 35 11. 70 113. 66 189. 40
SMALL HYDROPOWER GENERATION • The following table documents the amount of RE generated under the Fi. T system, in Megawatt-hours (MWh). • The reading represents RE generated on an annual basis and for the respective on-going year. Readings are reported up to the month stated in the brackets. Annual Power Generation (MWh) of Commissioned RE Installations Year Biogas (Landfill / Agri Waste) Biomass (Solid Waste) Small Hydro Solar PV 2014 6401. 82 2933. 86 65190. 62 3636. 44 21665. 39 37114. 55 2013 9039. 84 9477. 59 209407. 59 11144. 25 73032. 12 47643. 66 2012 98. 11 7465. 40 101309. 87 3234. 52 25629. 78 4714. 01
Annual Power Generation (MWh) of Commissioned RE Installations Year Biogas Biomass (Landfill / Agri Waste) Biomass Small Hydro Solar PV (Solid Waste) 2014 6401. 82 2933. 86 65190. 62 3636. 44 21665. 39 37114. 55 2013 9039. 84 9477. 59 209407. 59 11144. 25 73032. 12 47643. 66 2012 98. 11 7465. 40 101309. 87 3234. 52 25629. 78 4714. 01 • A study by PTM/DANIDA entitled “Study on Grid Connected Electricity Baselines in Malaysia” assessed the overall average emission factor for Malaysia and Sabah to be 0. 69 kg. CO 2 eq/k. Wh. • This was calculated using a methodology adopted by United Nations Framework Convention for Climate Change (UNFCCC) and the International Panel on Climate Change (IPCC) and is based on the combined margin for power generation.
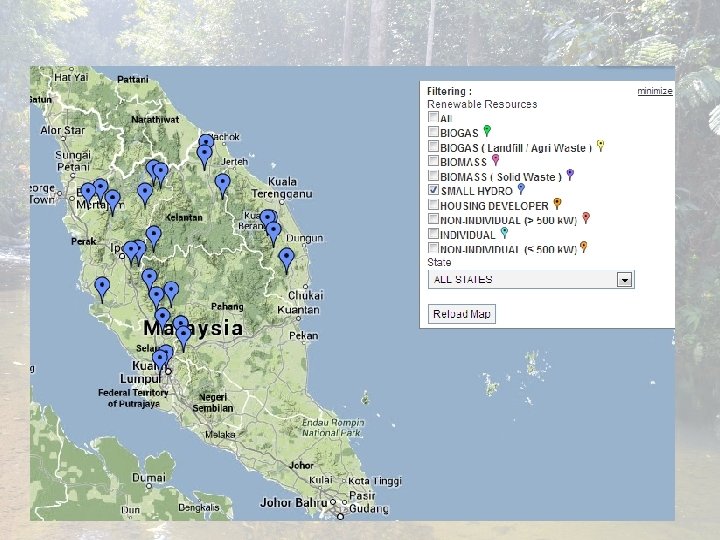
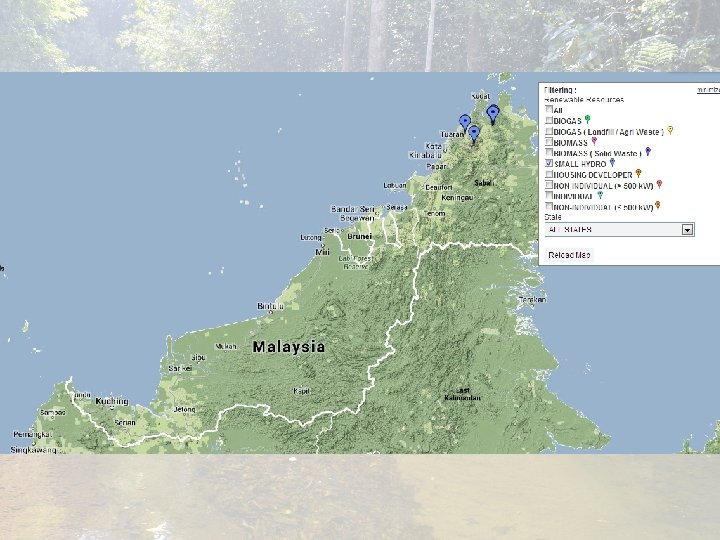
NO. COMPANY REGION CAPACITY (MW) 1 RENEWABLE POWER SDN. BHD. , SMALL HYDRO HULU SELANGOR, SELANGOR 2. 00 2 ESAJADIPOWER SDN BHD, SMALL HYDRO KOTA BELUD, SABAH 2. 00 3 CONSO HYDRO R E SDN. BHD. , SMALL HYDRO KAMPAR, PERAK 2. 00 4 TANAH JERNIH SDN BHD, SMALL HYDRO DUNGUN, TERENGGANU 2. 00 5 SUMBANGAN SAKTI SDN. BHD, SMALL HYDRO RAUB, PAHANG 2. 00 6 C TWO ENERGY SDN BHD, SMALL HYDRO HULU TERENGGANU, TERENGGANU 2. 30 7 I. S. ENERGY SDN. BHD. , SMALL HYDRO KUALA KERAI, KELANTAN 3. 20 8 JERNIH SERIBUMI SDN BHD, SMALL HYDRO KEMAMAN, TERENGGANU 3. 93 9 SEJAHTERA KUASA SDN BHD, SMALL HYDRO KUANTAN, PAHANG 4. 00 10 ESAJADIPOWER SDN BHD, SMALL HYDRO KOTA MARUDU, SABAH 4. 50 11 PASDEC MEGA SDN BHD, SMALL HYDRO BENTONG, PAHANG 5. 00 12 ONE RIVER POWER SDN BHD, SMALL HYDRO KOTA MARUDU, SABAH 5. 60 13 ZEQNA CORPORATION SDN BHD, SMALL HYDRO BATANG PADANG, PERAK 6. 00 14 AMCORP PERTING HYDRO SDN BHD, SMALL HYDRO BENTONG, PAHANG 6. 00
NO. COMPANY REGION CAPACITY (MW) 15 KUASA SEZAMAN SDN BHD, SMALL HYDRO KUALA KANGSAR, PERAK 7. 00 16 JERNIH BUMIRAYA SDN BHD, SMALL HYDRO AJIL, TERENGGANU 8. 01 17 JMT KELANTAN BARU SDN BHD, SMALL HYDRO KEMAMAN, TERENGGANU 10. 00 18 JMT KELANTAN BARU SDN BHD, SMALL HYDRO MACHANG, KELANTAN 10. 00 19 ONE RIVER POWER SDN BHD, SMALL HYDRO KOTA MARUDU, SABAH 10. 00 20 GUNUNG HYDROPOWER SDN BHD, SMALL HYDRO KUALA KANGSAR, PERAK 10. 00 21 GUNUNG HYDROPOWER SDN BHD, SMALL HYDRO LENGGONG, PERAK 10. 00 22 PESAKA TECHNOLOGIES SDN BHD, SMALL HYDRO GUA MUSANG, KELANTAN 12. 00 23 ONE RIVER POWER SDN BHD, SMALL HYDRO KOTA MARUDU, SABAH 13. 50 24 25 SELAMA HIDRO SDN BHD, SMALL HYDRO KERIAN ENERGY SDN BHD, SMALL HYDRO SELAMA, PERAK 13. 80 14. 00 26 TEMENGGOR HYDRO SDN BHD, SMALL HYDRO HULU PERAK, PERAK 14. 00 27 28 TALANG HYDRO SDN BHD, SMALL HYDRO SINGGOR HYDRO SDN BHD, SMALL HYDRO HULU PERAK, PERAK 19. 00 27. 00
Fi. T DASHBOARD Fi. T Rates for Small Hydro (21 years from Fi. T Commencement Date) Description of Qualifying Renewable Energy Installation (a) Basic Fi. T rates having installed capacity of : (i) up to and including 10 MW (ii) above 10 MW and up to and including 30 MW Fi. T Rates (RM per k. Wh) 1 JAN 2014 0. 2400 0. 2300
HYDRAULIC ENERGY • Conversion into mechanical energy is through intermediary of a turbine. • Usage of energy turbine requires from amount of water and altitude. • It possible only in places that offer sufficient discharger and a difference in levels. • Difference in levels may be natural, when water is collected at a height and led to the turbine, located below it or artificial.
HYDRAULIC ENERGY • Hydropower, Ph = ρQg. H (W) – ρ = density of water (~1000 kg/m³ at 10°C; kg/m³) – Q = discharge of the scheme (m³/s) – g. H = specific hydraulic energy • g. H=gΔZ – g. Hr - c 2²/2 (J/kg) – ΔZ = difference in altitude between point 0 and point 3 (m) – g. Hr = energy loss in the pipe between point 0 and point 1 due to friction and the geometry of the pipe – c 2²/2 = residual kinetic energy at the outlet of the turbine and which cannot be recovered.
HYDRAULIC ENERGY 0 ΔZ 3 1 T 2 Principle of a hydraulic scheme
HYDRAULIC ENERGY • The electric output supplied to the grid is expressed by: • Pel = Ph·ηt·ηm· ηg· ητ (W) – Ph = hydropower – ηt = efficiency of the turbine – ηm= efficiency of various mechanical part (bearings, speed increaser) practically constant – ηg = efficiency of generator – ητ = efficiency of possible transformer
EXPLOITATION OF HYDRAULIC FORCE DIAGRAM OF A COMPLETE SCHEME
EXPLOITATION OF HYDRAULIC FORCE • Weir : maintain a minimum elevation on the upstream level (storage space) • Fish-pass : allows the migration of water fauna • Water intake : withdraws water from the upstream level (protect from floating trash) • Sand separator : allows the particles in suspension to settle (certain river) • Water chamber : possible to guarantee that the penstock will be in water at all times • Penstock : takes the water from water chamber to the power plant • Power plant : small sized building that accommodates the collection of electromechanical equipment (control, connection to the electricity grid, alternator, turbine and inlet valve)
DIFFERENT TYPE OF SCHEMES ENCOUNTERED • Hydraulic scheme is characterized by 2 features: - Possibility of storing a volume of water to be used heads • Heads can be classified into 3 categories: - OPERATION RANGE OF THE TURBINES high-head schemes (higher than 60 m) Medium-head schemes (between 25 m – 250 m) Low-head schemes (less than 30 m)
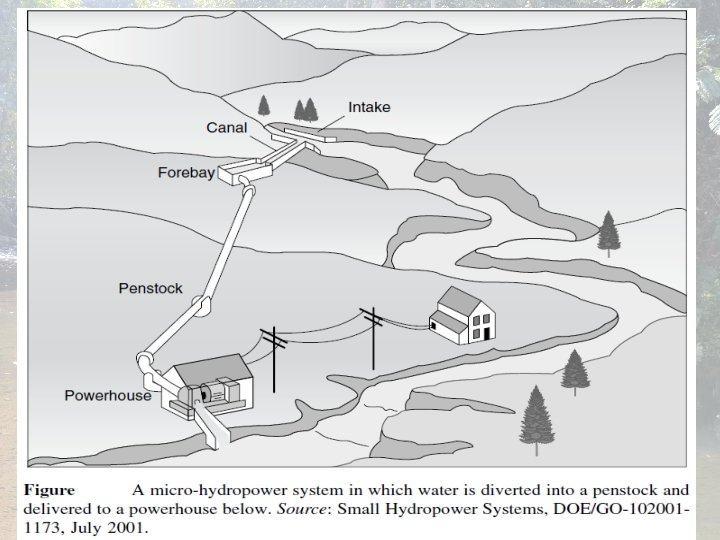
POWER FROM SMALL HYDRO It can be written that the energy delivered by a micro-hydro system is given by where e is the efficiency of the turbine/generator. From eq. above comes the following very handy rules-of-thumb for ≈50%-efficient turbine/generator systems (which is in the right ballpark for a micro-hydro plant):
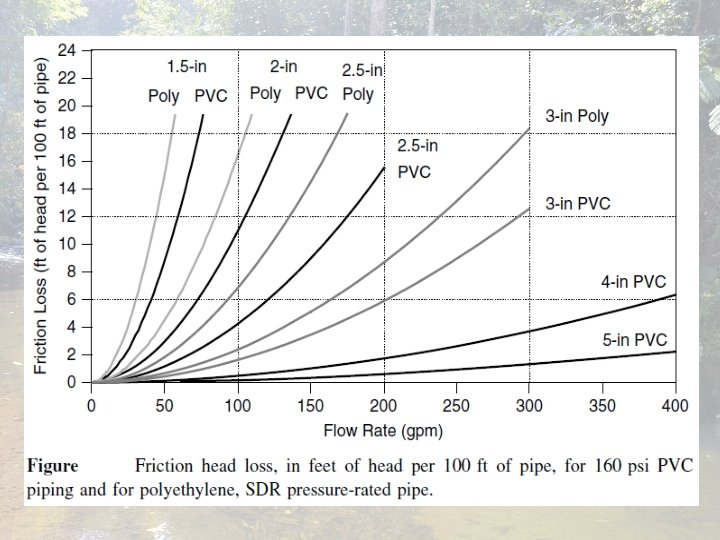
PIPE LOSSES • PVC pipe has lower friction losses and it is less expensive than poly pipe. • Small diameter poly may be easier to install • Large diameter poly comes in shorter lengths that can be butt-welded on site. e = efficiency of the turbine/generator
PIPE LOSSES • Net head = Gross head – Friction head
EXAMPLE • 150 gpm of water is taken from a creek and delivered through 1000 ft of 4 -in. -diameter PVC pipe to a turbine 100 ft lower than the source. Use the rule-of-thumb to estimate the power delivered by the turbine/generator. In a 30 -day month, how much electric energy would be generated?
SOLUTION • From the graph of friction head loss vs flow rate, at 150 gpm, 4 -in. PVC loses about 1 ft of head for every 100 ft of length. The friction loss for 1000 ft of pipe is: 1000 ft x 1 ft/100 ft = 10 ft • The net head available to the turbine is: Net head = Gross head – Friction head = 100 ft – 10 ft = 90 ft
SOLUTION • The electrical power delivered is: • The monthly electricity supplied would be: 24 hr x 30 d/m x 1. 35 k. W = 972 k. Wh • Total Fi. T for a month: 972 k. Wh x RM 0. 24 = RM 233. 38
TYPES OF TURBINES • Pelton turbine – An action machine that appropriate for high-head application (60 m to about 1000 m) with variable discharge. – The runner composed of buckets, driven by one or more jets coming from nozzles. – Nozzles varies between 1 and 6 according to relationship linked to the head and discharge. – Nozzles regulate the discharge arriving on the runner with needle. – The water is then returned into the river.
TYPES OF TURBINES • Francis turbine – A reaction machine whose ambit in the head extends from 25 m to about 250 m. – Preferred to Pelton turbines for heads that are higher than 60 m when the discharge is important and not very variable. – Often seen in small schemes because of its geometric complexity, ill adapted to small hydropower.
TYPES OF TURBINES • Diagonal turbine – Reaction machine with an application ambit from 25 m to 100 m. – Can also replace Pelton turbines for heads between 60 m and 100 m when the discharge is especially large and variable. – Relatively new and is not frequently seen in small hydropower schemes.
TYPES OF TURBINES • Kaplan turbine – Reaction machine whose ambit in the heads goes from 2 m to about 30 m. – 2 large categories of Kaplan turbine: • Turbines with a spiral casing • Axial turbine which in particular include bulb turbine
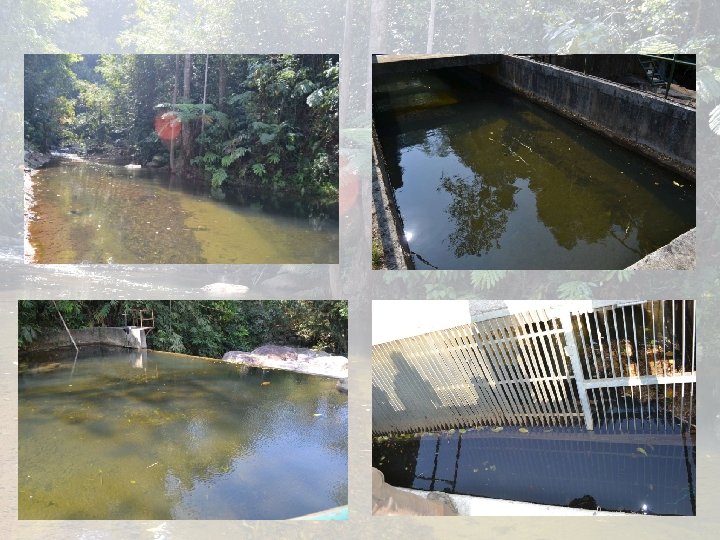
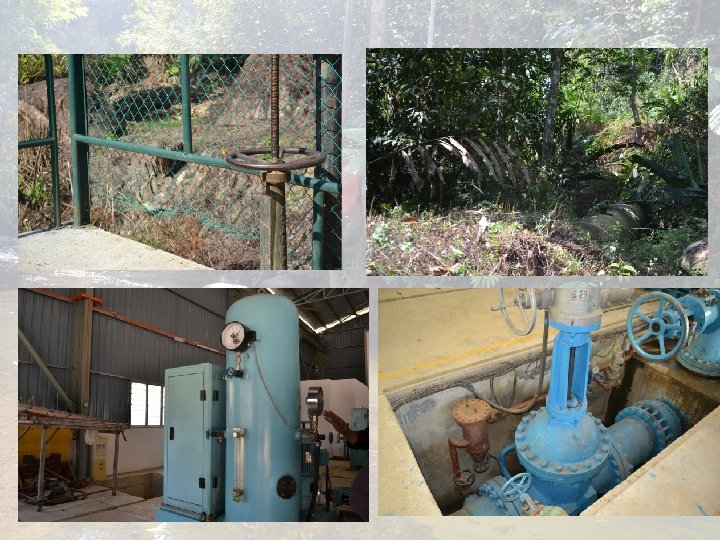
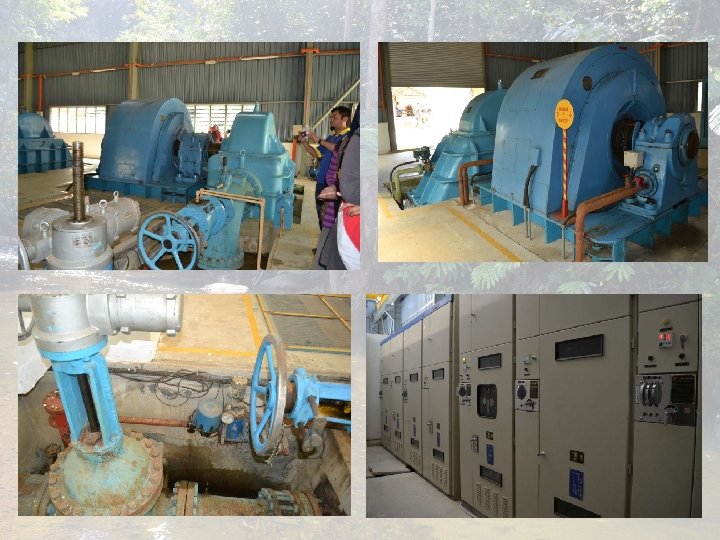
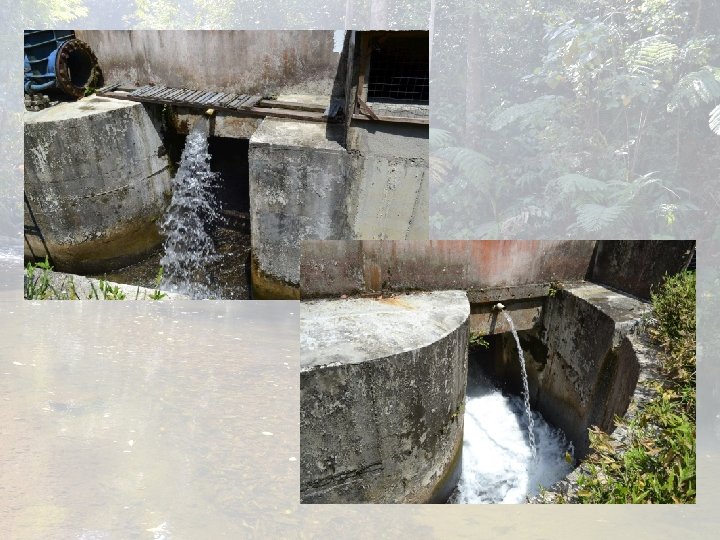
PHOTO GALLERY