SLRD Compost Feasibility Study Presentation Outline Background on

SLRD Compost Feasibility Study

Presentation Outline • • • Background on SLRD Existing organics waste management Study focus Study findings Conclusion

Background on SLRD • • Over 16, 000 km 2 Four electoral areas Four member municipalities Estimated population of 54, 500 • Projection of 68, 000 by 2031.

Existing Organics Waste Management • District of Squamish o o Curbside yard waste collection Squamish Landfill – accepts leaf and yard waste, food scraps Squamish Recycling Centre – accepts food scraps Squamish Depots – accept leaf and yard waste

Existing Organics Waste Management • Regional Municipality of Whistler o Whistler Composting Facility – accepts processed biosolids, food scraps and wood fibre o Whistler Transfer Station – accepts leaf and yard waste o Whistler Depots – accept food scraps o Private commercial food scrap collection

Existing Organics Waste Management • District of Lillooet o Lillooet Landfill - accepts all leaf and yard waste from the northern region • Village of Pemberton o Sea-to-Sky Soils – in the process of being established at the time of the study

Study Focus 1. 2. 3. 4. Estimation of organic materials Collection and transportation costs of organic waste Composting organic waste Organics collection and processing design/model options

Estimation of Organic Materials: Food Scraps • Completion of targeted waste audits • Included waste from each of the four electoral Areas: o Residential (curbside and drop-off depots) o Commercial loads • Results: o Represented 46% of residential waste o Represented 42% of commercial waste • Calculation of estimated organic materials o Used 2011 tonnage data to estimate organic materials from all of the regions

Estimation of Organic Materials: Leaf and Yard Waste and Biosolids • Leaf and Yard Waste: o Used the data from: • Waste audits • Annual tonnage disposal information • Biosolids o Assumed that WCF continue to process biosolids o Assumed that if proposed optimization measure for WCF would be implemented a quantity of the biosolids would be partially replaced by unprocessed quantity of food waste

Estimation of Recoverable Material Quantities Squamish Area Whistler Area Lillooet Area Estimated Total Estimated Recoverable tonnes % tonnes Leaf & Yard 770 70 540 90 70 65 380 100 380 Food & Non-Food 6100 50 3050 6340 50 3590 200 50 100 Biosolids 285** 100 285 200 100 200 Total 7156 54% 3875 6715 59% 3940 770 88% 680

Collection and Transportation • Collection Costs o Collection in Squamish for $130. 29/tonne • Transportation Costs o Factored location, travel time, average speed o Estimated transportation cost per tonne Estimated Transportation Cost Per Tonne To Squamish To Whistler/ Landfill Pemberton Area Lillooet $69 $55 Squamish $7 $20 Whistler $19 $16

Composting Organic Waste • Basic groups: Food Waste Leaf and Yard Waste Biosolids • Evolution from leaf & yard waste to food waste

Composting Organic Waste • 3 essential elements of composting o Feedstock o Air o Water CO CO 2 2 O 2 • Common challenges in controlling them (regardless of size, location)

Composting Organic Waste • Composting challenges in rural regions: o o Sources of organics widely distributed Lower tax base Lack of feedstock balance Vector control

Composting Organic Waste • Favourable features of rural regions: o o Higher supply of browns? Lower concentration of “Receptors” More tolerant communities? More available space, wait it out

Composting Organic Waste • The essentials of rural composting: o Keep it simple o Browns in excess o Moisture control

Collection and Processing Design/Model Options
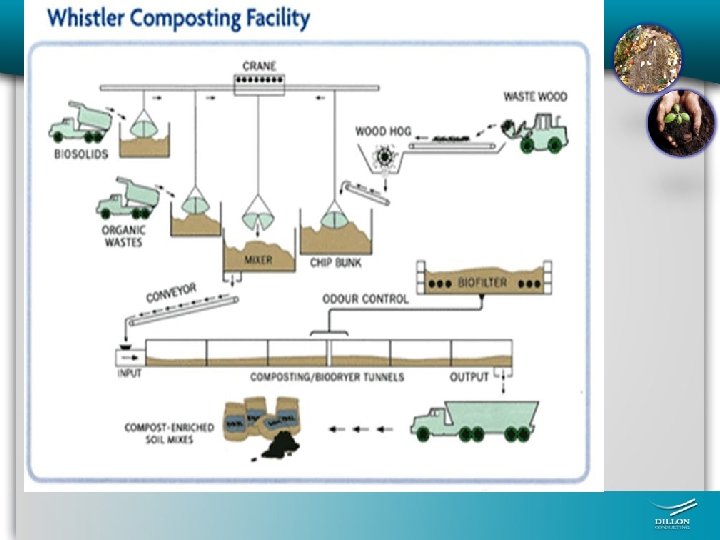

Whistler Operations

Whistler Tonnages & Recipe Feedstock Processed Food Waste Processed Biosolids Wood Fibre Used Total Processed 2009 Tonnage 2010 Tonnage 1252 1371 2011 Tonnage (CRA, 2012) 1082 3746 3521 3658 5385 7553 8268 10383 12445 13008

Whistler Process Performance
 150 3655 3590 7727 Total")
Design/Model Options Lillooet Whistler Squamish Centralized Facility Feedstock (t/yr) 150 3655 3590 7727 Total Feedstock (t/yr) 225 7178 6104 13, 482 Annualized Capital Cost (k$) 46 460 419 710 Annual Operating Costs (k$) 47 498 482 842 $/tonne 396 113 131 98

Conclusions • Composting SSO in rural locations is technically feasible but economically challenging • Composting SSO in rural locations may compete economically with alternative disposal practices only if full-cost accounting of the alternatives is considered • Composting SSO in rural locations must be simple, and be incorporated as much as possible into existing operations to be cost-effective • One size won’t fit all

Contact Information Alida Kusch, Environmental Scientist Dillon Consulting Limited Akusch@dillon. ca Paul Arnold, P. Eng. Bio-Logic Environmental Systems bio-logic@ns. sympatico. ca
- Slides: 24