Slope Slope Rise over run Higher number is

Slope
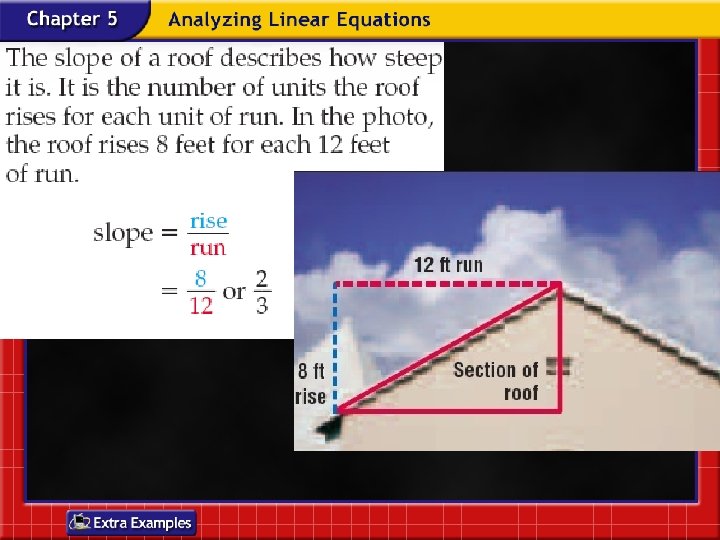

Slope • Rise over run • Higher number is steeper
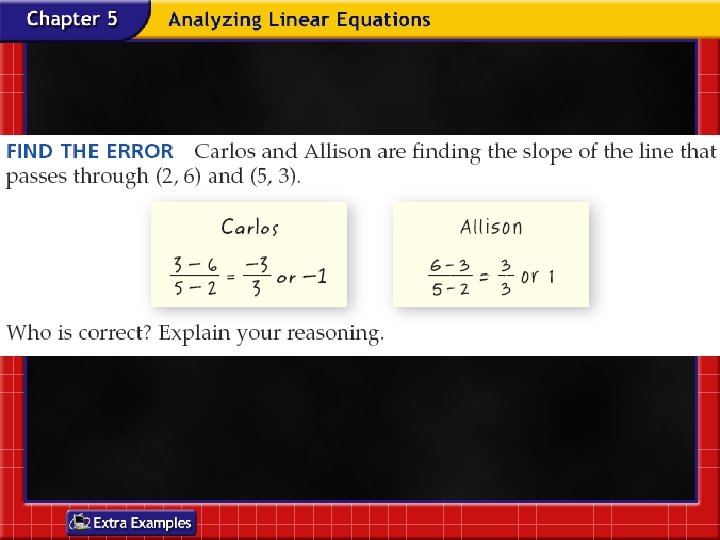
 and (5,")
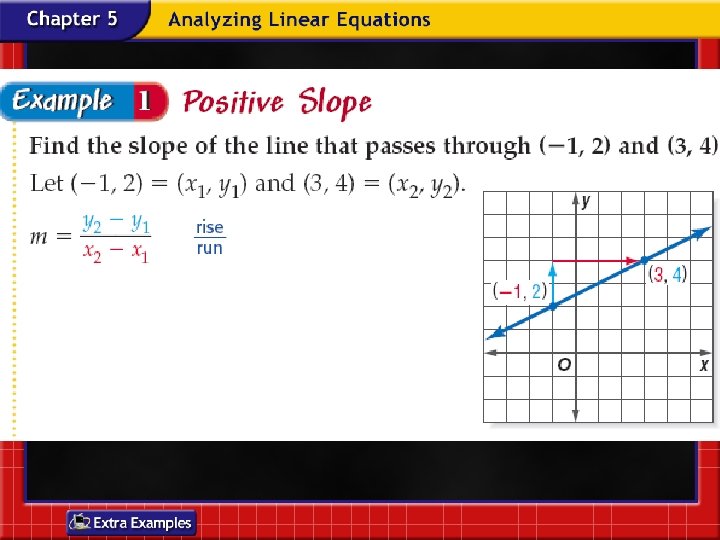
Find the slope of the line that passes through (– 3, 2) and (5, 5). Let and Substitute.

Simplify. Answer: The slope is
 and (7, 6).")
Find the slope of the line that passes through (4, 5) and (7, 6). Answer:
 and")
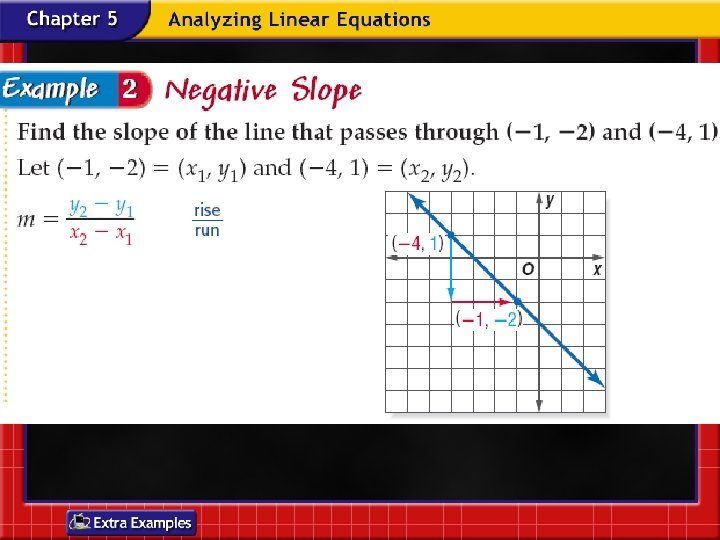
Find the slope of the line that passes through (– 3, – 4) and (– 2, – 8). Let and Substitute.

Simplify. Answer: The slope is – 4.
 and")
Find the slope of the line that passes through (– 3, – 5) and (– 2, – 7). Answer: – 2
 and (4,")
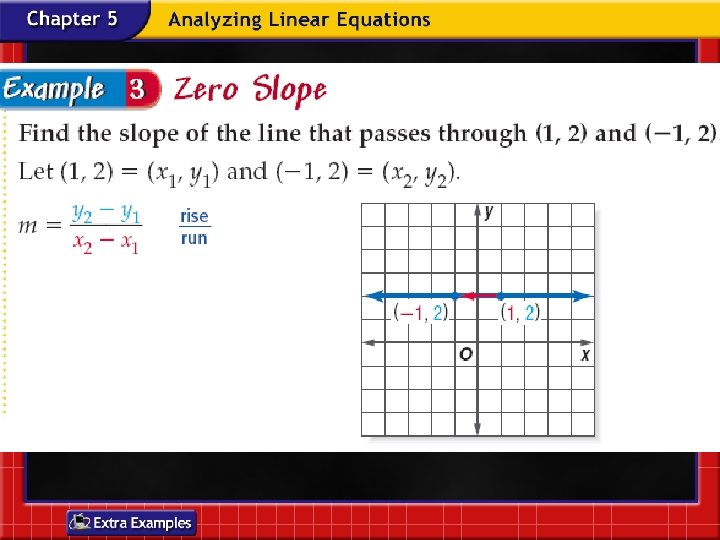
Find the slope of the line that passes through (– 3, 4) and (4, 4). Let and Substitute.

Simplify. Answer: The slope is 0.
 and")
Find the slope of the line that passes through (– 3, – 1) and (5, – 1). Answer: 0
 and")
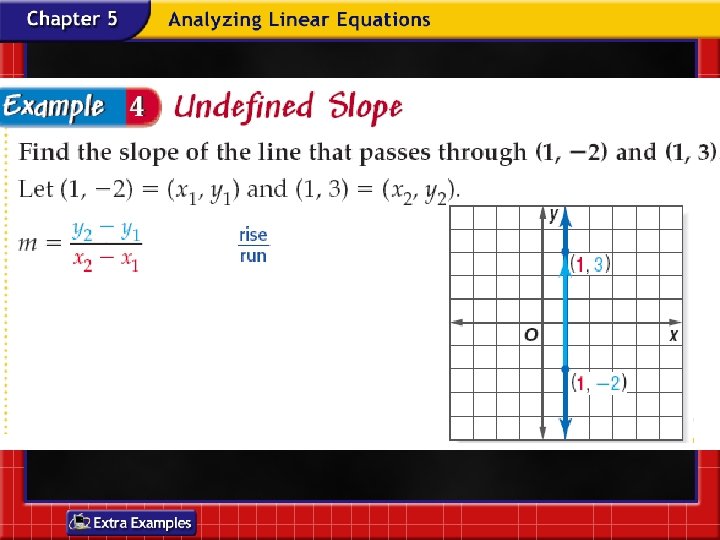
Find the slope of the line that passes through (– 2, – 4) and (– 2, 3). Let and Answer: Since division by zero is undefined, the slope is undefined.
 and (5,")
Find the slope of the line that passes through (5, – 1) and (5, – 3). Answer: undefined
 and (r,")
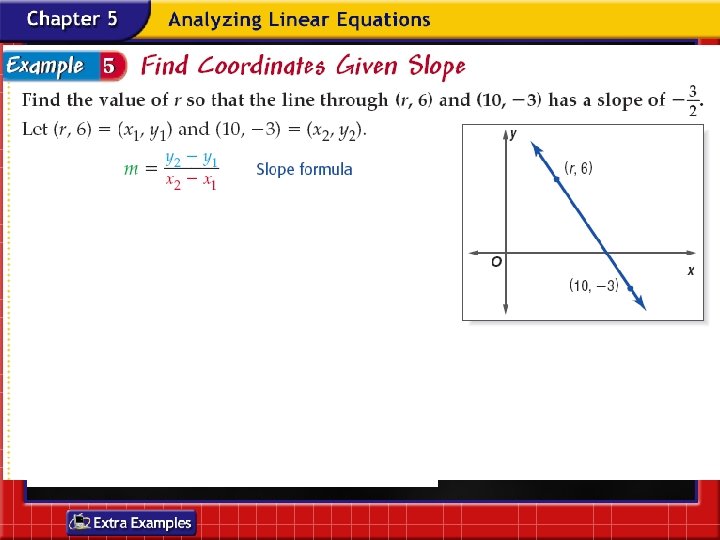
Find the value of r so that the line through (6, 3) and (r, 2) has a slope of Slope formula Substitute. Subtract.

Find the cross products. Simplify. Add 6 to each side. Answer: Simplify.
 and (3,")
Find the value of p so that the line through (p, 4) and (3, – 1) has a slope of Answer: – 5

Travel The graph to the right shows the number of U. S. passports issued in 1991, 1995, and 1999. Find the rates of change for 1991 -1995 and 1995 -1999. Use the formula for slope. millions of passports years

1991 -1995: Substitute. Simplify. Answer: The number of passports issued increased by 1. 9 million in a 4 -year period for a rate of change of 475, 000 per year.

1995 -1999: Substitute. Simplify. Answer: Over this 4 -year period, the number of U. S. passports issued increased by 1. 4 million for a rate of change of 350, 000 per year.

Explain the meaning of slope in each case. Answer: For 1991 -1995, on average, 475, 000 more passports were issued each year than the last. For 19951999, on average, 350, 000 more passports were issued each year than the last.

How are the different rates of change shown on the graph? Answer: There is a greater rate of change from 19911995 than from 1995 -1999. Therefore, the section of the graph for 1991 -1995 has a steeper slope.

Airlines The graph shows the number of airplane departures in the United States in recent years. a. Find the rates of change for 1990 -1995 and 1995 -2000. Answer: 240, 000 per year; 180, 000 per year

b. Explain the meaning of the slope in each case. Answer: For 1990 -1995, the number of airplane departures increased by about 240, 000 flights each year. For 19952000, the number of airplane departures increased by about 180, 000 flights each year.

c. How are the different rates of change shown on the graph? Answer: There is a greater vertical change for 1990 -1995 than for 1995 -2000. Therefore, the section of the graph for 1990 -1995 has a steeper slope.

Review Quiz

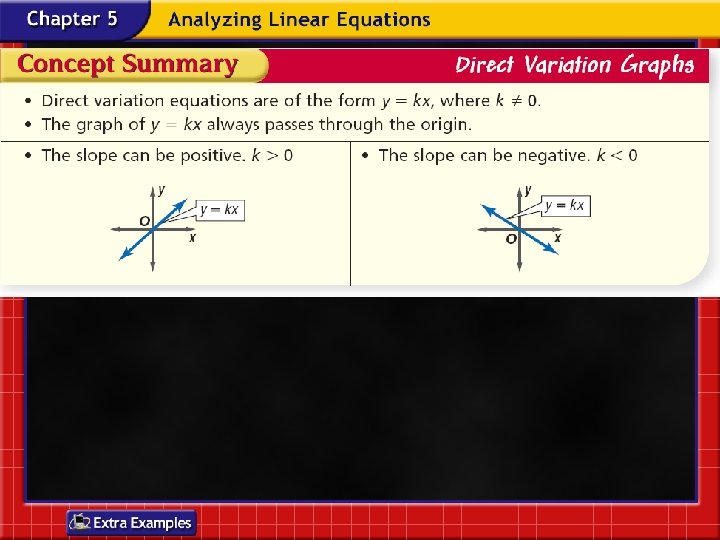
Direct Variation Equations

Vocabulary • Direct Variation Equation – An equation of the form y=kx, where k does not equal zero • Constant of Variation – k in a direct variation equation
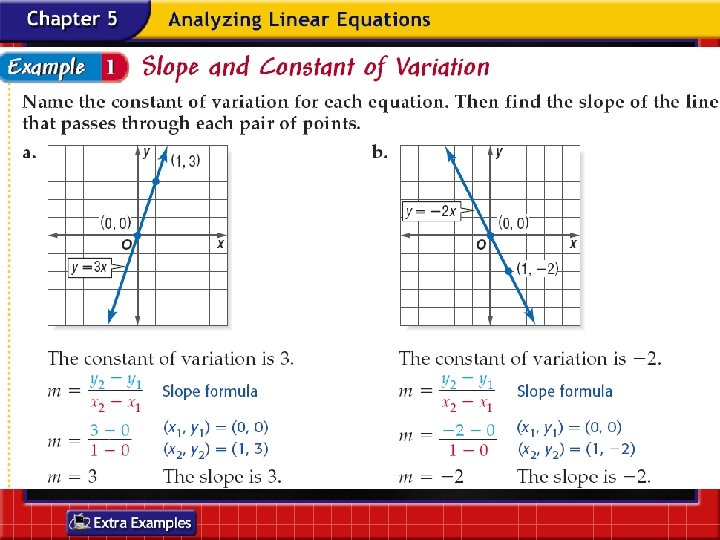
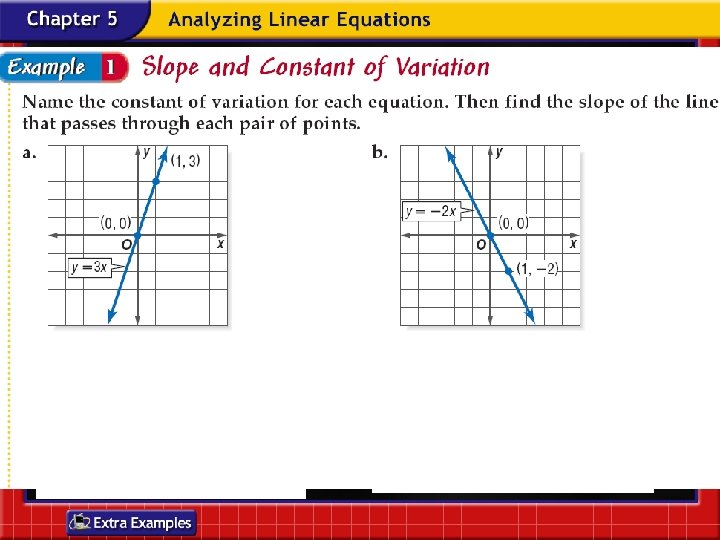

Name the constant of variation for the equation. Then find the slope of the line that passes through the pair of points. Slope formula Simplify. Answer: The constant of variation is 2. The slope is 2.

Name the constant of variation for the equation. Then find the slope of the line that passes through the pair of points. Slope formula Simplify. Answer: The constant of variation is – 4. The slope is – 4.

Name the constant of variation for the equation. Then find the slope of the line that passes through the pair of points. a. Answer: constant of variation: 4; slope: 4

Name the constant of variation for the equation. Then find the slope of the line that passes through the pair of points. b. Answer: constant of variation: – 3; slope: – 3

• The constant of variation is the slope

Add the slope to the origin

Add the slope to the origin
. Step")
Step 1 Write the slope as a ratio. Step 2 Graph (0, 0). Step 3 From the point (0, 0), move up 1 unit and right 1 unit. Draw a dot. Step 4 Draw a line containing the points.

Answer:
. Step")
Step 1 Write the slope as a ratio. Step 2 Graph (0, 0). Step 3 From the point (0, 0), move down 3 units and right 2 units. Draw a dot. Step 4 Draw a line containing the points.

Answer:


Suppose y varies directly as x, and when Write a direct variation equation that relates x and y. Find the value of k. Direct variation formula Replace y with 9 and x with – 3. Divide each side by – 3.

Simplify. Answer: Therefore,

Use the direct variation equation to find x when Direct variation equation Replace y with 15. Divide each side by – 3. Simplify. Answer: Therefore, when

Suppose y varies directly as x, and when a. Write a direct variation equation that relates x and y. Answer: b. Use the direct variation equation to find x when Answer: – 15

Travel The Ramirez family is driving cross-country on vacation. They drive 330 miles in 5. 5 hours. Write a direct variation equation to find the distance driven for any number of hours. Words The distance traveled is 330 miles, and the time is 5. 5 hours. Variables Distance Equation 330 mi equals rate r times time. 5. 5 h

Solve for the rate. Original equation Divide each side by 5. 5. Simplify. Answer: Therefore, the direct variation equation is

Graph the equation. The graph of slope of 60. Answer: passes through the origin with a

Estimate how many hours it would take to drive 600 miles. Original equation Replace d with 600. Divide each side by 60. Simplify. Answer: At this rate, it will take 10 hours to drive 600 miles.

Dustin ran a 26 -mile marathon in 3. 25 hours. a. Write a direct variation equation to find the distance ran for any number of hours. Answer: b. Graph the equation. Answer:

c. Estimate how many hours it would take to jog 16 miles. Answer: 2 hours

Homework • 5 -1 Slope – Front Side – Evens – Back Side – All • 5 -2 Slope and Direct Variation – Front Side – 4 -7 only – Back Side – All
- Slides: 63