
Slides at Simple Numbers meslides Michael Boggs Michael
Slides at: Simple. Numbers. me/slides Michael Boggs Michael. Boggs@crbcpa. net 256 -704 -0620
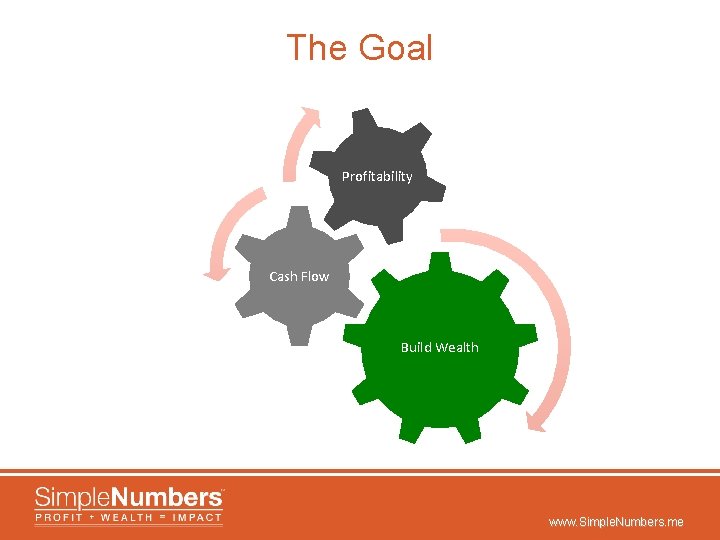
The Goal Profitability Cash Flow Build Wealth www. Simple. Numbers. me
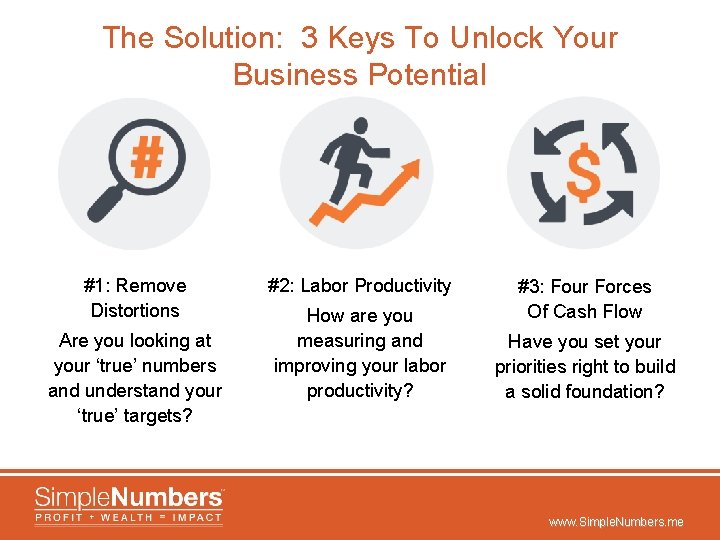
The Solution: 3 Keys To Unlock Your Business Potential #1: Remove Distortions Are you looking at your ‘true’ numbers and understand your ‘true’ targets? #2: Labor Productivity How are you measuring and improving your labor productivity? #3: Four Forces Of Cash Flow Have you set your priorities right to build a solid foundation? www. Simple. Numbers. me
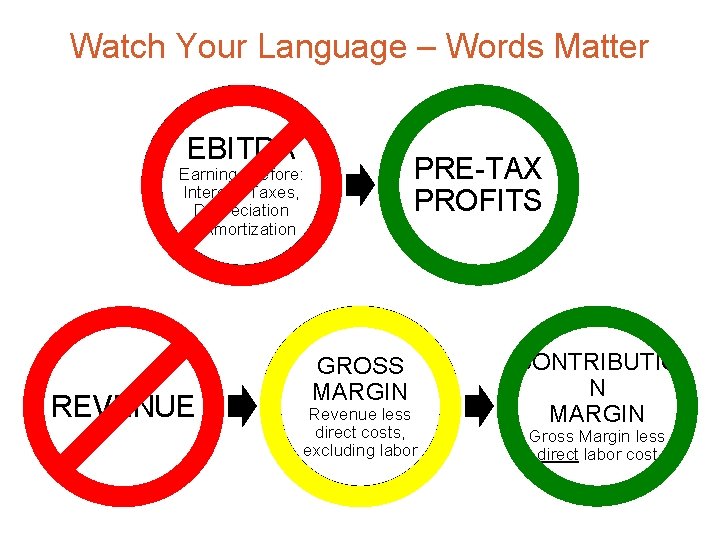
Watch Your Language – Words Matter EBITDA PRE-TAX PROFITS Earnings before: Interest, Taxes, Depreciation & Amortization REVENUE GROSS MARGIN Revenue less direct costs, excluding labor CONTRIBUTIO N MARGIN Gross Margin less direct labor cost
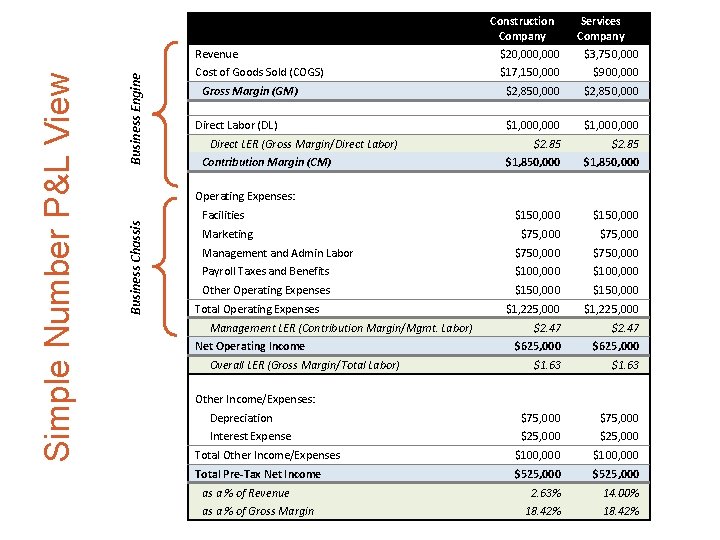
Construction Company $20, 000 Services Company $3, 750, 000 $17, 150, 000 $900, 000 $2, 850, 000 $1, 000, 000 $2. 85 $1, 850, 000 $150, 000 $75, 000 Management and Admin Labor $750, 000 Payroll Taxes and Benefits $100, 000 Other Operating Expenses $150, 000 $1, 225, 000 $2. 47 $625, 000 $1. 63 Business Engine Cost of Goods Sold (COGS) Gross Margin (GM) Direct Labor (DL) Direct LER (Gross Margin/Direct Labor) Contribution Margin (CM) Operating Expenses: Facilities Business Chassis Simple Number P&L View Revenue Marketing Total Operating Expenses Management LER (Contribution Margin/Mgmt. Labor) Net Operating Income Overall LER (Gross Margin/Total Labor) Other Income/Expenses: Depreciation $75, 000 Interest Expense $25, 000 Total Other Income/Expenses $100, 000 Total Pre-Tax Net Income $525, 000 2. 63% 14. 00% 18. 42% as a % of Revenue as a % of Gross Margin
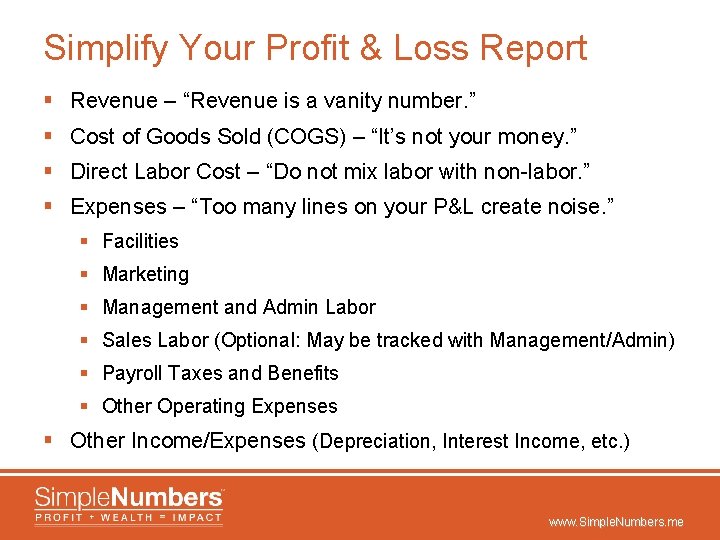
Simplify Your Profit & Loss Report § Revenue – “Revenue is a vanity number. ” § Cost of Goods Sold (COGS) – “It’s not your money. ” § Direct Labor Cost – “Do not mix labor with non-labor. ” § Expenses – “Too many lines on your P&L create noise. ” § Facilities § Marketing § Management and Admin Labor § Sales Labor (Optional: May be tracked with Management/Admin) § Payroll Taxes and Benefits § Other Operating Expenses § Other Income/Expenses (Depreciation, Interest Income, etc. ) www. Simple. Numbers. me
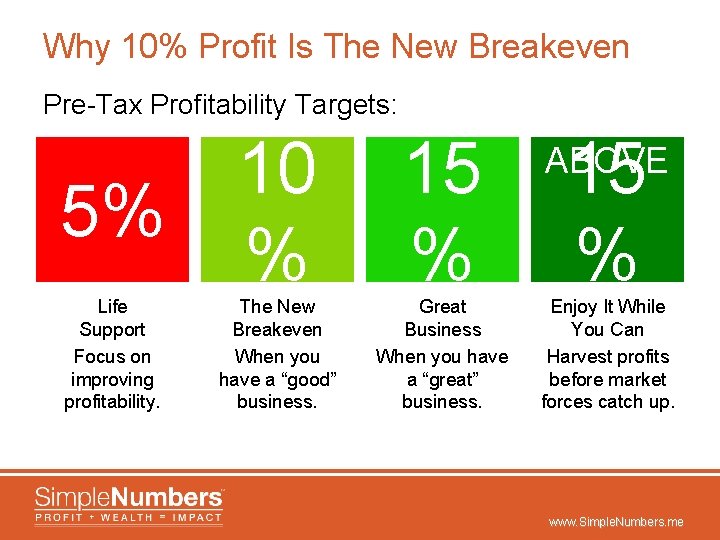
Why 10% Profit Is The New Breakeven Pre-Tax Profitability Targets: 5% 10 % 15 % Life Support Focus on improving profitability. The New Breakeven When you have a “good” business. Great Business When you have a “great” business. 15 % ABOVE Enjoy It While You Can Harvest profits before market forces catch up. www. Simple. Numbers. me
#2: Labor Productivity How are you measuring and improving your labor productivity? www. Simple. Numbers. me
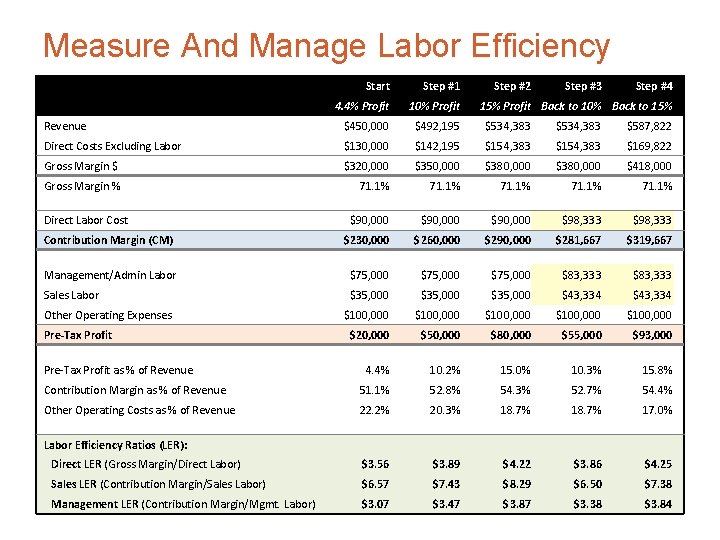
Measure And Manage Labor Efficiency Start Step #1 4. 4% Profit 10% Profit Revenue $450, 000 $492, 195 $534, 383 $587, 822 Direct Costs Excluding Labor $130, 000 $142, 195 $154, 383 $169, 822 Gross Margin $ $320, 000 $350, 000 $380, 000 $418, 000 71. 1% $90, 000 71. 1% $98, 333 Contribution Margin (CM) $230, 000 $260, 000 $290, 000 $281, 667 Management/Admin Labor $75, 000 $83, 333 $319, 667 $83, 333 Sales Labor $35, 000 $43, 334 $100, 000 $100, 000 $20, 000 $50, 000 $80, 000 $55, 000 4. 4% 10. 2% 15. 0% 10. 3% $93, 000 15. 8% Contribution Margin as % of Revenue 51. 1% 52. 8% 54. 3% 52. 7% 54. 4% Other Operating Costs as % of Revenue 22. 2% 20. 3% 18. 7% 17. 0% Direct LER (Gross Margin/Direct Labor) $3. 56 $3. 89 $4. 22 $3. 86 $4. 25 Sales LER (Contribution Margin/Sales Labor) $6. 57 $7. 43 $8. 29 $6. 50 $7. 38 Management LER (Contribution Margin/Mgmt. Labor) $3. 07 $3. 47 $3. 87 $3. 38 $3. 84 Gross Margin % Direct Labor Cost Step #2 Step #3 15% Profit Back to 10% Back to 15% Other Operating Expenses Pre-Tax Profit as % of Revenue Labor Efficiency Ratios (LER): Step #4
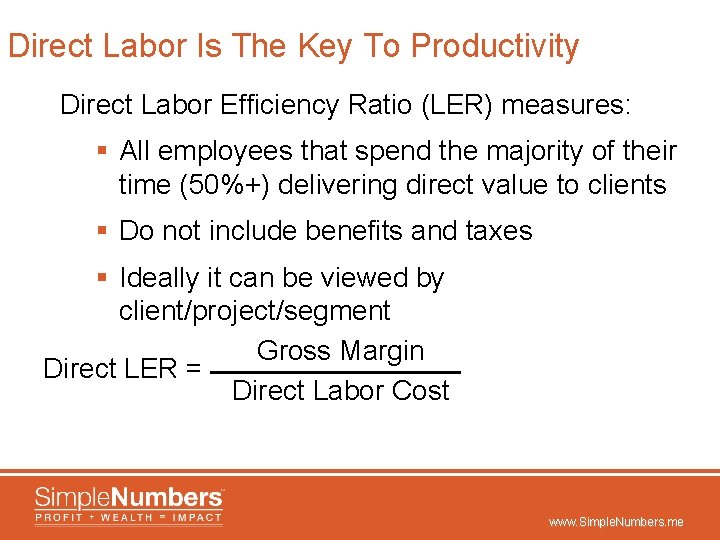
Direct Labor Is The Key To Productivity Direct Labor Efficiency Ratio (LER) measures: § All employees that spend the majority of their time (50%+) delivering direct value to clients § Do not include benefits and taxes § Ideally it can be viewed by client/project/segment Gross Margin Direct LER = Direct Labor Cost www. Simple. Numbers. me
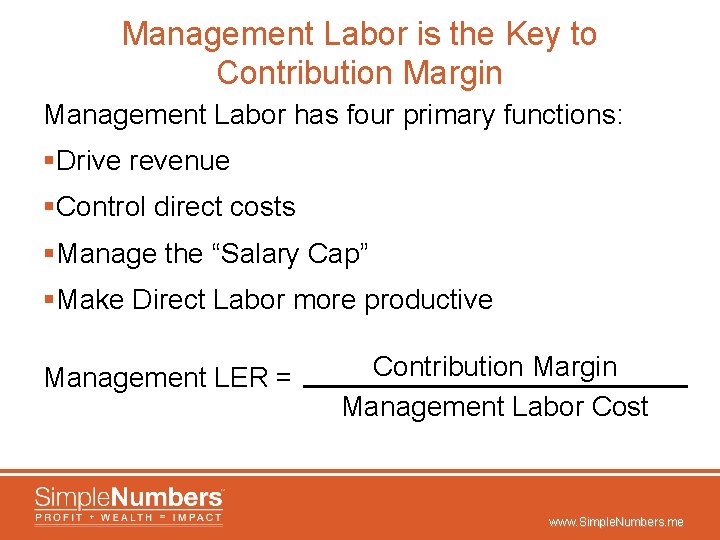
Management Labor is the Key to Contribution Margin Management Labor has four primary functions: §Drive revenue §Control direct costs §Manage the “Salary Cap” §Make Direct Labor more productive Management LER = Contribution Margin Management Labor Cost www. Simple. Numbers. me
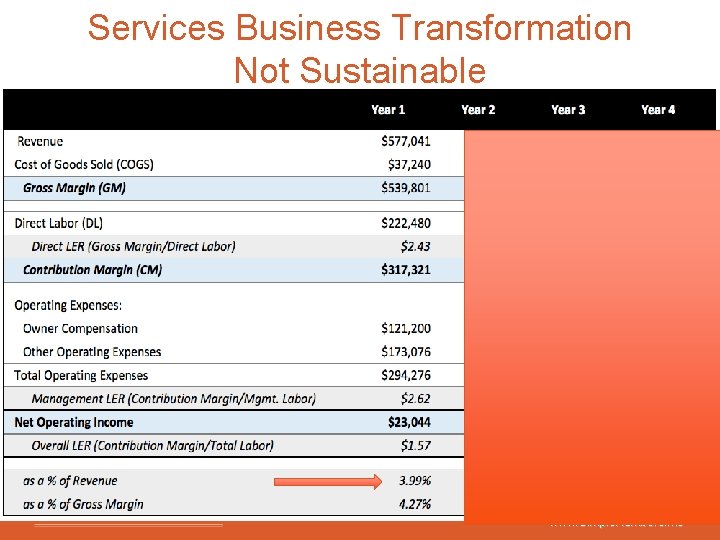
Services Business Transformation Not Sustainable www. Simple. Numbers. me
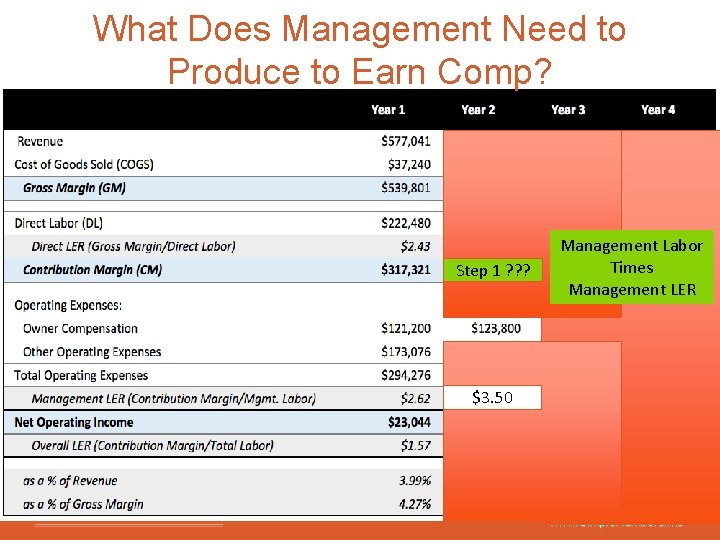
What Does Management Need to Produce to Earn Comp? Step 1 ? ? ? Management Labor Times Management LER $3. 50 www. Simple. Numbers. me
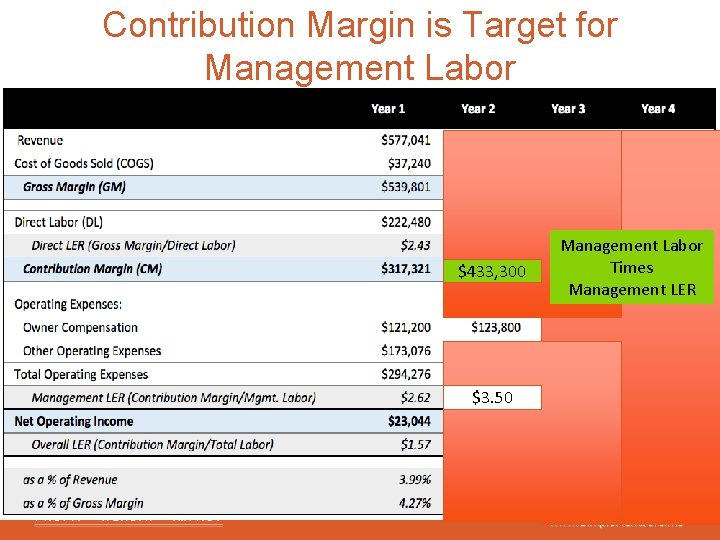
Contribution Margin is Target for Management Labor $433, 300 Management Labor Times Management LER $3. 50 www. Simple. Numbers. me
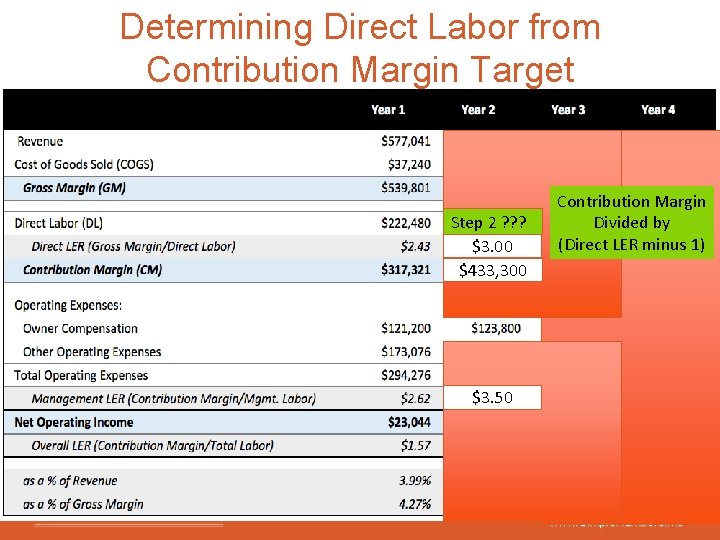
Determining Direct Labor from Contribution Margin Target Step 2 ? ? ? $3. 00 $433, 300 Contribution Margin Divided by (Direct LER minus 1) $3. 50 www. Simple. Numbers. me
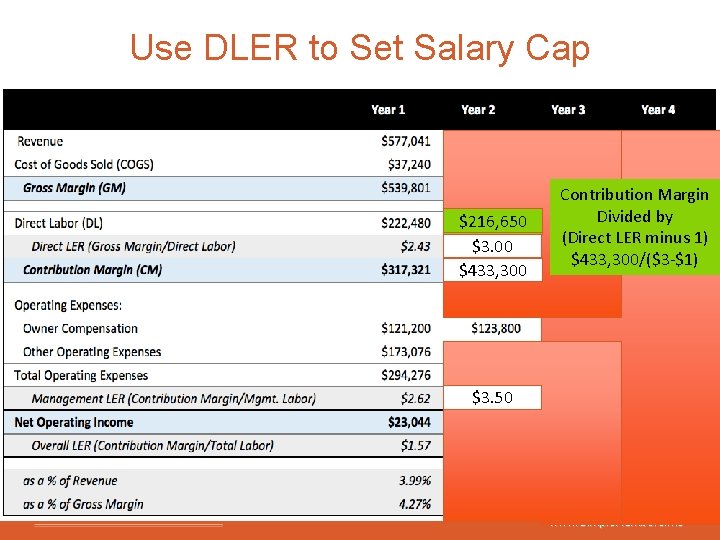
Use DLER to Set Salary Cap $216, 650 Step 2 ? ? ? $3. 00 $433, 300 Contribution Margin Divided by (Direct LER minus 1) $433, 300/($3 -$1) $3. 50 www. Simple. Numbers. me
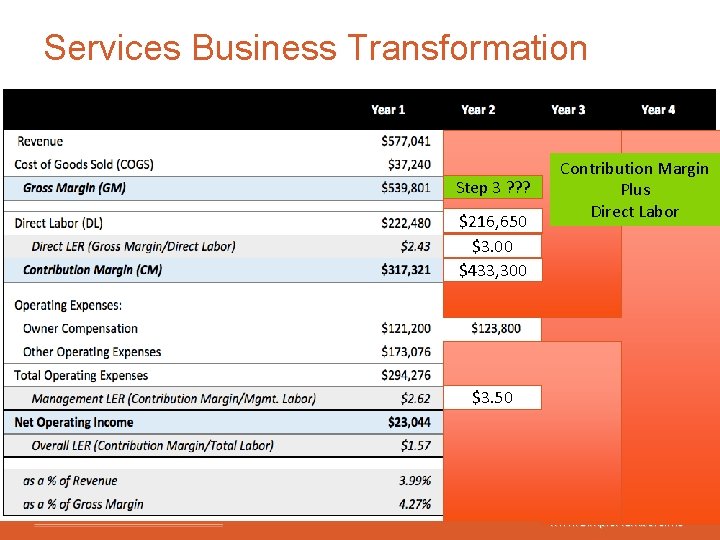
Services Business Transformation Step 3 ? ? ? $216, 650 $3. 00 $433, 300 Contribution Margin Plus Direct Labor $3. 50 www. Simple. Numbers. me
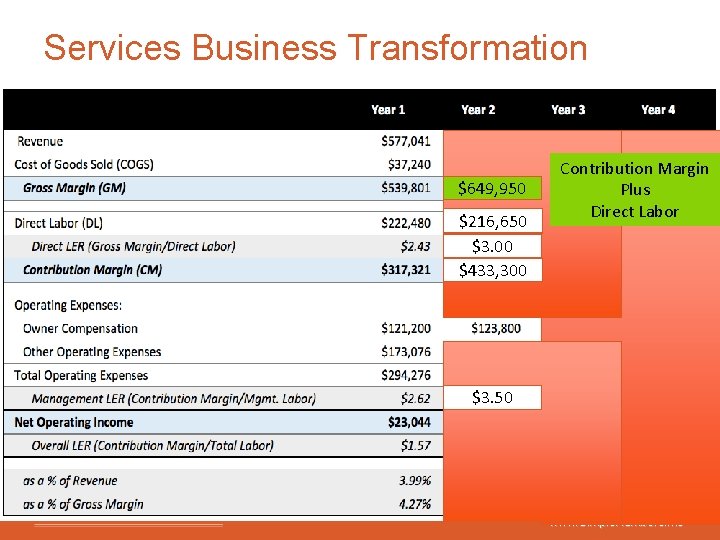
Services Business Transformation $649, 950 $216, 650 $3. 00 $433, 300 Contribution Margin Plus Direct Labor $3. 50 www. Simple. Numbers. me
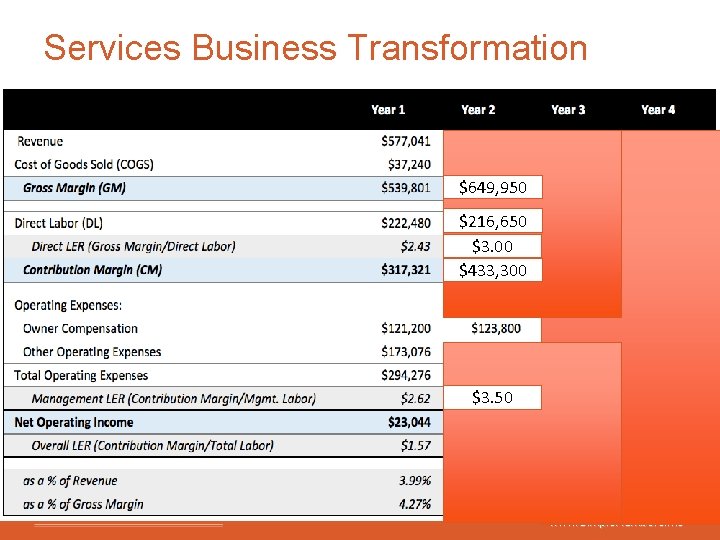
Services Business Transformation $649, 950 $216, 650 $3. 00 $433, 300 $3. 50 www. Simple. Numbers. me
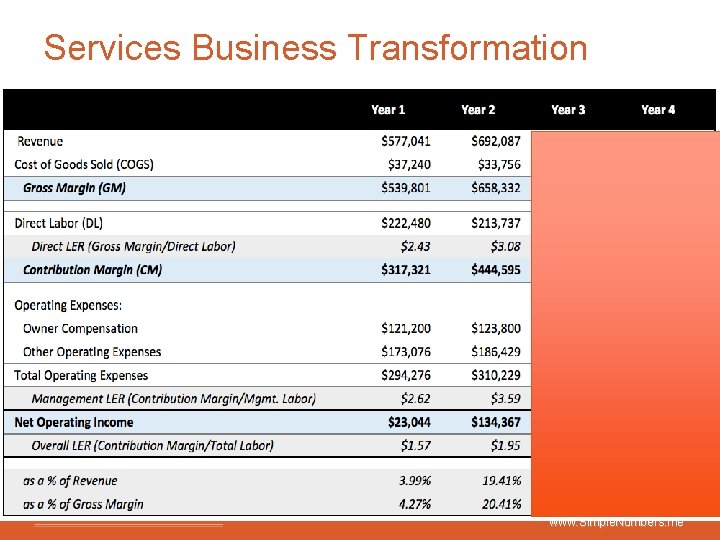
Services Business Transformation www. Simple. Numbers. me
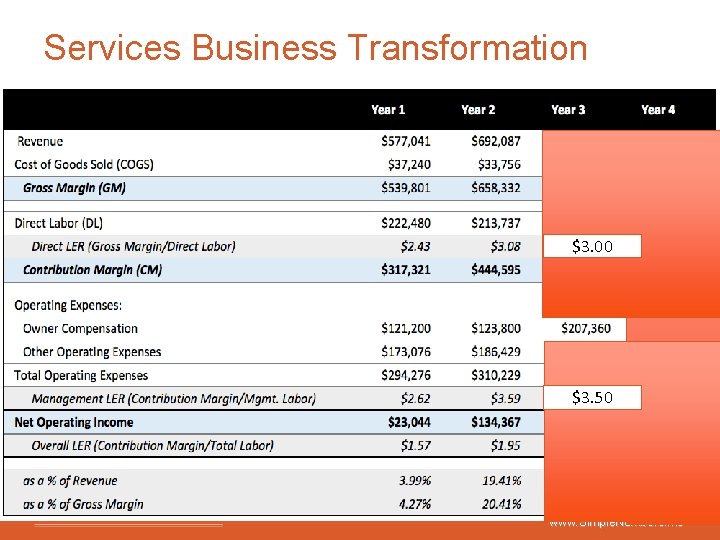
Services Business Transformation $3. 00 $3. 50 www. Simple. Numbers. me
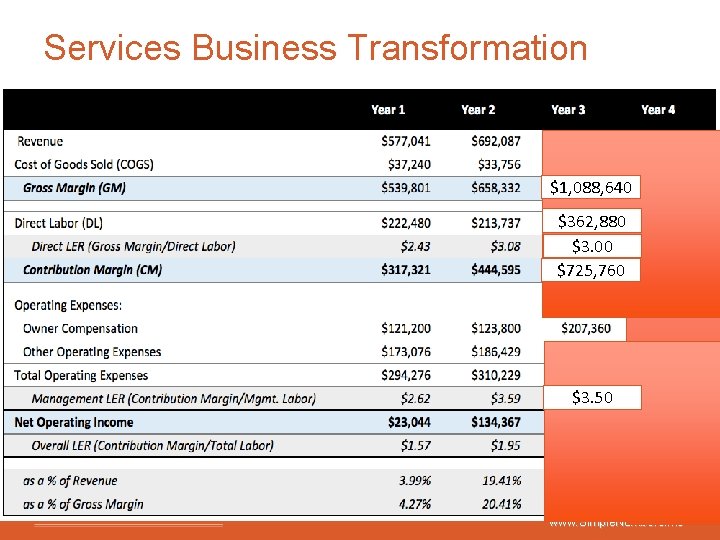
Services Business Transformation $1, 088, 640 $362, 880 $3. 00 $725, 760 $3. 50 www. Simple. Numbers. me
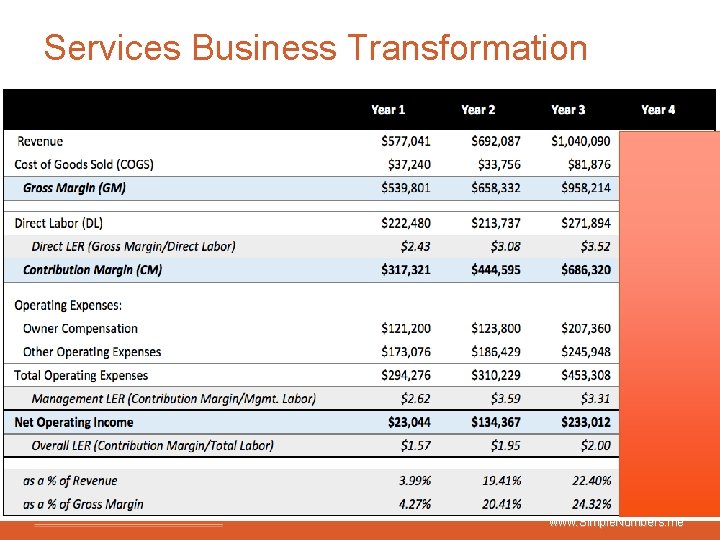
Services Business Transformation www. Simple. Numbers. me
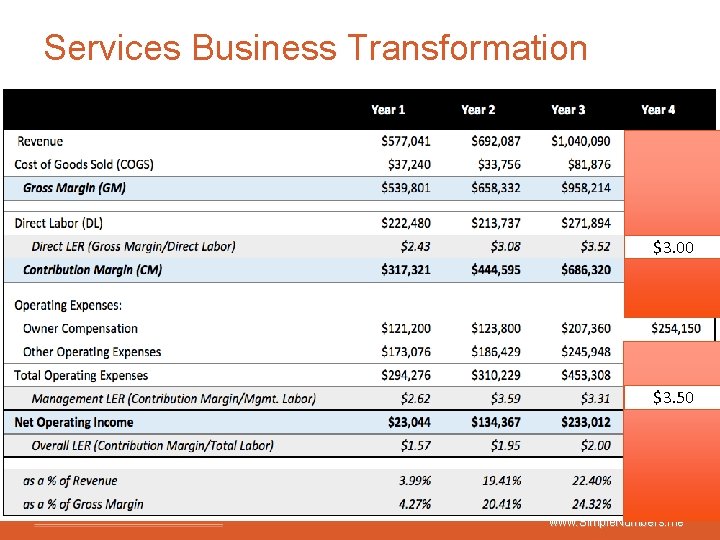
Services Business Transformation $3. 00 $3. 50 www. Simple. Numbers. me
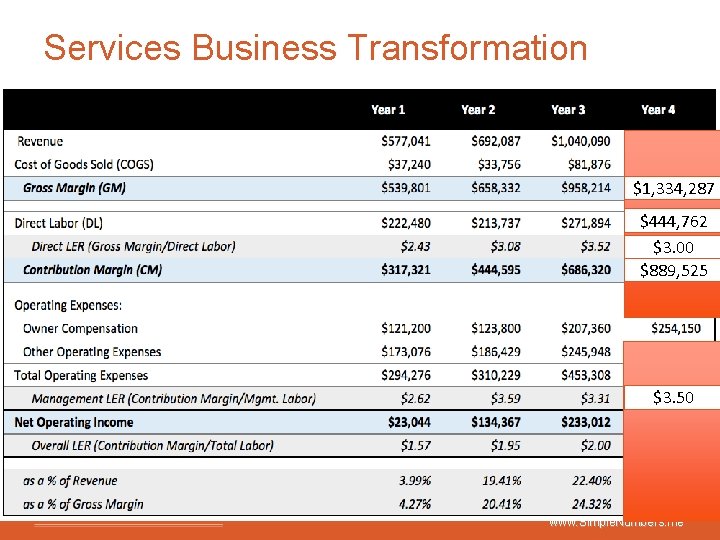
Services Business Transformation $1, 334, 287 $444, 762 $3. 00 $889, 525 $3. 50 www. Simple. Numbers. me
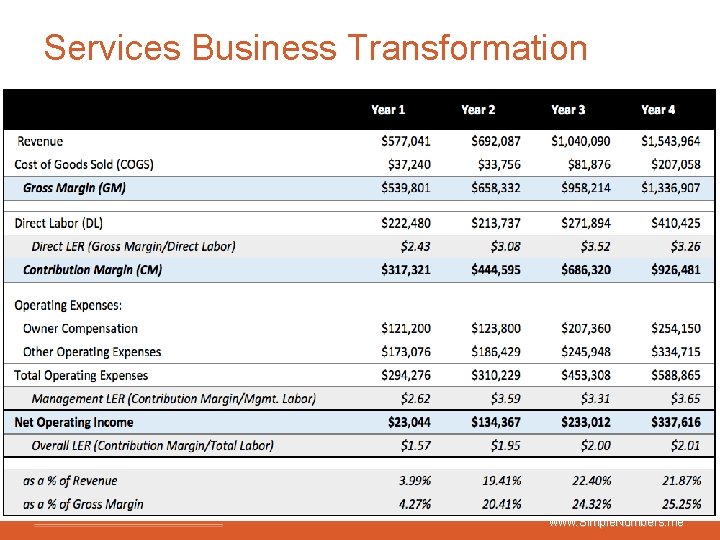
Services Business Transformation www. Simple. Numbers. me
www. Simple. Numbers. me
Bottom Up Targeting § Determine the amount of Management labor dollars you plan to spend for your team § Set the MLER target (usually between $3. 5 and $4) § Determine Contribution Margin (MLER times Management Labor) § Determine Direct Labor by taking Contribution Margin divided by DLER minus $1(CM/(DLER-1)) § Determine Gross Margin target by adding Direct Labor and Contribution Margin. www. Simple. Numbers. me
Ways To Improve Direct LER § Do you have the “right” people? Any bad apples? § Can you provide training to improve productivity? § Are you selling stuff that you do well? § Do you have the “right” clients? § Can management do a better job of “managing? ” § Are you paying people the appropriate wage? § Do all employees know their productivity level and how they can improve it? www. Simple. Numbers. me
Ways To Improve Management LER § Communicate the Contribution Margin target that justifies Management Team comp. § No “Cousin Eddie” roles § Build Management Team one key hire at a time § Evaluate “blended roles” so that management is not staying “busy” with low value roles to avoid the high value tasks § Invest in training, daily huddles and feedback processes www. Simple. Numbers. me
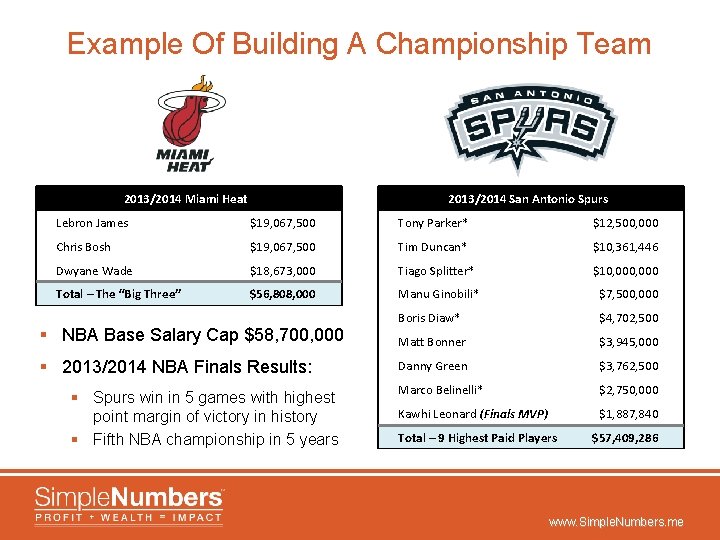
Example Of Building A Championship Team 2013/2014 Miami Heat 2013/2014 San Antonio Spurs Lebron James $19, 067, 500 Tony Parker* $12, 500, 000 Chris Bosh $19, 067, 500 Tim Duncan* $10, 361, 446 Dwyane Wade $18, 673, 000 Tiago Splitter* $10, 000 Total – The “Big Three” $56, 808, 000 Manu Ginobili* $7, 500, 000 Boris Diaw* $4, 702, 500 Matt Bonner $3, 945, 000 Danny Green $3, 762, 500 Marco Belinelli* $2, 750, 000 Kawhi Leonard (Finals MVP) $1, 887, 840 $57, 409, 286 § NBA Base Salary Cap $58, 700, 000 § 2013/2014 NBA Finals Results: § Spurs win in 5 games with highest point margin of victory in history § Fifth NBA championship in 5 years Total – 9 Highest Paid Players www. Simple. Numbers. me
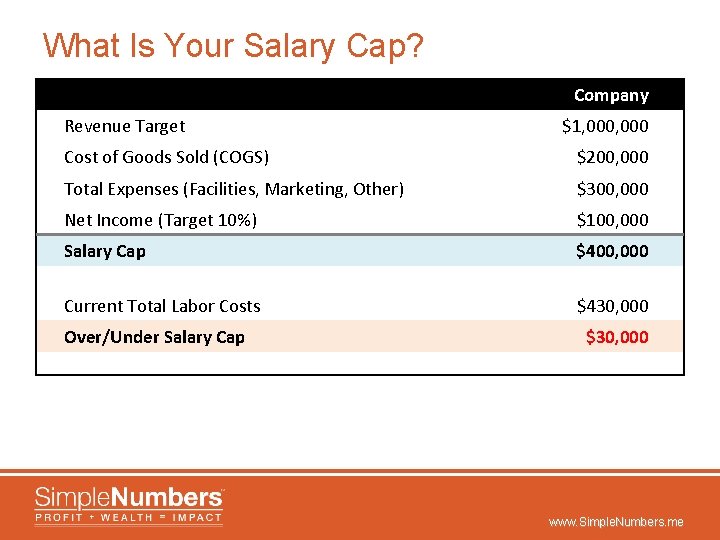
What Is Your Salary Cap? Company $1, 000 Cost of Goods Sold (COGS) $200, 000 Total Expenses (Facilities, Marketing, Other) $300, 000 Net Income (Target 10%) $100, 000 Salary Cap Current Total Labor Costs $400, 000 $430, 000 $30, 000 Revenue Target Over/Under Salary Cap www. Simple. Numbers. me
Sales Labor Efficiency Ratio (Subset of Management Labor) Your Sales Labor has one primary goal: “Sell the stuff we do best. ” §Not all revenue is created equal §Base sales incentives on Contribution Margin §View Direct LER by client to find patterns Contribution Margin Sales LER = Sales Labor www. Simple. Numbers. me
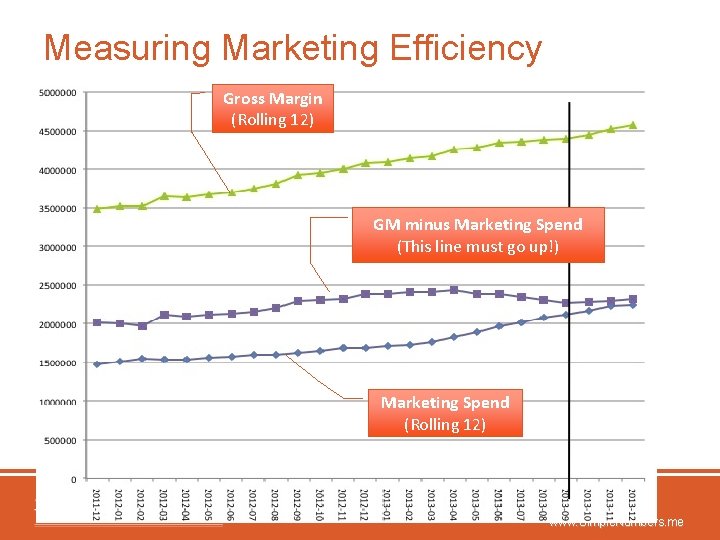
Measuring Marketing Efficiency Gross Margin (Rolling 12) GM minus Marketing Spend (This line must go up!) Marketing Spend (Rolling 12) www. Simple. Numbers. me
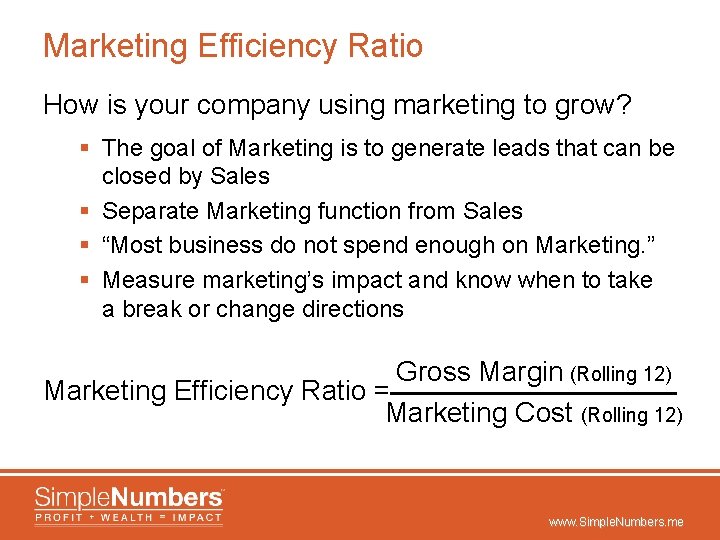
Marketing Efficiency Ratio How is your company using marketing to grow? § The goal of Marketing is to generate leads that can be closed by Sales § Separate Marketing function from Sales § “Most business do not spend enough on Marketing. ” § Measure marketing’s impact and know when to take a break or change directions Gross Margin (Rolling 12) Marketing Efficiency Ratio = Marketing Cost (Rolling 12) www. Simple. Numbers. me
#2: Labor Productivity – Action Items q Track Direct Labor Costs separate of other costs q Use Direct LER to measure and manage productivity for individuals, team, segments, and clients q Identify and manage to a “Salary Cap” q Use Management LER to measure and manage admin staff q Use Sales LER to measure and manage sales team q Measure Marketing Efficiency www. Simple. Numbers. me

3 Year Planning Template Start with the Big Picture Before Getting Bogged Down in the Details www. Simple. Numbers. me
3 Year Template Process § Summarize P&L into Simple Numbers. TM Format § Labor § Identify who is Direct Labor, by default, everyone else is in Management Labor § Do not split people “a butt in a bucket” § Salespeople are generally management labor unless “selling” is your primary activity § Review LER for last 3 years and look for “best performance periods www. Simple. Numbers. me
3 Year Template Process- Continued § Forecast P&L § Top Down Method § Set Revenue, GM targets § Set DLER & MLER targets to then determine salary cap for both labor buckets § Bottom Up Method § Set Management Labor $ § Determine Contribution Margin $ Target § Set Direct LER at rate needed to cover current Direct Labor levels www. Simple. Numbers. me
3 Year Template Process- Continued § Forecast Operating Expenses § Facilities – input from historical. Typically includes rent, utilities, repairs, telecommunications, IT § Marketing – control as a % of sales (below P&L in highlighted area § Payroll taxes and benefits – avoid combining with Labor, control as a % of all labor in highlighted area § Other Operating Expenses – the “Great Catchall” – all the noise but little you can really do about it. Forecast it as a % of Contribution Margin based on history. www. Simple. Numbers. me
3 Year Template Process- Continued § Balance Sheet § Limited to the items that really matter § Inventory – put in Other Assets if you have Inventory § Forecast § A/R DSO – input days sales outstanding to drive A/R balances § Profit Distributions – only include the distributions that are not for tax coverage § Taxes – Taxes have been accounted for as “Tax Distributions”. If you pay taxes inside the company, it should represent a similar amount. www. Simple. Numbers. me
Communicating Compensation How talk about compensation drives what you get. www. Simple. Numbers. me
What drives performance? Teams with unequal pay won fewer games when pay differences were not connected to performance. But they won more games when differences in pay were based on players’ contributions. Equity matters more than equality. Differences in pay aren’t a problem as long as they’re fair. When players are paid less than teammates who aren’t performing any better, jealousy, resentful, and discouragement often follow. When they’re paid less than teammates who deliver more value, they understand. Source: Adam Grant is a Wharton professor and the bestselling author of Give and Take. Sign up for his free newsletter at www. giveandtake. com www. Simple. Numbers. me
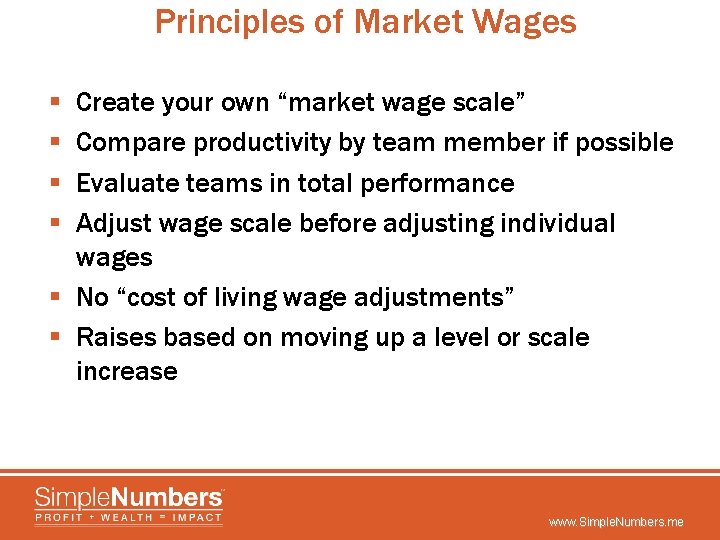
Principles of Market Wages Create your own “market wage scale” Compare productivity by team member if possible Evaluate teams in total performance Adjust wage scale before adjusting individual wages § No “cost of living wage adjustments” § Raises based on moving up a level or scale increase § § www. Simple. Numbers. me
Career Labor Efficiency Curve
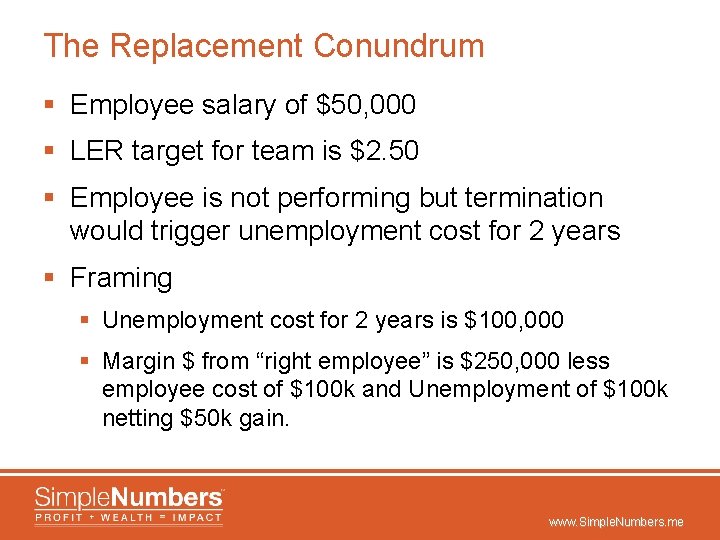
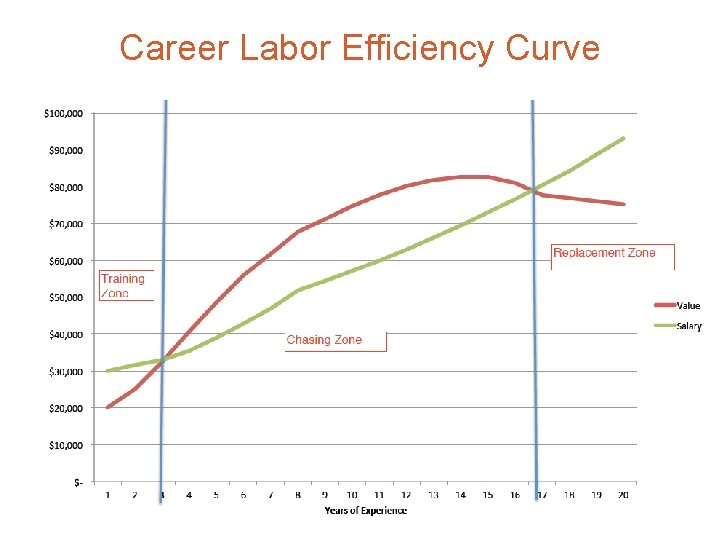
The Replacement Conundrum § Employee salary of $50, 000 § LER target for team is $2. 50 § Employee is not performing but termination would trigger unemployment cost for 2 years § Framing § Unemployment cost for 2 years is $100, 000 § Margin $ from “right employee” is $250, 000 less employee cost of $100 k and Unemployment of $100 k netting $50 k gain. www. Simple. Numbers. me
Incentive Compensation Incentive pay will never get you out of management and leadership of your team. Make sure your incentives are grounded in principles and ties to company output in a win/win. www. Simple. Numbers. me
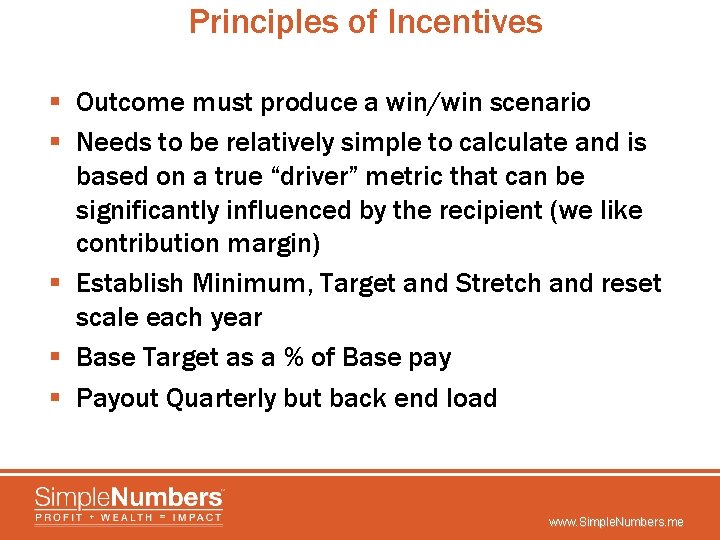
Principles of Incentives § Outcome must produce a win/win scenario § Needs to be relatively simple to calculate and is based on a true “driver” metric that can be significantly influenced by the recipient (we like contribution margin) § Establish Minimum, Target and Stretch and reset scale each year § Base Target as a % of Base pay § Payout Quarterly but back end load www. Simple. Numbers. me
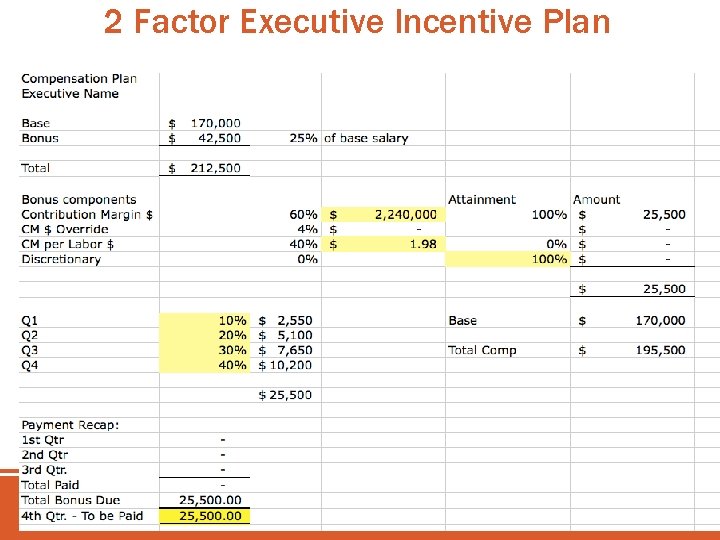
2 Factor Executive Incentive Plan www. Simple. Numbers. me
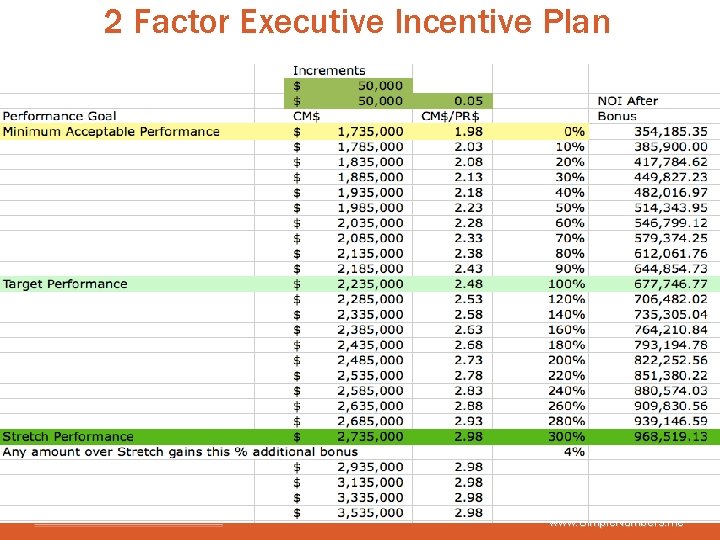
2 Factor Executive Incentive Plan www. Simple. Numbers. me
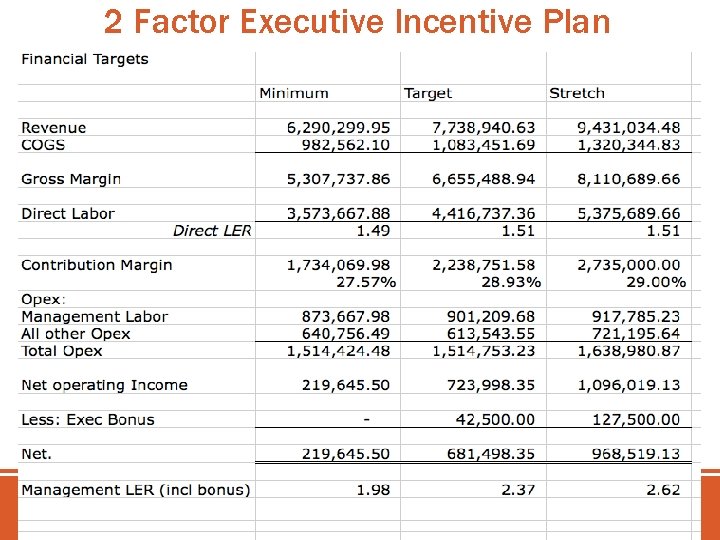
2 Factor Executive Incentive Plan www. Simple. Numbers. me
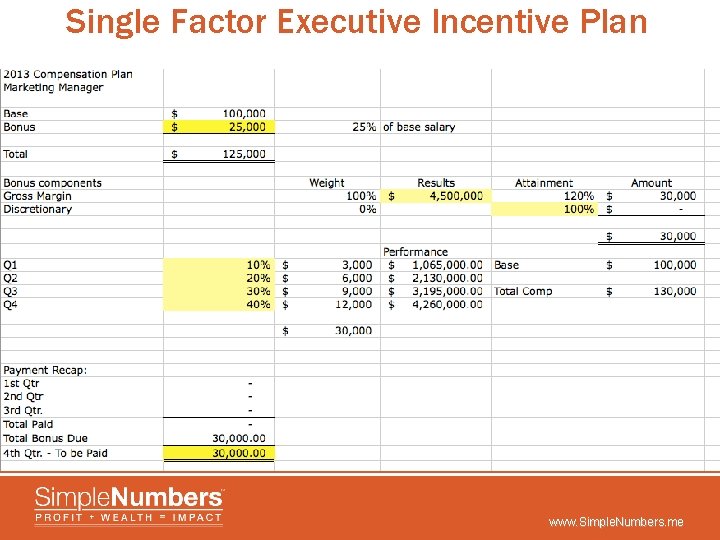
Single Factor Executive Incentive Plan www. Simple. Numbers. me
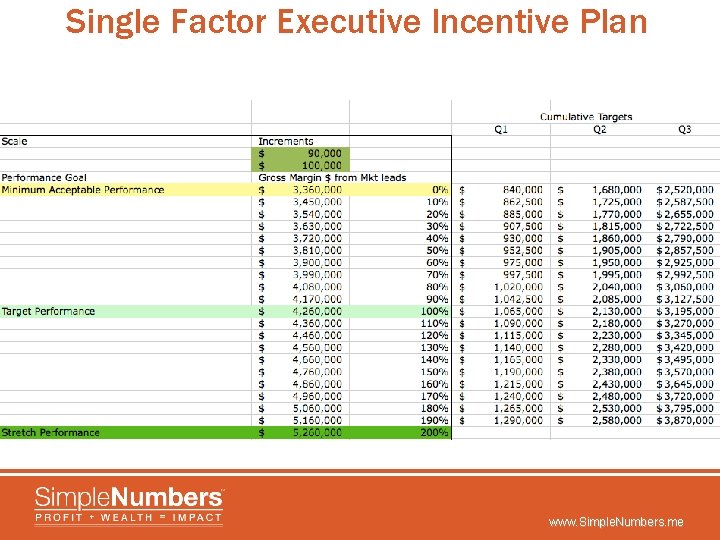
Single Factor Executive Incentive Plan www. Simple. Numbers. me
Owner Participation 1. Owners should only participate in incentive plans when 1. There are multiple owners that work in the business that each have different roles 2. There are outside investors who do not work in the business 3. You want to participate with other executive team members who are not owners 2. Don’t do an incentive thinking it will change your performance. www. Simple. Numbers. me

Michael Boggs Michael. Boggs@crbcpa. net 256 -704 -0620
- Slides: 55