Slide 2007 by Hsieh PaoNuan NOT for share
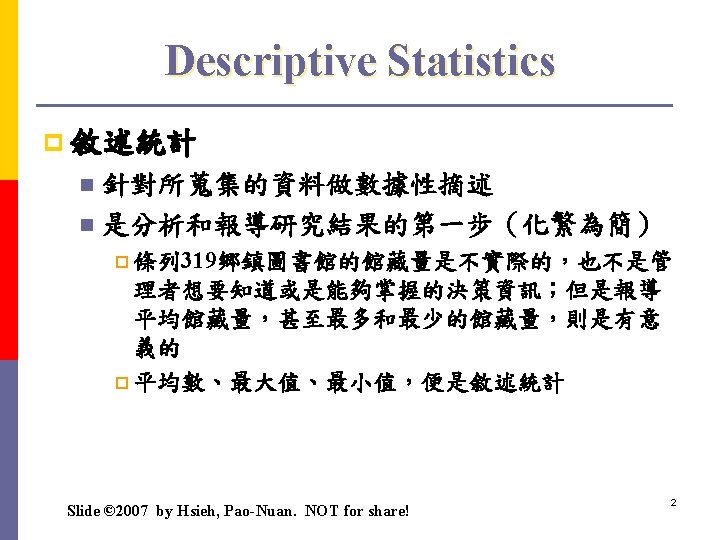

集中量數之測量特性與比較 Slide © 2007 by Hsieh, Pao-Nuan. NOT for share! 5

離散量數之測量特性與比較 Slide © 2007 by Hsieh, Pao-Nuan. NOT for share! 6

Reporting Percentages 8

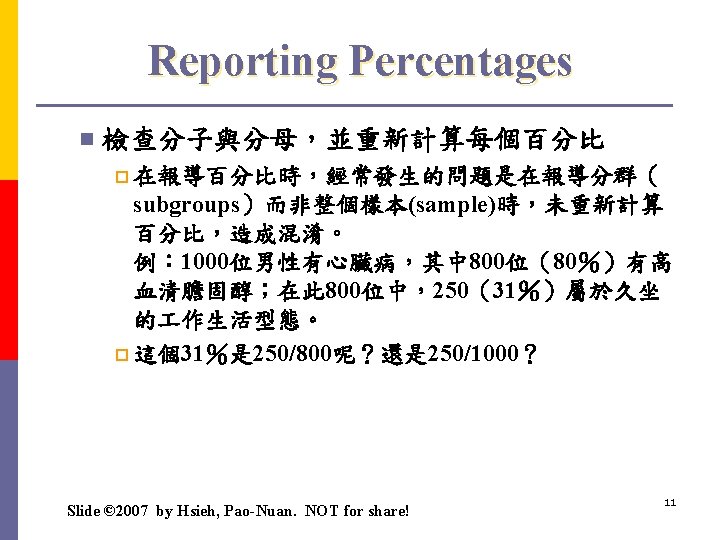
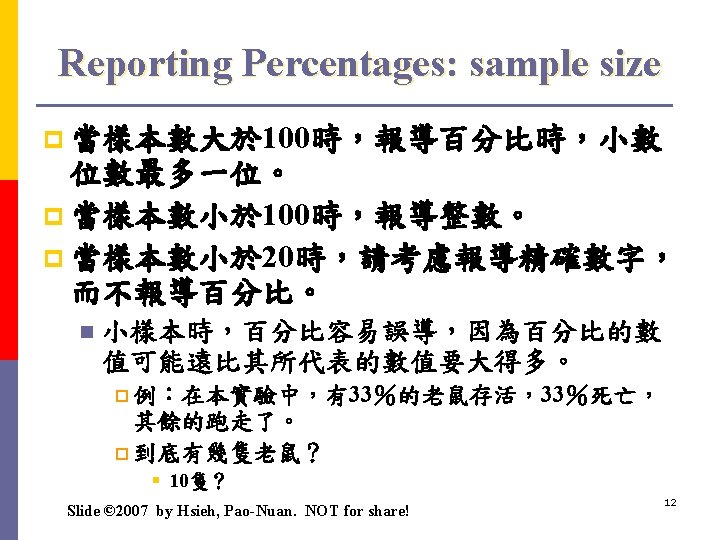
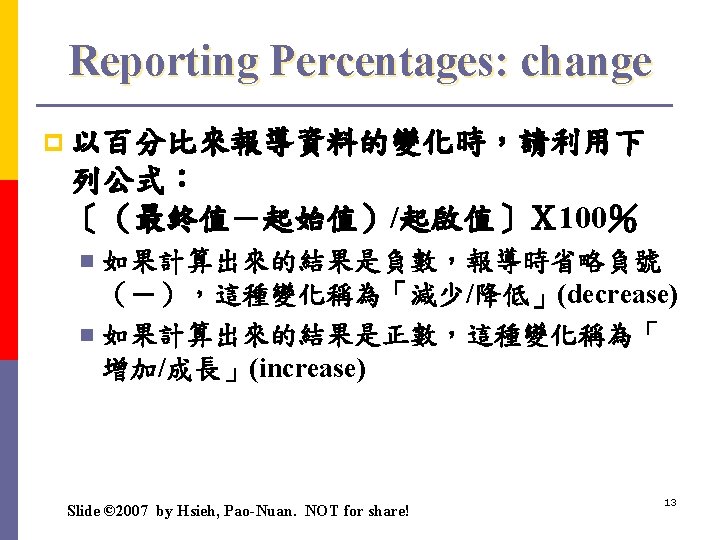
Reporting Percentages p 當報導百分比時,永遠提供計算的分子與 分母。 百分比的好處是讓不同大小的群組可以在共通 的基礎下做比較;缺點是如果只提供百分比, 資訊不足,無法了解比較群組規模。 n 例,有20%的病患治療成功,是五位中有一位 成功,還是 5000位中有1000位成功? n Lang, T. A. , & Secic, M. (1997). How to report statistics in medicine: Annotated guidelines for authors, editors, and reviewers. Philadelphia: American College of Physicians. 【Medical Library WA 950 L 269 1997】 Slide © 2007 by Hsieh, Pao-Nuan. NOT for share! 9
 p 33%(30 of 90 patients) 33%(90位病患中有30位)…… p")
Reporting Percentages n 百分比與分子分母可以分別以圓括弧的方式呈 現,如: p 25%(650/2498) p 33%(30 of 90 patients) 33%(90位病患中有30位)…… p 12 of 16 rabbits (75%) 16隻兔子中有12隻(75%)…… Slide © 2007 by Hsieh, Pao-Nuan. NOT for share! 10
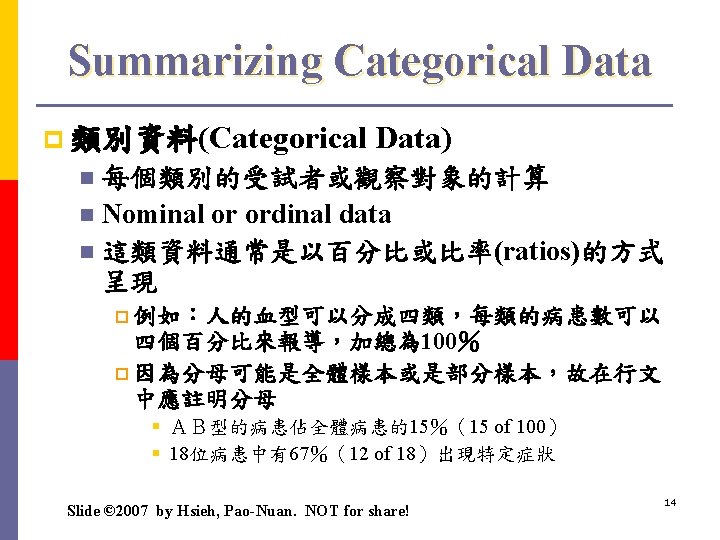

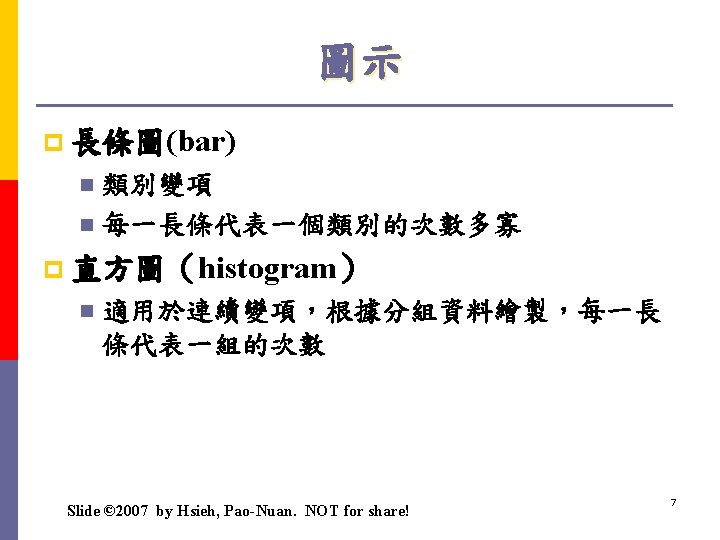
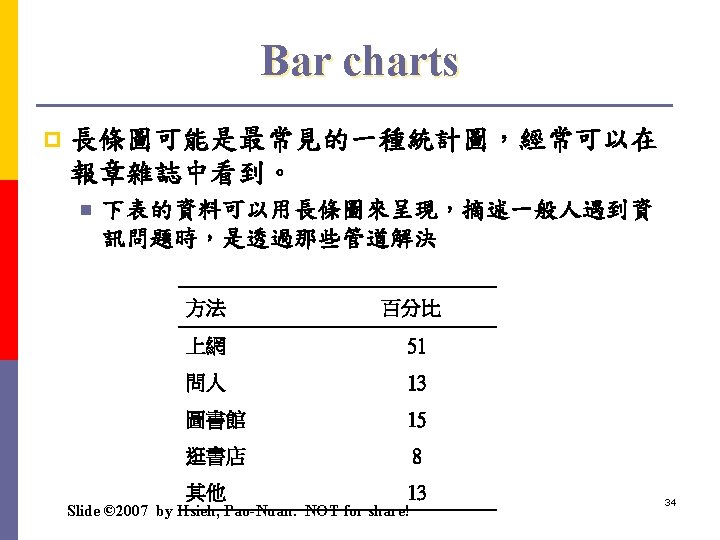
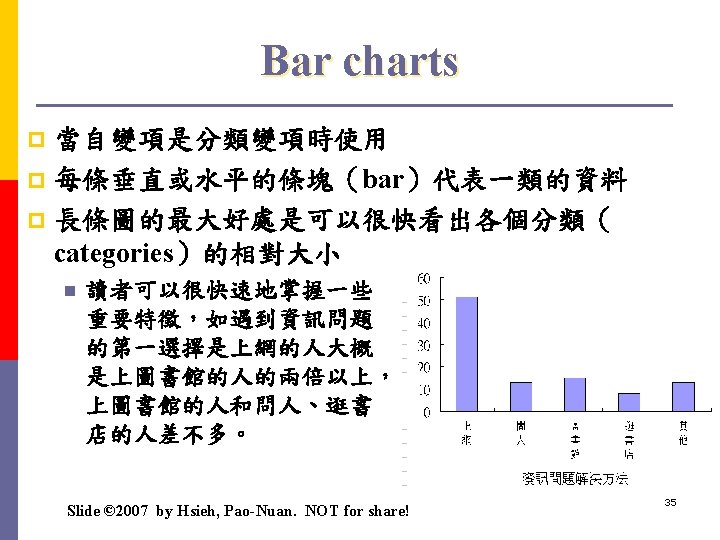
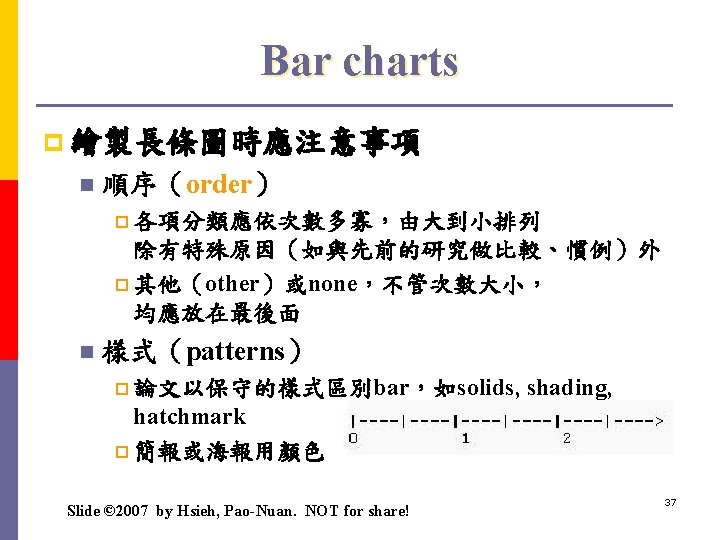
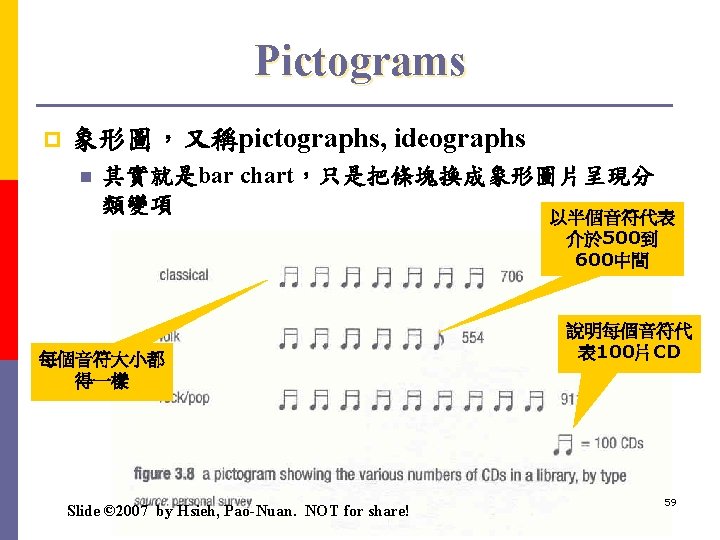
Summarizing Categorical Data p 類別資料只要在正文中摘述報導即可 p 分類項目夠大時,始需以bar or column chart呈現 Slide © 2007 by Hsieh, Pao-Nuan. NOT for share! 15

Slide © 2007 by Hsieh, Pao-Nuan. NOT for share! 16
:資料聚落的趨勢 mean p Median p mode p")
Summarizing Continuous Data p 提供趨中性和分散度的適當統計量 n 趨中性(central tendency):資料聚落的趨勢 mean p Median p mode p n 分散度(dispersion):資料分散的情況 p n n Standard deviation, range, interquartile range 常態分配(normal distribution)報導平均數和標準差 其他分配報導media和range或interquartile range Slide © 2007 by Hsieh, Pao-Nuan. NOT for share! 19

Slide © 2007 by Hsieh, Pao-Nuan. NOT for share! 20

Slide © 2007 by Hsieh, Pao-Nuan. NOT for share! 21

Slide © 2007 by Hsieh, Pao-Nuan. NOT for share! 22

Slide © 2007 by Hsieh, Pao-Nuan. NOT for share! 23

Slide © 2007 by Hsieh, Pao-Nuan. NOT for share! 24

Summarizing Continuous Data p 各種分配均可採用 Box plots n Dot charts n 報導統計量 n p Mean/median p standard deviation p interquartile range p 90%tp 10% range p outlying values Slide © 2007 by Hsieh, Pao-Nuan. NOT for share! 25

Box plot Slide © 2007 by Hsieh, Pao-Nuan. NOT for share! 26

Dot chart Slide © 2007 by Hsieh, Pao-Nuan. NOT for share! 27

Outline p Line Graphs p Histograms p Bar charts p Stemplots p Pie charts p Scattergraphs p Pictograms p Time graphs Slide © 2007 by Hsieh, Pao-Nuan. NOT for share! 29
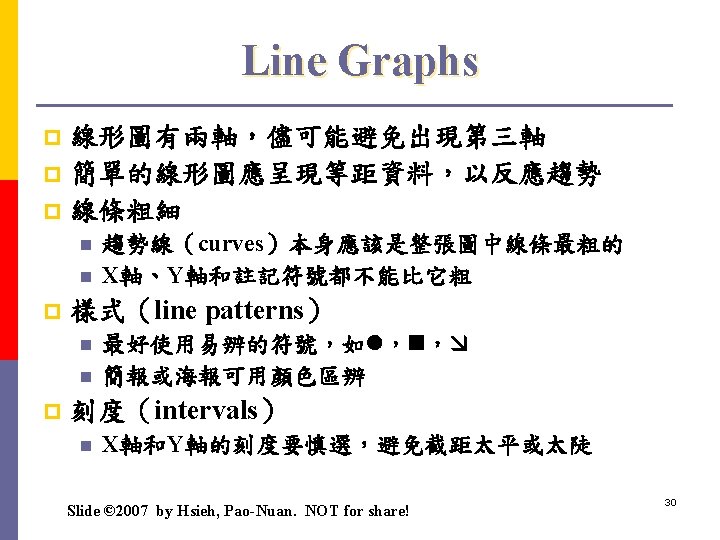

Line Graphs Slide © 2007 by Hsieh, Pao-Nuan. NOT for share! 31

Line Graphs: Length of intervals 圖只能拉對角,不能拉長寬 Slide © 2007 by Hsieh, Pao-Nuan. NOT for share! 32

Outline p Line Graphs p Histograms p Bar charts p Stemplots p Pie charts p Scattergraphs p Pictograms p Time graphs Slide © 2007 by Hsieh, Pao-Nuan. NOT for share! 33

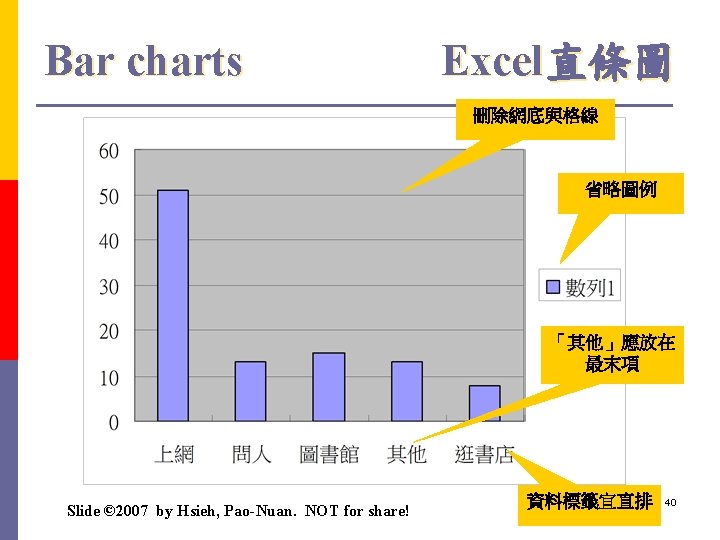
Bar charts Excel直條圖 % Slide © 2007 by Hsieh, Pao-Nuan. NOT for share! 38

Bar charts Excel直條圖 % Slide © 2007 by Hsieh, Pao-Nuan. NOT for share! 39
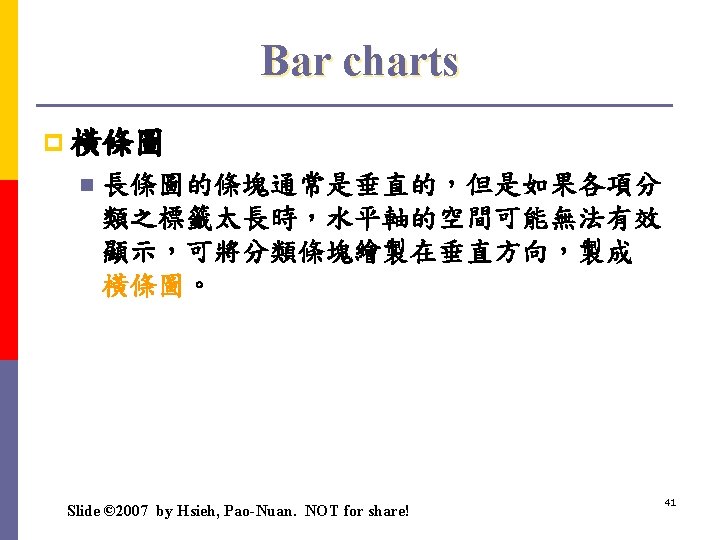

Bar charts Excel橫條圖 % Slide © 2007 by Hsieh, Pao-Nuan. NOT for share! 42
 有時長條圖的畫法是將兩三個條塊群組在一起, 方便比較 n 應加上圖例(legend)說明各組條塊所代表的意義 n Slide")
Bar charts p 群組長條圖(compound or multiple bar chart) 有時長條圖的畫法是將兩三個條塊群組在一起, 方便比較 n 應加上圖例(legend)說明各組條塊所代表的意義 n Slide © 2007 by Hsieh, Pao-Nuan. NOT for share! 43

Slide © 2007 by Hsieh, Pao-Nuan. NOT for share! 44

Bar charts 群組長條圖 Slide © 2007 by Hsieh, Pao-Nuan. NOT for share! 45
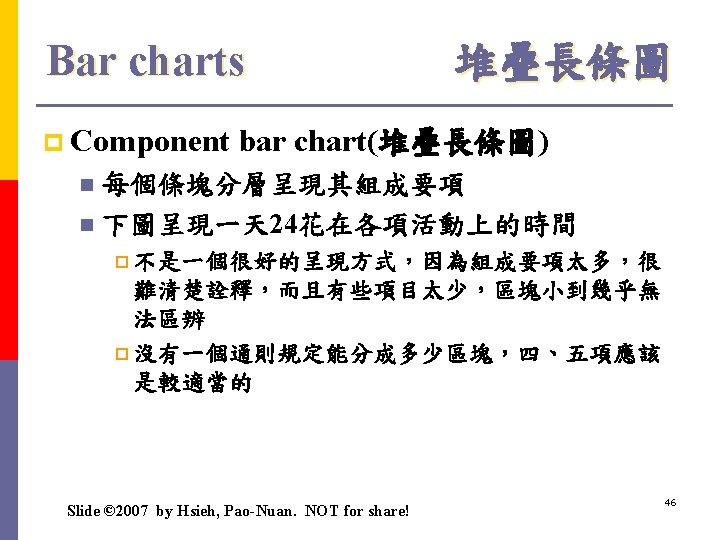

Bar charts 堆疊長條圖 Slide © 2007 by Hsieh, Pao-Nuan. NOT for share! 47

Bar charts p sliding bar chart n 插入橫線做為比較的參考點,例如小於零和大 於零的關係。 Slide © 2007 by Hsieh, Pao-Nuan. NOT for share! 48

Slide © 2007 by Hsieh, Pao-Nuan. NOT for share! 49

Outline p Line Graphs p Histograms p Bar charts p Stemplots p Pie charts p Scattergraphs p Pictograms p Time graphs Slide © 2007 by Hsieh, Pao-Nuan. NOT for share! 50

圓餅圖製作規範 Slide © 2007 by Hsieh, Pao-Nuan. NOT for share! 52

圓餅圖製作規範 Slide © 2007 by Hsieh, Pao-Nuan. NOT for share! 53

Slide © 2007 by Hsieh, Pao-Nuan. NOT for share! 54

Slide © 2007 by Hsieh, Pao-Nuan. NOT for share! 55

Slide © 2007 by Hsieh, Pao-Nuan. NOT for share! 56

Slide © 2007 by Hsieh, Pao-Nuan. NOT for share! 57

Outline p Line Graphs p Histograms p Bar charts p Stemplots p Pie charts p Scattergraphs p Pictograms p Time graphs Slide © 2007 by Hsieh, Pao-Nuan. NOT for share! 58

Outline p Line Graphs p Histograms p Bar charts p Stemplots p Pie charts p Scattergraphs p Pictograms p Time graphs Slide © 2007 by Hsieh, Pao-Nuan. NOT for share! 61

各個年齡層的婦女生小孩的情況 Slide © 2007 by Hsieh, Pao-Nuan. NOT for share! 63
 p n 例:年齡,五歲一個群組 Equal class interval vs. unequal")
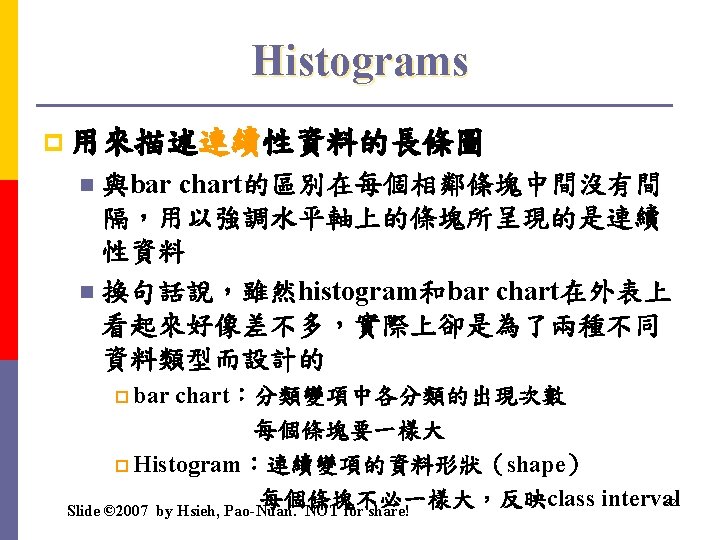
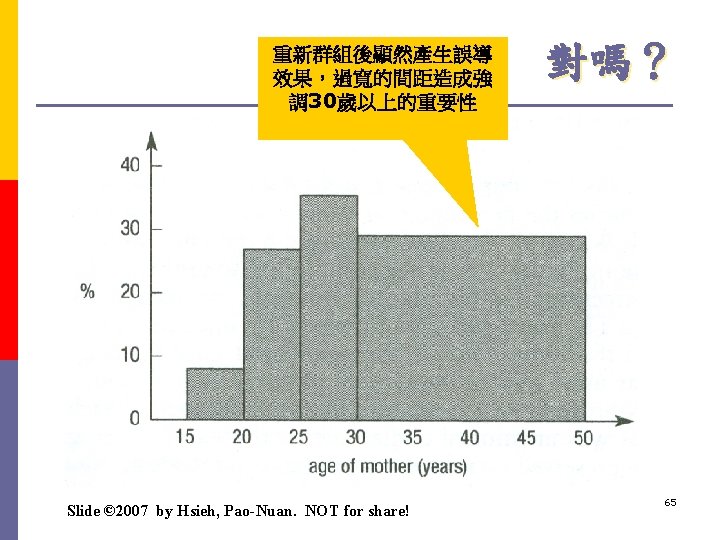
Histograms p Class interval n 資料群組的間距(intervals) p n 例:年齡,五歲一個群組 Equal class interval vs. unequal class interval 原始資料蒐集時即為不等距 p 合併兩個相鄰群組間距始變成不等距 p § 將30歲以上全併為一個群組 母親的年齡 次數(%) 15 -19 8. 2 20 -24 26. 9 25 -29 35. 4 30 -49 29. 6 Slide © 2007 by Hsieh, Pao-Nuan. NOT for share! 64

Histograms Slide © 2007 by Hsieh, Pao-Nuan. NOT for share! 66

Outline p Line Graphs p Histograms p Bar charts p Stemplots p Pie charts p Scattergraphs p Pictograms p Time graphs Slide © 2007 by Hsieh, Pao-Nuan. NOT for share! 67
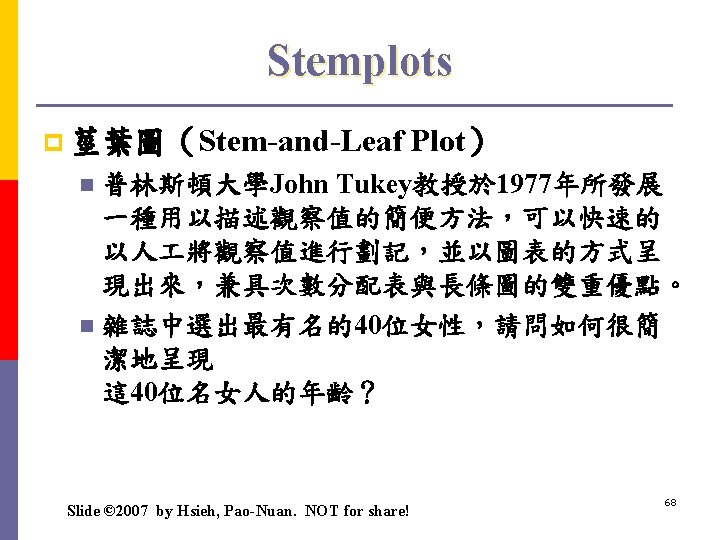

這行是葉 這行是莖 AGE Stem-and-Leaf Plot Frequency 這列是次數 可以快速得 知這 40位名 女生,以 50 幾歲的佔最 多數,共有 14位,其次 是 60幾歲的 8位和40幾 歲的7位。 Stem & Leaf 這列讀做: 29 1. 00 2. 9 2. 00 3. 26 這列讀做: 32, 36 7. 00 4. 1256778 14. 00 5. 01223345555889 8. 00 6. 01236678 這列讀做: 70, 4. 00 7. 0247 72, 74, 77 2. 00 8. 02 2. 00 Extremes (>=98) Stem width: Each leaf: 10 1 case(s) SPSS:分析>描述性資料>預檢資料 Slide © 2007 by Hsieh, Pao-Nuan. NOT for share! 69

繪製莖葉圖 • SPSS:分析>描述性資料>預檢資料 age Slide © 2007 by Hsieh, Pao-Nuan. NOT for share! 70

繪製莖葉圖 Slide © 2007 by Hsieh, Pao-Nuan. NOT for share! 71

繪製莖葉圖 Slide © 2007 by Hsieh, Pao-Nuan. NOT for share! 72

Outline p Line Graphs p Histograms p Bar charts p Stemplots p Pie charts p Scattergraphs p Pictograms p Time graphs Slide © 2007 by Hsieh, Pao-Nuan. NOT for share! 73
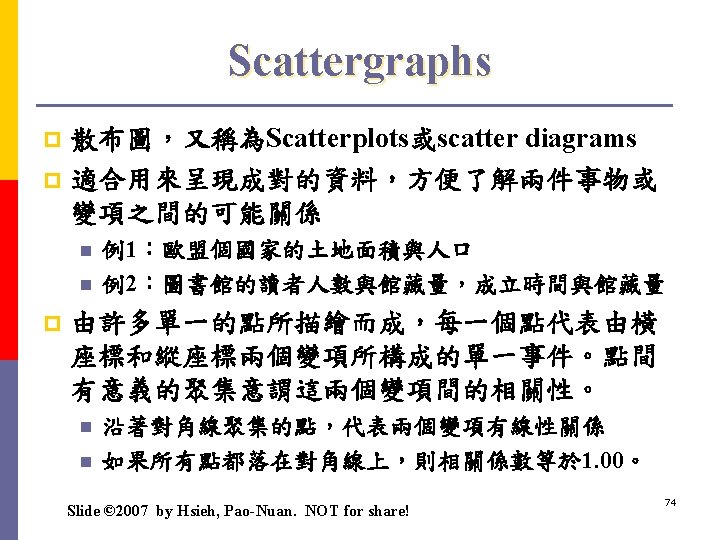

EU 12國的人口與土地 n土地面積大的國家,人口多 Slide © 2007 by Hsieh, Pao-Nuan. NOT for share! 75

Scattergraphs p 提供清晰的視覺印象,說明兩變項可能有 什麼樣的關係 p 統計意涵:regression and correlation Slide © 2007 by Hsieh, Pao-Nuan. NOT for share! 76

Outline p Line Graphs p Histograms p Bar charts p Stemplots p Pie charts p Scattergraphs p Pictograms p Time graphs Slide © 2007 by Hsieh, Pao-Nuan. NOT for share! 77

Time graphs 英國人到那些國家旅遊 Slide © 2007 by Hsieh, Pao-Nuan. NOT for share! 79

台灣人在 2001~ 2006 到香港、日本、泰國、和韓國旅遊的人數 http: //202. 39. 225. 136/statistics/File/200612/table 25_2006. pdf Slide © 2007 by Hsieh, Pao-Nuan. NOT for share! 80

台灣人在 2001~ 2006 到香港、日本、泰國、和韓國旅遊的人數 http: //202. 39. 225. 136/statistics/File/200612/table 25_2006. pdf Slide © 2007 by Hsieh, Pao-Nuan. NOT for share! 81

Thank You! Q&A Slide © 2007 by Hsieh, Pao-Nuan. NOT for share! 82
- Slides: 80