
SKU SEGMENTATION FOR A GLOBAL RETAILER AUTHORS BRAD

SKU SEGMENTATION FOR A GLOBAL RETAILER AUTHORS: BRAD GILLIGAN, HUIPING JIN ADVISOR: EDGAR BLANCO 2/27/2021 MIT SCM Research. Fest 2014
AGENDA 1. Project Objective and Challenges 2. Overview of Data 3. Initial Analysis of Supply Chain Process and Relevant Data 4. Introduction to Neural Network Models 5. Model Performance Summary 2/27/2021 MIT SCM Research. Fest 2014 2 6. Key Insights
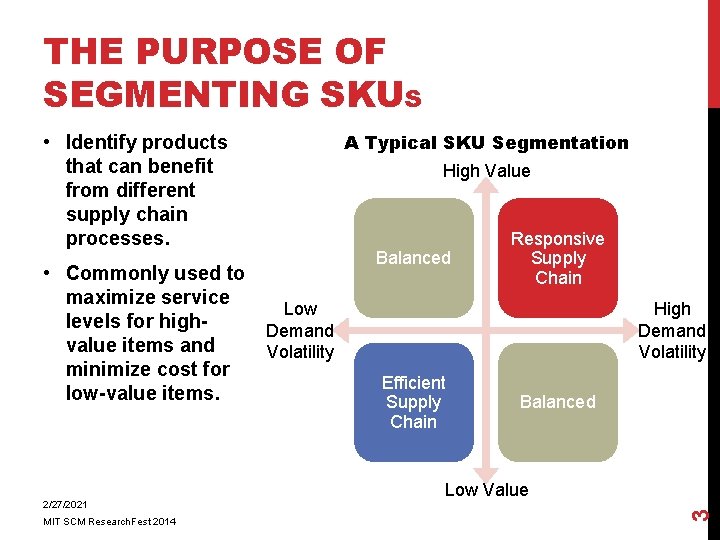
THE PURPOSE OF SEGMENTING SKUS • Commonly used to maximize service Low levels for high. Demand value items and Volatility minimize cost for low-value items. 2/27/2021 MIT SCM Research. Fest 2014 A Typical SKU Segmentation High Value Balanced Responsive Supply Chain High Demand Volatility Efficient Supply Chain Balanced Low Value 3 • Identify products that can benefit from different supply chain processes.
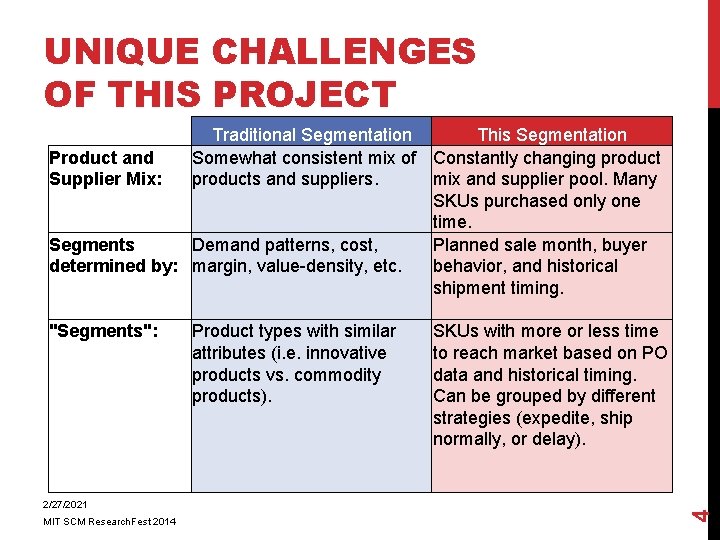
UNIQUE CHALLENGES OF THIS PROJECT Traditional Segmentation This Segmentation Product and Somewhat consistent mix of Constantly changing product Supplier Mix: products and suppliers. mix and supplier pool. Many SKUs purchased only one time. Segments Demand patterns, cost, Planned sale month, buyer determined by: margin, value-density, etc. behavior, and historical shipment timing. 2/27/2021 MIT SCM Research. Fest 2014 Product types with similar attributes (i. e. innovative products vs. commodity products). SKUs with more or less time to reach market based on PO data and historical timing. Can be grouped by different strategies (expedite, ship normally, or delay). 4 "Segments":
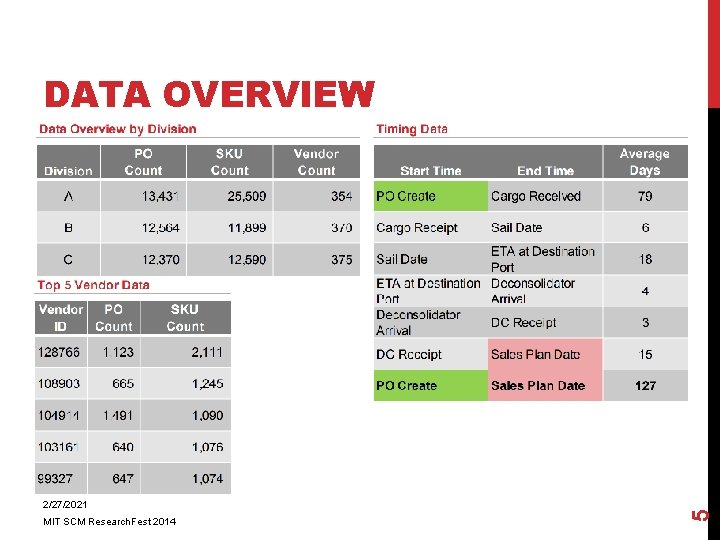
2/27/2021 MIT SCM Research. Fest 2014 5 DATA OVERVIEW
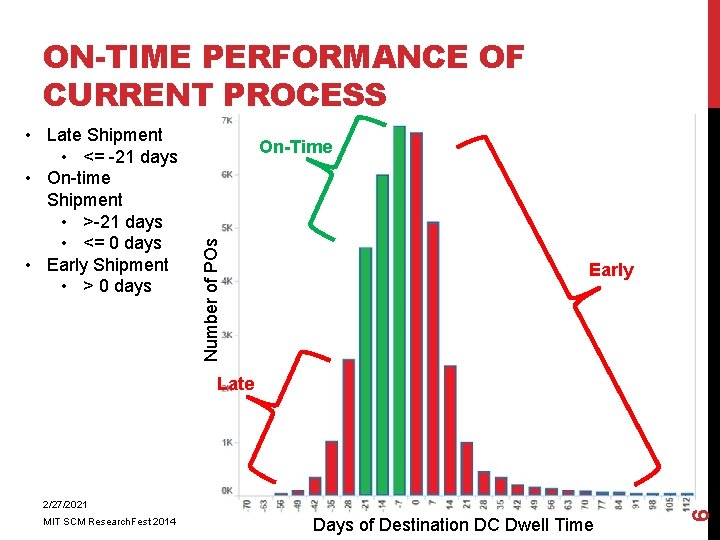
ON-TIME PERFORMANCE OF CURRENT PROCESS On-Time Number of POs • Late Shipment • <= -21 days • On-time Shipment • >-21 days • <= 0 days • Early Shipment • > 0 days Early 2/27/2021 MIT SCM Research. Fest 2014 Days of Destination DC Dwell Time 6 Late
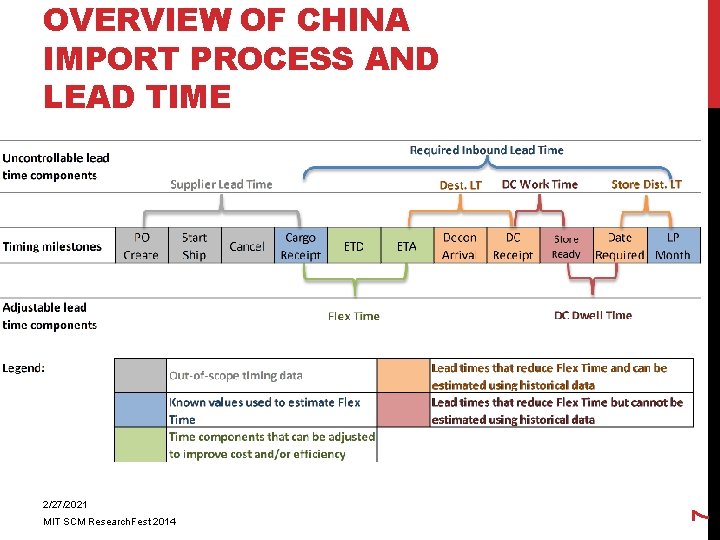
2/27/2021 MIT SCM Research. Fest 2014 7 OVERVIEW OF CHINA IMPORT PROCESS AND LEAD TIME
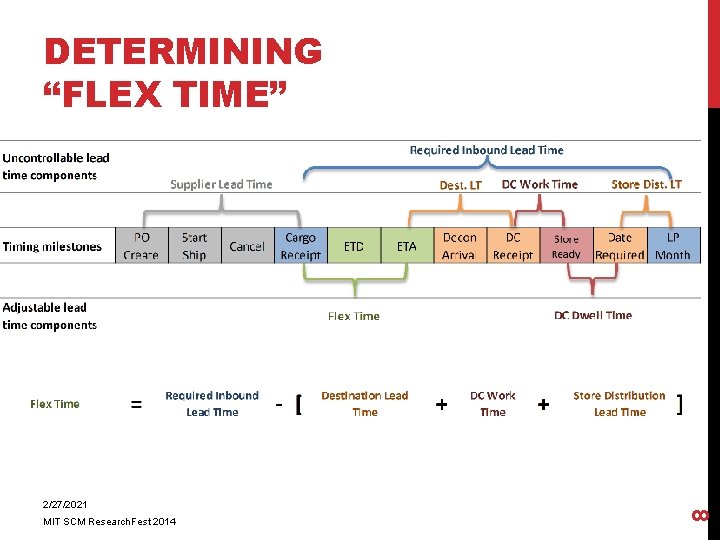
2/27/2021 MIT SCM Research. Fest 2014 8 DETERMINING “FLEX TIME”
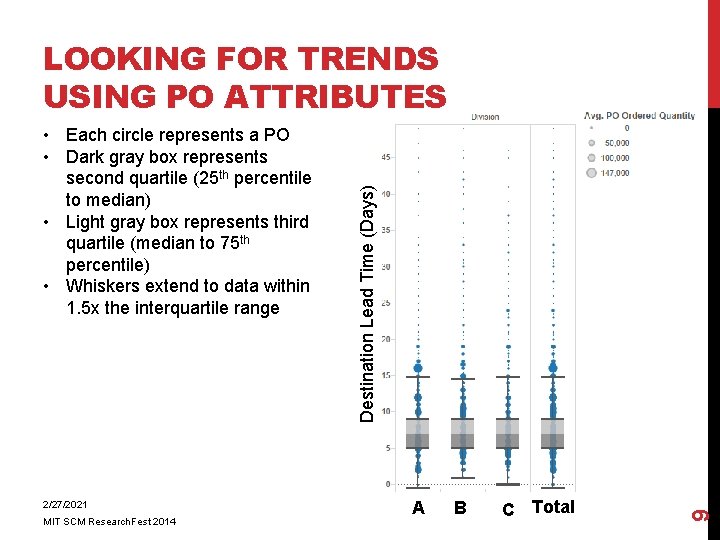
2/27/2021 MIT SCM Research. Fest 2014 A B C Total 9 • Each circle represents a PO • Dark gray box represents second quartile (25 th percentile to median) • Light gray box represents third quartile (median to 75 th percentile) • Whiskers extend to data within 1. 5 x the interquartile range Destination Lead Time (Days) LOOKING FOR TRENDS USING PO ATTRIBUTES
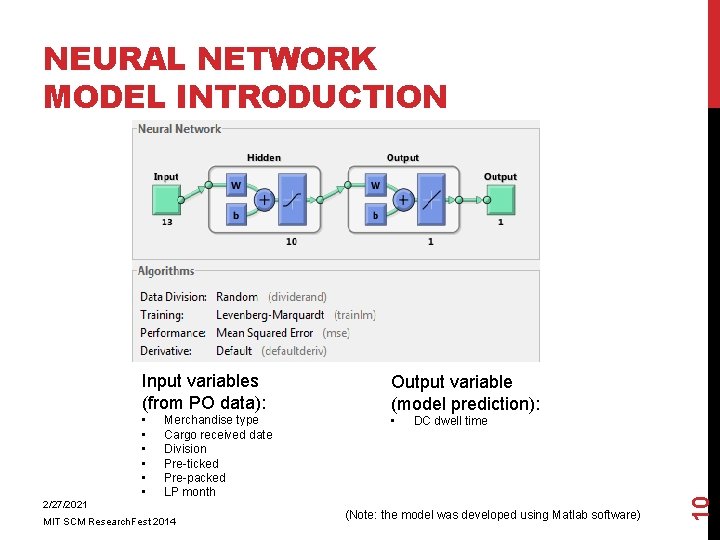
NEURAL NETWORK MODEL INTRODUCTION 2/27/2021 • • • Merchandise type Cargo received date Division Pre-ticked Pre-packed LP month MIT SCM Research. Fest 2014 Output variable (model prediction): • DC dwell time (Note: the model was developed using Matlab software) 10 Input variables (from PO data):
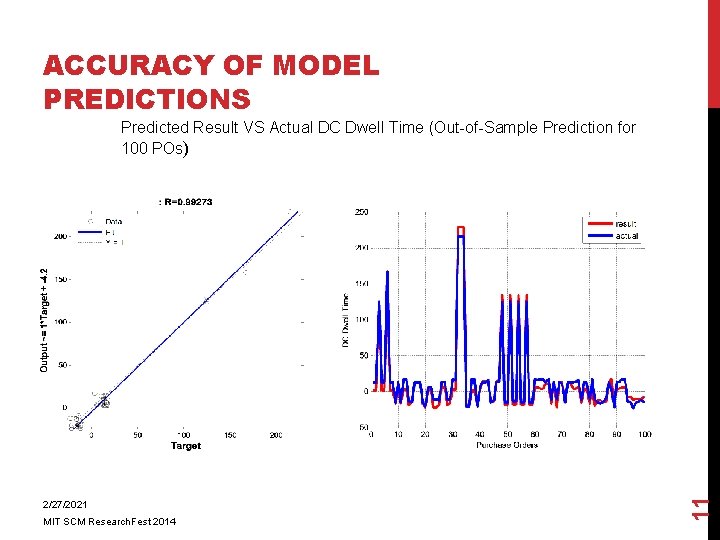
ACCURACY OF MODEL PREDICTIONS 2/27/2021 MIT SCM Research. Fest 2014 11 Predicted Result VS Actual DC Dwell Time (Out-of-Sample Prediction for 100 POs)
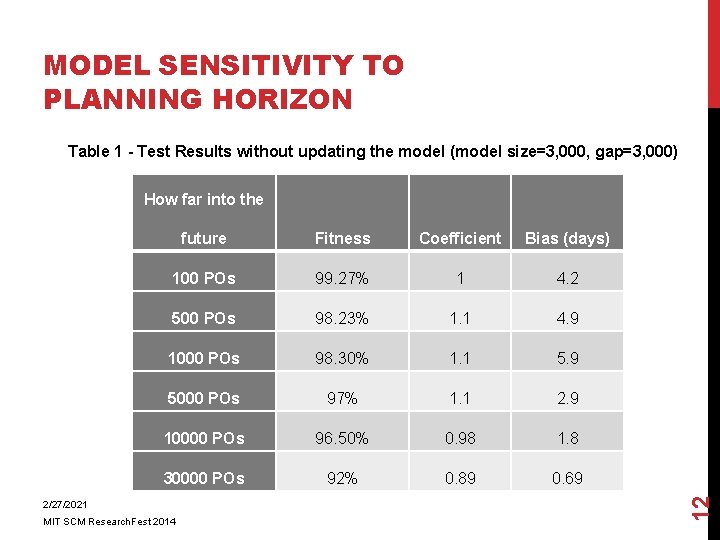
MODEL SENSITIVITY TO PLANNING HORIZON Table 1 - Test Results without updating the model (model size=3, 000, gap=3, 000) future Fitness Coefficient Bias (days) 100 POs 99. 27% 1 4. 2 500 POs 98. 23% 1. 1 4. 9 1000 POs 98. 30% 1. 1 5. 9 5000 POs 97% 1. 1 2. 9 10000 POs 96. 50% 0. 98 1. 8 30000 POs 92% 0. 89 0. 69 2/27/2021 MIT SCM Research. Fest 2014 12 How far into the
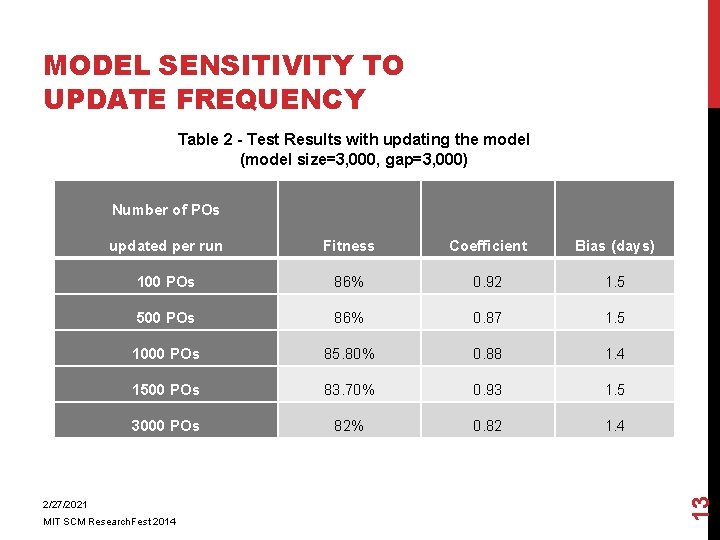
MODEL SENSITIVITY TO UPDATE FREQUENCY Table 2 - Test Results with updating the model (model size=3, 000, gap=3, 000) updated per run Fitness Coefficient Bias (days) 100 POs 86% 0. 92 1. 5 500 POs 86% 0. 87 1. 5 1000 POs 85. 80% 0. 88 1. 4 1500 POs 83. 70% 0. 93 1. 5 3000 POs 82% 0. 82 1. 4 2/27/2021 MIT SCM Research. Fest 2014 13 Number of POs
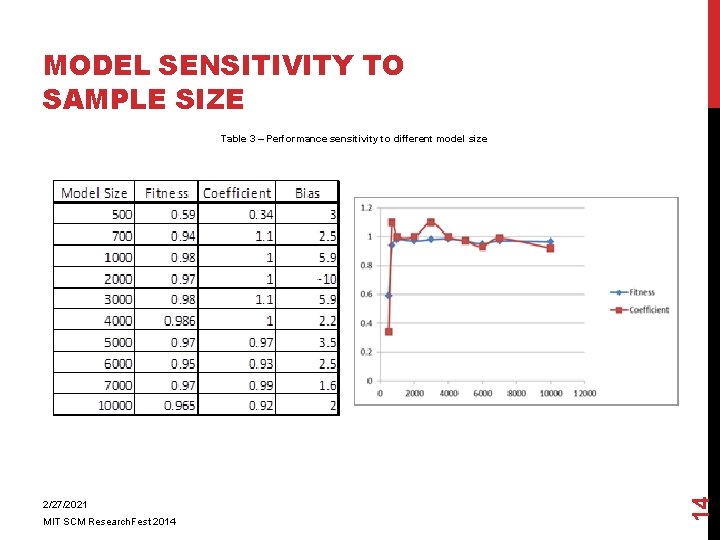
MODEL SENSITIVITY TO SAMPLE SIZE 2/27/2021 MIT SCM Research. Fest 2014 14 Table 3 – Performance sensitivity to different model size
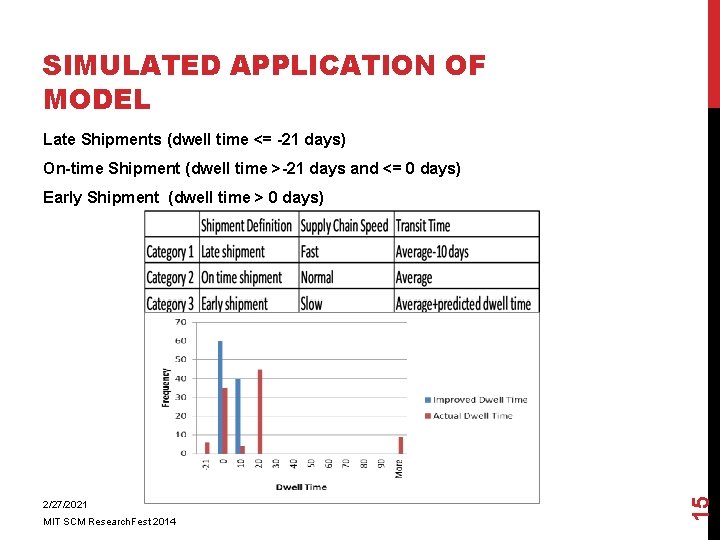
SIMULATED APPLICATION OF MODEL Late Shipments (dwell time <= -21 days) On-time Shipment (dwell time >-21 days and <= 0 days) 2/27/2021 MIT SCM Research. Fest 2014 15 Early Shipment (dwell time > 0 days)
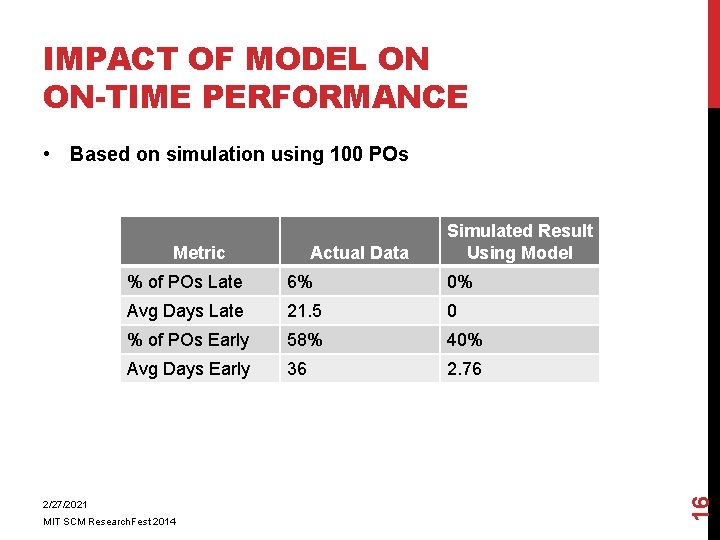
IMPACT OF MODEL ON ON-TIME PERFORMANCE • Based on simulation using 100 POs Actual Data % of POs Late 6% 0% Avg Days Late 21. 5 0 % of POs Early 58% 40% Avg Days Early 36 2. 76 2/27/2021 MIT SCM Research. Fest 2014 16 Metric Simulated Result Using Model
KEY INSIGHTS • Traditional SKU segmentation may not be appropriate for companies with constantly changing product mix. • Analysis of historical data can identify product attributes that are correlated with required supply chain speed. 2/27/2021 MIT SCM Research. Fest 2014 17 • A mathematical model can be used to predict required lead times.
- Slides: 17