Skew T Log P Diagram AOS 330 LAB

Skew T Log P Diagram AOS 330 LAB 10
 Stability Review • Critical Levels on Thermodynamic Diagram • Severe")
Outline • Static (local) Stability Review • Critical Levels on Thermodynamic Diagram • Severe Weather and Thermodynamic Diagram
 Stability Static Stability: Stability of the atmospheric layer w. r. t. small")
Static (local) Stability Static Stability: Stability of the atmospheric layer w. r. t. small vertical displacements of air parcel within the layer. Let’s consider an air parcel that has the same temperature as the environment and is at rest. Now, give it a slight push upward. As it moves upward, it adiabatically expands and cools. At the new level higher up, it could : 1) be denser than its surrounding, sink back down to its original position. (STABLE) 2) be less dense than its surrounding, continue to rise. (UNSTABLE) 3) have the same density as its surrounding, will continue to rise until it encounters enough friction to stop it. (neutral)

Absolutely Stable Parcel is unsaturated, it cools following dry adiabatic lapse rate. Γd Γm As parcel rises(sinks), it is cooler(warmer) than its environment, it would want to move back to its original position.

Absolutely Unstable Parcel is unsaturated, it cools following dry adiabatic lapse rate. Γ Γd Unstable for both saturated / unsaturated parcels. Γm Γd As parcel rises(sinks), it is warmer(cooler) than its environment, it would want to continue to rise(sinks).

Conditionally Unstable Parcel is unsaturated, it cools following dry adiabatic Γm lapse rate. Γd Parcel is saturated, it cools following moist/pseudoadiabatic lapse rate. Γm Γ Γd Stable when parcel is unsaturated. Unstable when parcel is saturated.

Γ Neutral Saturated neutral Dry neutral Γm Potentially Stable Potentially Unstable Stable Neutral Unstable

Atmospheric Soundings Plotted Thermodynamic Diagram • • To determine what atmospheric processes may undergo. Help us to identify clouds Allow us to identify stability of a layer Identify critical levels and to determine at which levels the parcel would be saturated and/or buoyant. • The level at which the parcel is saturated depends on both its moisture content and the processes that an atmosphere is going though.

The information on diagrams will allow us to determine things such as: • CAPE (Convective Available Potential Energy) • CIN (Convective INhibition) • DCAPE (Downdraft Convective Available Potential Energy) • Maximum updraft speed in a thunderstorm • Hail size • Height of overshooting tops • Layers at which clouds may form due to various processes, such as: – Lifting – Surface heating – Turbulent mixing

Critical Levels on Thermodynamic Diagram
 • The level at which a parcel lifted dry adiabatically")
Lifting Condensation Level (LCL) • The level at which a parcel lifted dry adiabatically will become saturated. • Find the temperature and dewpoint of the parcel (at the same level, typically the surface). Follow the mixing ratio up from the dewpoint, and follow the dry adiabat from the temperature, where they intersect is the LCL.

Finding the LCL
 • The level above which a parcel will be")
Level of Free Convection (LFC) • The level above which a parcel will be able to freely convect without any other forcing. • Find the LCL, then follow the moist adiabat until it crosses the temperature profile. • At the LFC the parcel is neutrally buoyant.

Example of LFC
 • The level above the LFC at which a parcel will")
Equilibrium Level (EL) • The level above the LFC at which a parcel will no longer be buoyant. (At this point the environment temperature and parcel temperature are the same. ) • It is a level of neutral buoyancy. • Above this level the parcel is negatively buoyant. • The parcel may still continue to rise due to accumulated kinetic energy of vertical motion. • Find the LFC and continue following the moist adiabat until it crosses the temperature profile again.

Example of finding the EL
 • Level at which the base of convective clouds will")
Convective Condensation Level (CCL) • Level at which the base of convective clouds will begin. • From the surface dew point temperature follow the mixing ratio until it crosses the temperature profile of sounding.
 • The surface temperature that must be reached for purely convective")
Convective Temperature (CT) • The surface temperature that must be reached for purely convective clouds to develop. (If the CT is reached at the surface then convection will be deep enough to form clouds at the CCL. ) • Determine the CCL, then follow the dry adiabat down to the surface.

Finding the CCL and CT
 • This represents the level at which clouds will form")
Mixing Condensation Level (MCL) • This represents the level at which clouds will form when a layer is sufficiently mixed mechanically. (i. e. due to turbulence) • To find the MCL determine the average potential temperature (q) and average mixing ratio (w) of the layer. Where the average q and average w intersect is the MCL.

Finding the MCL

Thermodynamic Diagrams and Severe Weather

What is Severe Thunderstorm? Tornado Hail > or = 3/4 inch Wind Gust > 50 knots
 • Remember: Area on a thermodynamic diagram is proportional")
Convective Available Potential Energy (CAPE) • Remember: Area on a thermodynamic diagram is proportional to energy. • CAPE on a thermodynamic diagram is the area between the parcel and the environment temperatures from the LFC to the EL • CAPE is also called buoyant energy. • CAPE is a measure of instability

CAPE

CAPE

Maximum Updraft Speed • If we convert the potential energy of CAPE to a kinetic energy, we can get the maximum speed of any updraft that may develop.
 • CIN on a thermodynamic diagram is the area between the")
Convective Inhibition (CIN) • CIN on a thermodynamic diagram is the area between the parcel and the environment temperatures from the surface to the LFC • CIN is NOT negative CAPE!!!!!! – CAPE tells us the maximum amount of energy that may be released by the parcel through ascent. – CIN tells us how much energy must be used to lift a parcel from surface to LFC. (Energy barrier) • CIN is a measure of stability • Reported as an absolute value

CIN

Overcoming Convective Inhibition • A convective outbreak rarely occurs from surface heating alone! • Triggering Mechanisms for T-Storms – – – fronts dry lines sea-breeze fronts gust fronts from other thunderstorms atmospheric bouyancy waves mountains

Cap Strength • Very important for severe weather to develop • Too little or no cap: happy little cumulus everywhere • Too strong of a cap: nothing happens • Just the right amount of a cap: Severe Weather
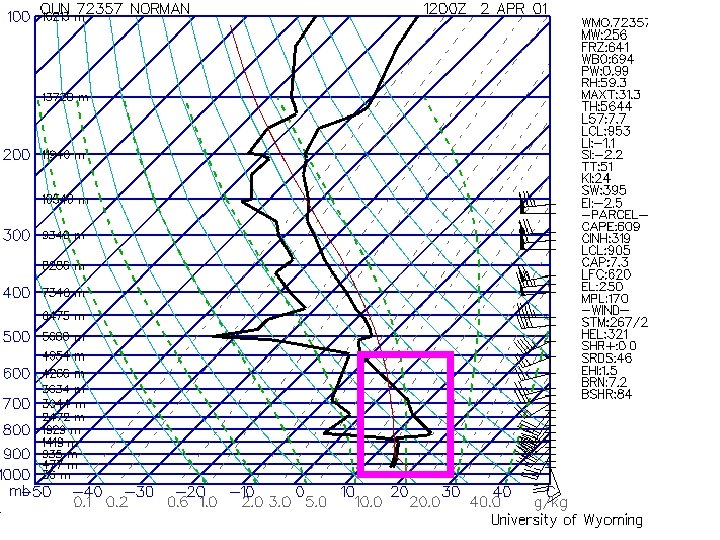

• At the inversion* look at the temperature difference between the parcel and the environment.
. A First Course in Atmospheric Thermodynamics, Sundog Publishing. •")
References • Petty, G (2008). A First Course in Atmospheric Thermodynamics, Sundog Publishing. • Potter and Coleman, 2003 a: Handbook of Weather, Climate and Water: Dynamics, Climate, Physical Meteorology, Weather Systems and Measurements, Wiley, 2003 • Links: • http: //www. spc. noaa. gov/faq • http: //www. srh. noaa. gov/oun/severewx
- Slides: 34