Sketch a graph of speed vs time for


 Horizontal Tangents?")


- Slides: 14
Sketch a graph of speed vs. time for the following situation: You are stopped at a red light on Wattles Road. When the light turns green, you accelerate to the speed limit and maintain that speed until you must slow down slightly for a car that is turning. You then accelerate back to the speed limit and travel at this constant rate until you approach a red light at Rochester Road where you come to a complete stop.
Sketch a graph of speed vs. time for the following situation: Speed in meters/second You are stopped at a red light on Wattles Road. When the light turns green, you accelerate to the speed limit and maintain that speed until you must slow down slightly for a car that is turning. You then accelerate back to the speed limit and travel at this constant rate until you approach a red light at Rochester Road where you come to a complete stop. Time in seconds
Sketch a graph of speed vs. time for the following situation: Speed in meters/second You are stopped at a red light on Wattles Road. When the light turns green, you accelerate to the speed limit and maintain that speed until you must slow down slightly for a car that is turning. You then accelerate back to the speed limit and travel at this constant rate until you approach a red light at Rochester Road where you come to a complete stop. Time in seconds
Increasing, decreasing, and constant rates of change
Increasing: Decreasing: Constant:
Extrema: Extrema occur where a line tangent to the graph is horizontal.
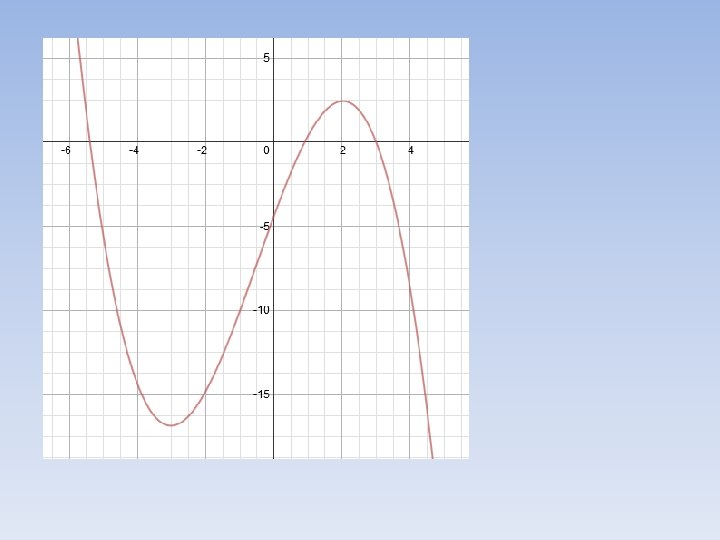
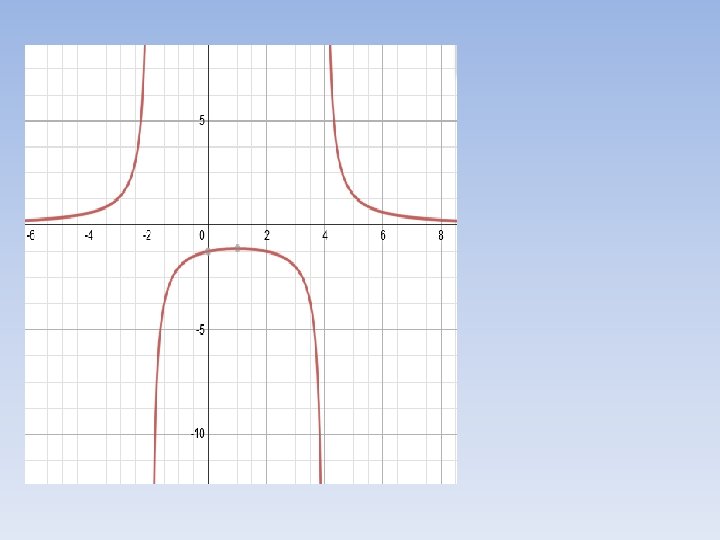
Find the intervals where the following is increasing or decreasing. Then find the extrema.
Find the intervals where the following is increasing or decreasing. Then find the extrema.
Find the intervals where the following is increasing or decreasing. Then find the extrema.
Point of Inflection (POI) Horizontal Tangents?
Critical Values: Critical values occur at: Extrema Points of inflection
HOMEWORK: Page 40: 1 – 21 odd Give the intervals of increasing, decreasing and constant rates of change. Estimate the extrema and points of inflection