SK PMT calibration and water scattering calibration S
 for the SK calibration")
SK PMT calibration and water scattering calibration S. Moriyama (ICRR) for the SK calibration group 8 th Jan. 2004 @ K 2 K meeting 1. 2. 3. 4. Timing calibration QE measurement & QE table for MC PC 2 PE table for DATA Water scattering parameters Most slides are from Oobayashi, Nambu, Koshio, and Seo
 map corrects time walk of ATM")
1. Timing calibration • TQ (timing and charge) map corrects time walk of ATM discriminators. • Just before Jan. 2003 beam, we measured TQ relation with a laser ball and installed TQ map. • After the ATM repair on Sep. 2003, we also measured TQ relation and updated. • Every time we repair several ATM boards, we correct TQ map.

Typical TQ map Earlier timing Saturation Lower charge Later timing Higher charge
 • s~2. 5 ns@1 pe • 0. 5 ns@100")
4 2 0 s (ns) • s~2. 5 ns@1 pe • 0. 5 ns@100 pe • Same level with SK-I. s (ns) Timing Resolution 10 -1 1 102 Q (p. e. ) 4 2 0 1 2 3 4 Q (p. e. ) 5

2 -1. QE measurement So far, QE measurements suggested: Top and Bottom PMTs QE has ~10% difference Barrel PMTs does not have uniform QE. What is the origin of the QE difference? (A) Magnetic fields (B) Water non uniformity (C) The origin of hit rate difference among PMTs.
 by")
Definition of “Hit rate” We can measure ( QE x col. eff. ) by counting the Number of hits from very small week Cherenkov light (Ni+Cf). This counts is almost independent of the PMT gain. We define Hit-rate as

QE measurement Hit rate distribution for SK-II Light Source 9 Me. Vγ-rays emitted form thermal neutron on Nickel. Barrel 1. 3 Slope? 252 Cf 1. 0 γ n 0. 7 -1500 Ni 1. 3 Hit rate was calculated. Ideally, This plots should be flat 0 Top 1500 Z(cm) Bottom 1. 3 1. 0 QE, Col. eff. But Magnetic Fields Water effects Light Reflection ~10% difference may affect 0. 7 0 0. 7 1000 2000 3000 × 103 0 R 2(cm 2) 1000 2000 3000 × 103 R 2(cm 2)
 Magnetic fields Measurement locations Top view. Y ID PMT structure X Absolute Magnetic")
(A) Magnetic fields Measurement locations Top view. Y ID PMT structure X Absolute Magnetic Fields (m. G) The collection efficiency is affected by the 200 geomagnetic field. It should be cancelled < 100(m. G) with the compensation coils. Calibration hole Bottom PMT position Top PMT position OD 100 ID 0 dist. to PMT~ 1. 3 m -2000 -1000 0 1000 2000 Height from the tank center (cm) In the outer detector (OD) some points give ~100 m. G but in the inner detector (ID) the magnetic field is small enough (<100 m. G) Unlikely for the origin of Top/Down asymmetry and Barrel slope
 Water non uniformity The non uniformity of water quality may affect Hit rate.")
(B) Water non uniformity The non uniformity of water quality may affect Hit rate. To make convection, we changed the temperature of supply water. Normal With convection Temperature(℃) cool water. Relative hit rate in Barrel W/ convection W/O convection Warm water. 13. 7 Z(cm) With water convection Normal state The effect is small. ~1%. 13. 6 13. 5 -20 -10 0 10 20 Z(m) Water non uniformity is not the origin of the hit rate structure.
 The origin of hit rate difference among PMTs Hamamatsu company gave the QE")
(C) The origin of hit rate difference among PMTs Hamamatsu company gave the QE data of sampled PMT in ‘ 93 -’ 97. We compare our hit rate and QE data by convoluting QE data and Cherenkov light spectrum. 1% of delivered PMTs 93 yr 94 yr 95 yr 96 yr 97 yr 20 10 Cherenkov spectrum after traveling 20 m in water 0 300 400 Cherenkov light convoluted with QE QE (%) 10~ 30 PMTs for each year 500 Wavelength (nm) There is a large difference among each year. 18 97 yr-stock 17 94 yr 16 96 yr-stock 95 yr 93 yr 15 140. 8 0. 9 1. 0 1. 1 Hit rate in SK-II Correlation can be seen 1. 2

PMT production period and their location After SK-I accident PMT distribution in SK-II Top Survived (Top) Survived (barrel) Barrel Completely broken Bottom ‘ 92 - ‘ 93 ‘ 94 - ‘ 95 ‘ 96 - ‘ 97 Stocked PMTs (have not been used yet) For deeper location, we used safer PMTs. This unexpectedly caused the non uniformity of production period inside the tank.

Relative hit rate in 4 regions Top Barrel upper PMT distribution in SK-II -2. 3% Top 0. 8 1 -3. 3% ≒ 1. 2 0. 8 1 1. 2 Barrel Bottom 92 -93 yr 4 regions 94 -95 yr 96 -97 yr Top Barrel upper Barrel lower Bottom +0. 1% 0. 8 1 1. 2 Barrel lower ≪ +7. 6% 0. 8 1 1. 2 Bottom Then what causes this production period dependence?

The origin of QE variation same structure is also seen in the hit rate of SK-II. 70 1. 3 1. 2 60 10% difference 50 40 SK-II Hit rate Transparency of glass at 310 nm (%) Hamamatsu Co. suggested the glass transparency is the origin of the variation. 1. 1 1. 0 0. 9 0. 8 30 91 92 93 94 95 96 1992 -1995 50. 78 1996 -1997 55. 95 97 98 yr The glass company made effort to improve glass transparency at short wavelength by removing iron contamination in the glass 0. 7 92 93 94 95 96 97 98 yr The glass transparency and our QE measurement has good correlation.

Conclusion for QE measurements • Magnetic field and water non uniformity are unlikely the origins of the hit rate structure. • The origin of hit rate structure is the glass transparency in each production period. Such a QE difference should be a important parameter of MC.

2 -2. QE table Motivation In order to reproduce the detector correctly, we need QE table for MC. Method Reject the effect of water, reflection etc. from Hit Rate distribution, we can get a “real” QE table. We use MC as a reference.

Hit rate distribution of all the PMT Dead tubes Each hits are corrected to ・ solid angle (distance) ・ “coseff” (acceptance) 123 PMTs are bad channel QE table value is 1. 122 PMTs All are listed as bad channel 7 PMTs One is as bad channel, others are normal including one KEK PMT

Data Top/Barrel : --1. 5% Bot /Barrel : +8. 5% Barrel ~10% Bottom Top

Data Top/Barrel : --0. 2% Bot /Barrel : +9. 8% (w/o KEK & stock PMT) ~300
")
1, 000 events Ni MC (atmpd tuned)

Data / MC This becomes “QE table” in each channel

Only ’ 94 PMTs for barrel 5% all

Conclusion for QE table: • We made a QE table for MC. • By installing this table, global non uniformity of QE can be correctly reproduced by MC. • Residual edge structure (~5%) will not give large systematic difference because Cherenkov rings smears out their effect.

3. PC 2 PE table PC 2 PE factor ( pico Coulomb to photo electron ) The conversion factor from ATM charge [p. C] to number of photoelectrons [p. e. ]. So far, the same conversion factor is used for all PMTs 1. 0[photoelectron] = 2. 297 [pc] for SK-II

Why we need PC 2 PE value for each PMT in SK-II? Xenon (~30 p. e. light source) Definition of relative Q 1. 3 Relative Q (Barrel) Light reflection from bottom/top 1. 0 Symmetrical structure We adjusted HV by using Xenon. adjust 0. 7 -1500 0 1500 Height of the PMT location (cm) QE difference Upper part of barrel has lower QE, Gain is large. Lower part of barrel has higher QE, Gain is small. Random gain dispersion is acceptable, but systematic gain difference causes large discrepancy with MC.

How to make pc 2 pe table Measurement: We used TQ laser calibration system with which we can easily change its light intensity. We took two data sets with different light intensity: A. multi photoelectron (~ 15 photoelectron/PMT) The average photoelectron Q(i. PMT) was calculated. B. 1 photoelectron The Number of hits H(i. PMT) was counted. We can extract only the gain information by taking the ratio between Q and H.

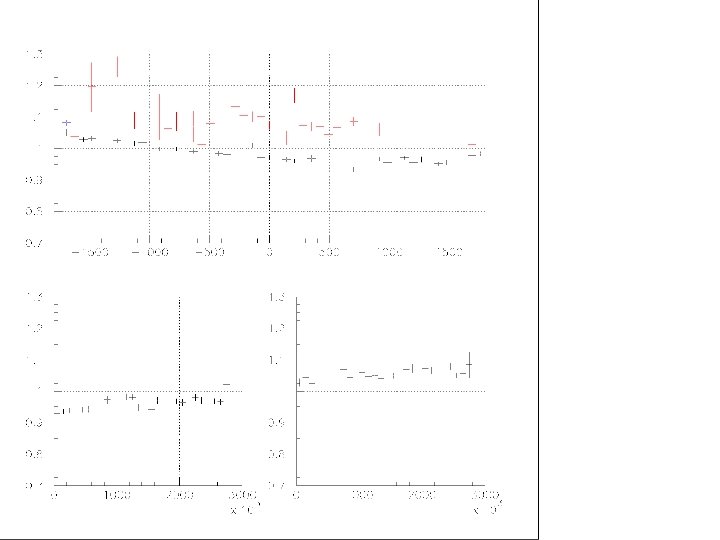
PC 2 PE factor Ni Hit rate in Barrel 1. 3 1. 0 0. 7 0 -1500 Top 1. 3 1500 0 Z(cm) Bottom 1500 Z(cm) We can see the opposite correlation between Ni and PC 2 PE. 1. 0 This result is consistent with Xenon and Ni measurement since Xenon(Q)~Laser(gain) × Ni(QE) 0. 7 0 1000 2000 3000 × 103 R 2(cm 2) -1500 1000 2000 × 103 R 2(cm 2)

Conclusion for PC 2 PE table • We made a relative gain table to correct global structure of the gain difference. • This table is applied for DATA. We keep average PC 2 PE value as: 1. 0[photoelectron] = 2. 297 [pc] for SK-II

3. Water scattering parameters • • • 1. 2. 3. 4. We have 8 light injectors 4 lasers (337, 371, 400, 427 nm) Able to see water quality: Scattering parameters Absorption parameters Time variation Z dependence Essentially no change from the last meeting. Show SK-II water quality and its stability. Light injectors 1 LI for SKI, 8 LIs for SKII
 10 m")
Analysis method – Nhit / Q was observed Number of hit (Nhit) 10 m Radius = 10 m Charge in this area (Target-Q) Top & Bottom LI Charge in this area (Target-Q) Barrel LI
 / Charge (<10 m) Tuned MC and data (already")
Number of hit (<10 m) / Charge (<10 m) Tuned MC and data (already shown in the last collaboration meeting) SK-II data SK-II MC Barrel 3 rd LI, 337 nm Important for horizontal going events SK-II tuned values. Scattered light SK-I data SK-I MC Reflection light Old top LI, 337 nm Only old top exist during SK-I period. SK-I comparison. SK-II tuned values are used for SK-I MC. Water quality of SK-II is good as SK-I within 5%. Other wavelengths and LI positions give consistent results.

Time variation during the year 2003 Jan’ 03 K 2 K beam Dec’ 03 Jan’ 03 Dec’ 03 Blue bands show +/- 5% variation from the beginning of the year 2003. During K 2 K beam period, they are within the band. very stable water quality.

Summary • SK PMT calibration has been performed by: Measurement of TQ relation TQ map for DATA Understanding the origin of QE difference. QE table for MC Understanding the relative gain of each PMT PC 2 PE table for DATA • Water scattering measurement shows Water quality is stable within +/- 5% level and good as SK-I.

Backup

Nickel Data Taken on 3 rd of October, 2003, Source position : “Center” (x, y, z) = (35. 3, – 70. 7, 0) Run 23111~23113 (upside down) Run 23114~23116 (normal) Analysis condition: ・ distance b/w reconstruction vertex and source position =< 4 m ・ N 50 >= 16 ・ Total Q (QISMSK) < 500 pe ・ time difference from the previous event > 100μsec ・ goodness of vertex fit > 0. 4 Averaged to reject up/down asymmetry of the source
 effect")
Only reflection (without water) effect
 effect")
Only water (without reflection) effect
 The correlation")
Scatter plot of 2 data sets for each PMT (p. e. ) The correlation between 2 data 40 Bad PMT dummy 1. 0 Normal PMT The PMT of Black plot has some trouble. Trouble of Charge information 30 Trouble of Time Information TQmap strange 20 Such a PMT’s pc 2 pe correction factor is 1. 0 as a dummy. 154 PMTs 10 The ratio is calculated. And PC 2 PE correction factor is normalized as the average is set to 1. 0. 0 0 2000 4000 6000 8000 (Hits) The absolute fator (2. 297) for SK-II doesn't change.

The effects of PC 2 PE table We confirmed PC 2 PE table works well. Q/H in each PMT We calculated the same ratio (Q/H) by using other light sources. Xenon (30 p. e. ) and Ni (1 p. e. ) RMS=7. 4% Ideally, (Q/H) of all PMT should be same if this table works well. Xenon/Ni We can estimate the merit of this table: RMS=5. 6% 4. 8% Xenon/Ni with PC 2 PE Table

New. Top Barrel 1 Barrel 2 Barrel 3 Barrel 4 Barrel 5 Old. Top Dirty water goes up Bottom ATMrepair 50000 ton/~37 days ATMrepair n Water flow 56 ton/hr flows, ATMrepair n Took 24 hours run for every week ATMrepair n Nhit/Q variation from 20. Jun to 12. Nov. WFstart ATMrepair 1. Time variation of water quality WFstop WFstart(9/22) WFstop Jun Jul Aug Sep Oct Nov

Xe, Horizontal configuration Xe ball has a good uniformity for its equatorial direction. 4 m width r 2, acceptance corrected (ave=1) Up/Down asymmetry in Dec. HV 2 Dec. data Ignore this! 1 wall 0 -180 Top 0 bottom 180 Angle (degree) Top/Wall =+6. 3%, Bottom/Wall=-2. 1%

Up/down asymmetry in current HV Adjusted HV so that each part 2 gives same 1 p. e. distribution Jan. data 1 p. e. distribution SKII top 1 wall Top bottom 0 -180 0 180 Angle (degree) Top/Wall =-2. 2%, Bottom/Wall=+5. 3%

Effect of acrylic plates • For the vertical incident light, Arbitrary scale Calculated value 3000 2000 With Acrylic plate W/o acrylic plate 1000 = 96. 6% 300 400 500 600 Wavelength (nm) • For the Cherenkov light… under study.

QE measurement Recently, We found that Ni source has up/down asymmetry. Gain-table should be made by using the average. Hit-rate Normal position 1. 2 Upside down 1. 1 1 0. 9 0. 8 -1 0 +1 Cosθ
- Slides: 44